Studies of steered arc motion and macroparticle
production in PVD processing.
CRAVEN, Adrian Lewis.
Available from Sheffield Hallam University Research Archive (SHURA) at:
http://shura.shu.ac.uk/19510/
This document is the author deposited version. You are advised to consult the publisher's version if you wish to cite from it.
Published version
CRAVEN, Adrian Lewis. (2000). Studies of steered arc motion and macroparticle production in PVD processing. Doctoral, Sheffield Hallam University (United Kingdom)..
Copyright and re-use policy
ProQuest Number: 10694391
All rights reserved
INFORMATION TO ALL USERS
The quality of this reproduction is dependent upon the quality of the copy submitted.
In the unlikely event that the author did not send a com plete manuscript and there are missing pages, these will be noted. Also, if material had to be removed,
a note will indicate the deletion.
uest
ProQuest 10694391
Published by ProQuest LLC(2017). Copyright of the Dissertation is held by the Author.
All rights reserved.
This work is protected against unauthorized copying under Title 17, United States C ode Microform Edition © ProQuest LLC.
ProQuest LLC.
789 East Eisenhower Parkway P.O. Box 1346
Studies of steered arc motion and
macroparticle production in PVD
processing
Adrian Lewis Craven, BSc(Hons)
A thesi s submitted in partial fulfilment of the requ irements o f
Sheffield Hallam University
for the degree of Doctor of Philosophy
March 2000
Abstract
During the past decade the production industry has constantly strived to improve performance and cut costs, this has been aided by the development of high performance tools. The advancement of these tools has been accomplished by the application of hard wearing, low friction, coatings. A key process in the production of such coatings is Physical Vapour Deposition(PVD). Interest in such thin films has led to much research effort, both academic and industrial, being devoted to the area. In order that these advancements in technology continue, research into the fundamental aspects of PVD is required.
This thesis describes research and experimental studies which have been performed to study the effect of ‘‘steering” an electric arc on various aspects of its behaviour. “Steering” of the arc is achieved by applying external magnetic fields which allow the guidance of the path of the arc. Work by earlier authors has aimed to control the arc more fully. The research presented here is based of a novel electromagnetic three coil steering array of cylindrical geometry. With such coils it is possible to vary' the field profiles to a greater degree than has been previously achieved, permitting a greater range of steering arrangements/fields to be applied. The research presented is divided into two distinct areas:
Firstly a number of experiments were performed to assess the effectiveness of the new steering coils on the motion of the arc. A personal computer was used here along with new arc motion monitoring electronics. This enabled the simultaneous measurement of the orbital transit times and also the degree of travel perpendicular to the steered direction of motion of the arc, as it traversed the surface of the cathode. Such information was then used to produce values for standard deviation of the arc from its steered path, velocity of the arc and a diffusion constant related to the motion of the arc. Such values then allowed evaluation of the stochastic model of arc motion proposed by Care1.
Secondly the effect of changes in magnetic field on the production, ejection angle and size of macroparticles(small molten droplets of the cathode material) was studied. This was accomplished by the design, production and usage of new sample holding equipment. This equipment allowed the coating of highly polished samples at a number of angles in relation to the cathode, with all samples being held equidistant from the arc track. Once such .samples coatings had been produced they were then analysed using a Scanning Electron Microscope!SEM) to give macroparticle density figures.
Acknowledgements
Firstly 1 would like to thank my supervisory team at the University, Dr R New, Professor C M Care and Dr J Cawley, for their time in the form of discussions and English lessons. Of the above I would like to single out Dr R New for special thanks as all along he provided me with encouragement and helpful advice and never gave up on me. I would also like to thank Messrs R Day and G Robinson for making mechanical masterpieces out of my scribblings, all the technical staff in the Division of Applied Physics and the MRI. In addition I would like to acknowledge the part of my fellow PhD researchers for making my time such a memorable one.
I would also like to thank the myriad of organisations(too many to list) who made the conference visit possible by sponsoring me.
Contents
Chapter One: 1.1 1.2 Chapter Two: 2.1 2.2 Chapter Three: 3.1 3.2 3.2.1 Chapter Four: 4.1INTRODUCTION TO PHYSICAL 1
VAPOUR DEPOSITION
Arc Coating Methods 1.1.1 Random arc 1.1.2 Steered arc Present Work
ARC MOTION 9
The Cathode Spot
2.1.1 What is the cathode spot 2.1.2 Life cycle of the cathode spot 2.1.3 Type of spots
2.1.4 Size and current density of a cathode spot 2.1.5 Experimental data on spot motion
Models Of .Arc Motion
2.2.1 Motion of the cathode spot considered as a random walk
2.2.2 motion of the cathode spot under the influence of a magnetic field
MACRO PA RTICLES 38
What Are Macroparticles
Reduction/ Removal Of Macroparticles Reduction of macroparticles
EXPERIMENTAL SETUP 52
Development Of Electromagnetic Control Of The Arc 4.1.1 Control of the arc
4.1.2 The two coil electromagnetic steering array 4.1.3 The three coil electromagnetic steering array Development Of New Hardware For The Vacuum Rig 4.2.1 The three coil electromagnetic steering array 4.2.2 Water cooled anode
4.2.3 Substrate shield
4.3 Apparatus Used
4.3.1 Main chamber and pumping system 4.3.2 The power supplies
4.3.3 The gas control system
Chapter Five:EXPERiMENTAL STUDIES OF ARC MOTION
5.1 Introduction To The Stochastic Model 5 .2 Analysis Of The Arc Motion
5.3 Measurement Of The Arc Confinement 5.3.1 Introduction
5.3.2 Experimental details 5.3.3 Results
5.4 Measurement of The Distribution Of Orbital Transit Times 5.4.1 Introduction
5.4.2 Experimental details
5.4.3 Distribution of spot transit times
5.4.4 Fitting of the data to the theoretical distribution 5.4.5 Results
Chapter Six: EXPERIMENTAL STUDIES OF MACROPARTICLE DISTRIBUTION
6.1 Method Of Investigation 6.2 Sample Preparation 6.3 Analysis Method
6.3.1 Modes of operation of the SEM 6.4 Analysis Of Macroparticle Properties
6.4.1 Angular distribution 6.4.2 Size distribution 6.5 Experimental Results
6.5.1 Angular distribution 6.5.2 Size distribution
76
118
Chapter Seven: SUMMARY AND FURTHER WORK
7.1 Summary Of Results Presented 7.2 Recommendations For Further Work
Appendix A: MATHEMATICS OF THE THREE COIL 146 ELECTROMAGNETIC STEERING ARRAY
Appendix B: PROGRAM DOCUMENTATION 150
1.0 INTRODUCTION TO PHYSICAL VAPOUR
DEPOSITION
Industry constantly demands improvement in components whether it be cosmetic or performance related. To satisfy these demands scientists and engineers have devised numerous methods of producing coatings, Fig 1.1, each with different areas of usage and expertise.
One main area of research, at present, is centred on the use of such coating system to produce films which will allow components to operate under extreme conditions, e.g. drills and dies. The idea being that by modifying the surface, using a film, it is possible to produce a resultant tool which performs better than a piece consisting of either the substrate or coating material alone [2],
CVD
PVD
Chemical.
solution
Laser
S tate
Plasma variants
Plasma variants
Thermal
spray
Weld
Chemic
8. conversion
ction
Surface Loafing Methods
Fig 1.1, Schematic illustrating the different methods of producing coatings, after [1]
three methods of coating can be classified into two types of coating production as shown below:
"Wet treatments”- Solution state
Currently the usage of these methods is vast, ranging from painting to electroplating systems. They show good reliability and reproducibility, but do have environmental problems.
"Dry treatments" - Gaseous and molten states
Such methods have been developed over the past 30 years and use mainly plasmas to deposit the materials. Their main advantage is that the coating composition and growth rate can be controlled, which is critical for the areas of usage e.g. semiconductor industry. The majority of these processes involve treatment under vacuum in the presence of either a reactive or inert gas, meaning a wide range of coatings can be achieved.
One such method of producing the coatings is physical vapour deposition(P.V.D). PVD has been used since the 1970's to produce metal films for coating tools[4,5j. Although, as mentioned above, the main purpose of the process is to increase efficiency and longevity of work pieces, other areas such as decorative finishes are also possible. Uses for such coatings range from spectacle frames to CDs and turbine blades to drill bits, showing that this technique generates a wide range of products. The term PVD encompasses a large variety of coating mechanisms which all have a common element, they are performed under partial vacuum, Fig 1.2. The type of process investigated in this thesis is called cathodic arc, or sometimes vacuum arc, PVD and uses a high current low voltage electrical discharge to evaporate the cathode material.
the subsequent coating then degradation and premature failure of the film and work piece can occur.
Anode
PSU
Vacuum
pump
vaporated
material.
Gas
upply
Cathode
Fig. 1.2, Sketch of a PVD system, after [3]
-Anode
Metal iom
Metal, ions
Microdroplets
(macroparticles)
Dense plasma
region
°N eutral metal
vapour
■® Metal
—■■e.ions
1.1 Arc Coating Methods
There are two coating techniques which utilise the cathodic arc. They are named according to the arc motion employed to evaporate the cathode, random and steered.
1.1.1 RANDOM ARC
The random arc method involves the striking of an arc on the cathode and allowing it to traverse the surface freely. This technique was developed in the United States!61 an^ the Soviet Union[5] in the early 1970's and was used to produce hard, durable and well adhered thin films. Unfortunately the use of this process is limited by the fact that the arc is not guided and can therefore dwell on some spots longer than others. This extra time spent evaporating the cathode leads to an increase in the production of macroparticles. The random movement of the arc also means that the ion flux from the cathode spot varies, leading to problems with the production of reliable uniform compound films.
1.1.2 STEERED ARC
Here the motion of the arc is controlled by an externally applied magnetic field produced by permanent magnets and/or electromagnets(see chapter 4 for more detail). The magnetic field forces the arc to follow a certain path, as well as affecting the velocity at which the arc moves. Some aspects of this control are understood whereas others; such as retrograde(non amperian) motion are not. The aims of this thesis are to improve the understanding of the influence of the magnetic fields on the motion of the arc and to investigate the effect of the fields on the macroparticle production rate (see chapter 3).
arrangement proved much more robust as there were no mechanical movements involved.
R osette pattern
of steere d arc
Cathode
ro s e tte oattern
Area of cathode
covered by arc
Fig 1.4, Sketch of the path followed by the arc on the surface of the cathode
Arc
'path
1.2 Present Work
There are two main areas covered by work in this thesis. The first involves the investigation of the cathode spot under the influence of a magnetic field. This work is required as at present our knowledge of the importance of certain parameters is incomplete. There are many mathematical and phenomenological models of arc motion which try to explain the nature of the cathode spot and how it moves around the cathode. To fully assess the validity of these models we need to investigate certain areas further. Using the experimental results obtained it is possible to test these models. Secondly work has been undertaken to study the production and distribution of macroparticles as a function of magnetic field.
Considering the information presented here and the review of current literature(chapters 2 and 3), the following areas were identified wiiich required further research:
i. To develop novel electromagnetic steered arc control system, which will allow a greater degree of control to be exerted on the motion of the arc. The system allows a degree of independent variation of confinement, orbital velocity and orbital radius.
ii. To use this steering system to perform experiments to determine certain spot parameters, such as spot confinement and velocity distributions.
iii. To compare the experimental data with model predictions, for example those of Care[9], to give a clearer understanding of the effect of various elements of the magnetic field upon cathode spot parameters.
iv. To use the steering array to perform experiments to determine the angular and size distributions of macroparticles as a function of spot parameters, and magnetic field.
This thesis describes the w?ork performed in the above areas and is organised as follows:
« Chapter 3 is a review of macroparticle production. This chapter examines experimental data from current literature regarding the production of macroparticles, as well as operational parameters which affect this process.
• Chapter 4 is a description of the development of the experimental apparatus. Firstly the evolution of the novel steering array, including the design and implementation, and secondly the design and use of other new hardware developed to facilitate this research. Finally there is a description of the experimental system used, including details of the main chamber pumping system, power supplies used and details of the gas control system utilised in these experiments.
• Chapter 5 consists of a description of arc monitoring equipment used for this research, along with the results which were obtained from experiments. The results are then compared with those predicted by the model of Care[9j.
• Chapter 6 consists of an explanation of the methods used to study the production of macroparticles, as well as the experimental results obtained.
REFERENCES
[1] L A Donohue
PhD Thesis, Sheffield Hallam University (1995)
[2] D S Rickerby, A Mathews
"Advanced Surface Engineering", Blackie press (1991)
J31 P J Walke
PhD Thesis, Sheffield Hallam University (1994)
HI Vacuum arcs, theory and applications
J M Lafferty(editor), Wiley Interscience (1980)
[5] L P Sablev
US Patent No. 3, 783, 231 (1974)
HI A A Snaper
US Patent No.'s 3, 625, 848 (1971), 3, 836, 451 (1974)
[7] S Ramalingham
US Patent No. 4, 673, 477 (1987)
J8J J R Morrison
US Patent No. 4, 724, 058 (1987)
{9] C M Care
2.0 ARC MOTION
Over the past few decades many authorsfl, 2 ,3 , 4] have studied the motion of the cathode spot and a large amount of experimental data has been compiled. Unfortunately there are discrepancies between some experimental parameters measured by different authors. This is probably due to experimental difficulties associated with small spot size, high spot velocities and the obstruction of the view of the cathode spot which the plasma cloud causes.
This chapter summarises the experimental work performed in the field and covers a range of areas including:
• Spot life cycle
• Types of cathode spot observed
• The size and current density of the cathode spot « Spot splitting
• Spot motion
2.1
The Cathode Spot
2.1.1 WHAT IS THE CATHODE SPOT ?
“Cathode spot’' is the term given to the point where the arc touches the cathode surface. This small area is heated, due to large current densities, emitting metal vapour into a cloud above the spot. As time passes the cathode is continuously eroded and a crater is formed. At some time the spot dies and another is formed.
2.1.2 LIFE CYCLE OF CATHODE SPOT
Guille and Juttner [5] reviewed the life cycle of the cathode spot and suggested that it may be divided into four stages, as shown diagramatically in Fig 2.1 and described as follows:
Surface Explosion Melting, deformation, o f liquid
Plasms Clout Hasma Cloud
Crater Formation Crater Displacement
Figure 2.1, Diagramatic representation of the life cycle of a cathode spot after| 5]
(a) Surface Explosion
i) Since the surface of the cathode is not flat, but is instead made up of micro protrusions, at the tip of these micro protrusions the field will be intensified[9], Hence this enhancement factor could be sufficient to provide the field gradients required for field emission.
ii) The adsorption of gases from the chamber by the cathode will affect the work function of the cathode and thus increase the chance of electron emission.
(b) Melting and Deformation of the Liquid
The above leads to one of two outcomes, either the protrusion is totally obliterated leaving a flat surface, meaning that the plasma pressure alone creates a crater [5,10], alternatively the explosion could leave remnants of the protrusion. Ecker [11] believes that a combination of the plasma pressure and the surface tension then act on the remains of the protrusion to destroy it, leaving a molten pool which could be moved by the plasma pressure.
(c) Crater Formation and Steady State Operation of the Spot
The preceding steps represent only a small fraction of the lifetime of the emission site. Initially it is the pressure of the plasma which exerts itself on the surface of the cathode creating a crater, then most of the time is taken by evaporation of the cathode surface into the plasma cloud above it.
A considerable ion flux is emitted by the spot and most of the ions are multiply charged[12], Plyutto [13] also observed that the ions emitted in the flux leaving the surface had larger energies than expected. There are 2 models which describe this anomaly, the Potential Hump model [14] and the Gas Dynamic model [15]. Both models are described by Sanders et al [16], Experimentally neither totally explains the exact behaviour, but a combination of the two causing an averaging effect may provide a better description.
(d) Crater Displacement
not having sufficient current density to evaporate any more material, and then the cycle repeats itself.
A more in depth review of the life cycle of a cathode spot can be obtained from the thesis of P Walke [17].
2.1.3 TYPES OF SPOTS
Rahkovskii et al[l] and also Jiittner et al|4] were the first to identify that there were two different “types” of spot, and have been supported by the experimental work of other authors[2, 3, 18, 19]. The existence of the two Types of cathode spot is of great importance when considering experimental data as the size, behaviour and appearance of the two Types are very different. The following are descriptions of the two Types of spots.
Type 1 Spot
Lyubimov and Rahkovskii[l] noted that a Type 1 spot only appears on "new" cathodes, and that it does not exhibit a high erosion rate. Bushik et al[2] believed that this description of the cathode spot was not accurate enough and added that the discharge was fed by absorbed gases such as hydrocarbons, water vapour, oxides, and gave supporting experimental evidence. This research consisted of "arcing" the cathode until no Type 1 spots were visible , then exposing the cathode to air for a short time followed by a return to vacuum. It was found that when an arc was struck on the exposed cathode then the Type 1 spots had reappeared.
Type 2 Spot
Type 2 spots gradually appear on a cathode as it is being "arc cleaned" and coexist with Type 1 spots during this phase. Fang[20] noted that it took approximately 100 discharges for the velocity of the arc to reach a steady state value, indicating that the surface of the cathode had been purged of impurities. Type 2 spots have a higher erosion rate as they use thermal processes to evaporate the surface of the cathode, emitting a glow of a colour characteristic of the cathode material.
The spot traverses the cathode with a lower velocity than that of a Type 1 spot, since now the arc moves a distance of approximately the crater radius resulting in less erratic motion of the arc across the cathode.
More details on the two Types of cathode spot can be obtained from other literature! !, 2, 3, 4,21]
2.1.4 SIZE AND CURRENT DENSITY OF A CATHODE SPOT
Size and current density of the spot are interrelated as the current density depends directly upon the active area of the cathode spot. The size of the spot is still a matter of contention as the two main methods by which its diameter has been measured give conflicting results:
a) Autograph Method!22, 23j - Here the tracks left by the arc on the surface of the cathode are measured and the width taken as the diameter of the cathode spot. This measurement has an inherent disadvantage as it cannot be performed in situ in the vacuum chamber, but it does have the highest resolution (<0.1pm).
directly from the image of the spot, as opposed to measuring the tracks left in the surface of the cathode.
Juttner at al J25] proposed yet another way to determine the current density of the cathode spot. This method involves the measurement of the change of the arc current signal as it crosses a slit in the cathode. When this change was combined with measurement of spot velocity an estimate of the current density was produced which was of the same order as that obtained using the autograph method.
The two main methods of measuring the diameter of the cathode spot give rise to significantly different values; 10‘5m using the autograph method and 1 0'4m using the high speed photography. This difference leads to estimates of current densities which range from 1011 to 1012Anr2 and 4x10⁸ to 1010Am-2. Greater detail into the search for the true spot size can be obtained from Daalder [22].
Spot Splitting
100
Q.
Bismuth Zinc Aluminium
1000 100
Current(A)
Fig 2.2(a), Plot of arc current vs. number of spots after[27]
Fig 2.2(b), Plot of spot splitting threshold current vs. thermal properties of cathode material after [27]
100
C
0)
L-L.
3o O) c
10
a </> oa co
10
0.1
fbo
1000 100002.1.5 EXPERIMENTAL DATA ON SPOT MOTION
The aim of this section is to introduce the reader to the movement of the cathode spot around the surface of the cathode. The following are the most relevant experimental observations in the context of this thesis.
Random Arc Motion
This type of motion occurs in the absence of externally applied magnetic fields. The term random walk is used to describe the erratic movement of the arc as it traverses the surface of the cathode. Random arc operation is commonly used in commercial systems as a method of cleaning the surface of the cathode prior to a coating process being started.
Both Hantzche et al| 28,38] and Daalder[39] treated the motion of the cathode spot as a random walk and produced the same expression/model, for the motion of the arc, independently of each other. Their models incorporated a spot diffusion constant whose value is dependent upon two parameters, the mean crater radius and a constant of spot displacement. A more detailed explanation of these models can be seen in 2.2.1. Equation 2.1 is an expression for the diffusion constant when considered in two dimensions
(*’) 2
a = ^ - EQ2.1
2 T
where s' is the mean spot displacement in two dimensions and x is the mean elementary time step. Hence the diffusion constant increases for larger crater radii.
The expression for a can be further expanded if we assume that s' is proportional to the crater radius, r, i.e.
s’ = yr, where y is the constant of spot displacement Substituting this expression for s' into EQ 2.1 gives
^ r 2
a = L EQ 2.2
2r
to different experimental arrangements. It appears that the major disagreement is on spot displacement, which it seems is strongly linked to the surface contamination.
Steered arc motion
The term steered arc is applied to the motion of the cathode spot under the influence of an external magnetic field. It is well known, e.g. [30], that between certain ranges of chamber pressure and magnetic field that the arc moves in the retrograde, non amperian, direction i.e. in the direction of - j a B.
Velocity of the arc
The velocity at which the arc traverses the surface of the cathode has been found to be dependent upon a number of parameters. During the 1950's Galagher[31], working with a mercury pool cathodefand other materials), defined three parameters to which the velocity of the arc was related:
. GAS PRESSURE
As mentioned previously, between certain pressures the arc moves in the retrograde direction. Galagher noted that the velocity decreases linearly with respect to an increase in the chamber pressure. If however a threshold level was reached then the arc would revert to motion in the amperian direction. He used a variety of different cathode materials, and backing gases, and found that this threshold level was dependent upon the type of cathode used. This point is also illustrated by work performed by Drouet[32] in which the pressure of the background gas, argon, was increased and changes in the velocity noted.
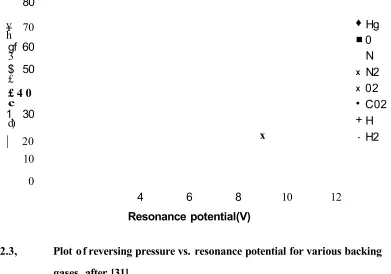
. SPECIES OF BACKING GAS
90 80
¥ 70 h
gf 60
3
$ 50
£
£ 4 0
c
1 30
d)
|
2010 0
x
4 6 8
[image:28.620.106.497.61.335.2]Resonance potential(V) 10 12 ♦ Hg ■ 0 N X N2 X 02 • C02 + H - H2
Fig 2.3, Plot of reversing pressure vs. resonance potential for various backing gases, after [31]
. MAGNETIC FIELD AND ARC CURRENT
Galagher performed experiments to determine the velocity of the arc at various currents and magnetic fields, producing two plots. Figure 2.4(a) shows the velocity as a function of magnetic field; over the central portion the relationship is linear. Fig 2.4(b) shows the velocity as a function of the arc current, this plot shows a plateau ; above a certain current any increase leads to only a slight increase in velocity of the arc.
70 -60
to
50 8 40 > 30
o < 20
1000 2000 3000 4000
0
1=1.5A
Magnetic field(Gaus)
Fig 2.4(a), Plot of arc velocity as a function of magnetic field, after [31]
70 60 S' 50
E .■S' 40
oo
a 30
o
<
20 100
0 5 10
Arc current(A)
2220G ■*— 1540G
970G
Fig 2.4(b), Plot of arc velocity as a function of arc current, after [31]
[image:29.618.94.478.34.555.2]30
25
20
15
10
5
0
2
4 68
100
[image:30.616.93.439.30.268.2]B(x0.01T)
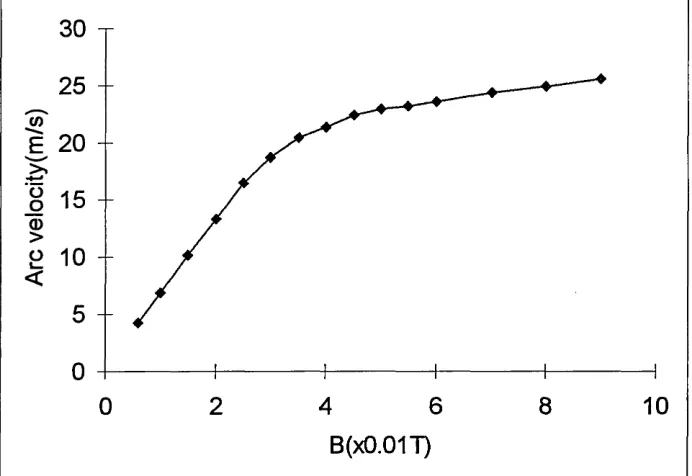
[image:30.616.91.482.223.600.2]Fig 2.5, Plot of arc velocity vs. magnetic flux density, after [33] Fig 2.6, Plot of Arc velocity vs. magnetic field, after[34]
2000
1500
3iT
i- 1000
^ * o> 500 o
<
0
-500
Magnetic field(T)
Fang[20,35] performed experiments to investigate the relationship between velocity and arcing number. From this plot, Fig 2.7, it can be seen that after a substantial number of arcs, approximately 50, the velocity of the arc stabilises. This levelling off of the arc velocity fits well with the idea of two different Types of cathode spot which has been noted by others such as Froome 1949/50, Hoyaux 1972 and Rahkovskii 1972.
in jE &u _o a>
>
o s_
<
30
25
20
15
10
5
0
50 100 150
0
[image:31.617.83.470.120.372.2]Number of arcs
Fig 2.7, Plot of arc velocity as a function of number of arcs, after [20,35]
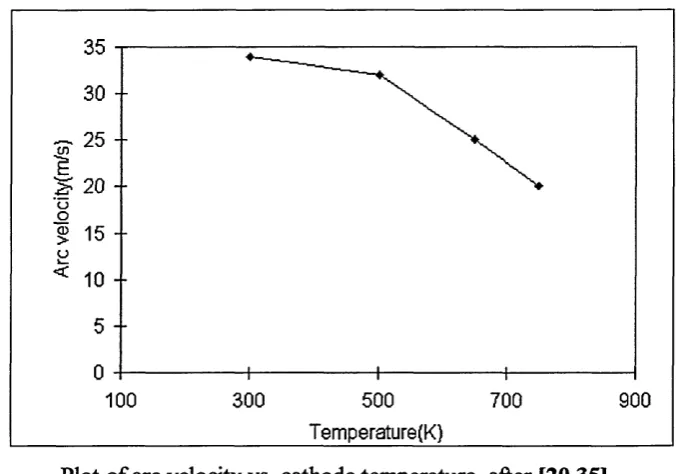
During the work performed above by Fang it was also noted that the velocity of the arc also showed itself to be linked to the temperature of the cathode and the electrode spacing, Fig 2.8 and 2.9.
[image:31.617.83.481.456.719.2]30 --cn 2 5 - 1
& 20
-10
-500
Temperature(K)
700 900
[image:32.615.124.464.14.251.2]100 300
Fig 2.9, Plot of arc velocity vs. cathode temperature, after [20,35]
The final parameter linked to the arc velocity is surface roughness and general condition of the cathode. Juttner et al[19] investigated the effect of the surface imperfections on the arc motion. They observed that the arcs tended to follow scratches or imperfections on the surface of the cathode; this was attributed to preferential accumulation of debris and contamination at these sites. Tying in with earlier work Fu[36] investigated the effects of surface roughness on the characteristics of arcs. It was discovered that a rougher surface has several effects:
• Longer arc lifetimes • Lower arc voltages
• More diffuse motion of the spot.
• Higher retrograde velocity under the influence of a magnetic field
• Higher maximum erosion per Coulomb from the surface. This was related to the conical protrusion model of Daalder[37]
2.2
MODELS OF ARC MOTION
2.2.1 MOTION OF THE CATHODE SPOT CONSIDERED AS A RANDOM WALK
The following is a description of the models of arc motion mentioned in 2.1.5, and is based on the work of Daalder[39j. Daalder assumed that the cathode spot moves from the origin of an x-y co-ordinate system. During each time step, x, the spot can move a step of +s or -s in the x or y directions, with these movements being assumed to be of equal probability. We now consider a string of n such movements taking a total time t (i.e. t=nx). Assuming that this chain consists of a large number of events and that the displacements along the axes are independent, then the probability density function for the position of the cathode spot, P(x,y), can be written
p (x ,y) Inerti exp- fv 2
2 , 2
x +yat j EQ 2 .3where a is the diffusion constant
This expression can be translated into cylindrical co-ordinates giving the probability , P(R), of the spots being between R and 6R from the origin
/ ^ R
P{R) = — ex
p-at
r r 2 \
\la t
jA value of mean spot displacement, R , follows from this distribution. Following from 2.1.5, since we are now considering motion in the x and y directions then the elementary step, s(l dimension), now becomes s!(2 dimensions), where s'= syf:2
and
R
/" 2 .\ 7IS I 0.52r
in both directions. Thus Daalder concluded that the motion of the cathode spot is a 2D random walk.
Independent work by Anders and Juttner[13] also found evidence of the spot motion being a random walk phenomenon.
2.2.2 MOTION OF THE CATHODE SPOT UNDER THE INFLUENCE OF A MAGNETIC FIELD
Over the past several decades numerous authors[30,41,42,43] have studied the effect of externally applied magnetic fields upon the motion of the arc. The following covers the different types of models which try to explain this motion. The most important test of any of these models is their ability to explain the retrograde motion of the arc. There are several different categories into which these models may be placed. The first four categories attempt to explain the reason why the arc moves as it does, but the final type of model aims to accurately describe the motion in relation to given characteristics. The categories are:
a. Asymmetric confinement of the plasma associated with the cathode spot b. Movement of the positive space charge above the cathode spot
c. Movement of the plasma associated with the cathode spot d. Influence of the field upon the plasma column
e. Stochastic model of the cathode spot
The last of these options is covered in more detail here, as the predictions from the model by Care[44] are tested against experimental results obtained by the author(see chapter 5).
(a) Asymmetric confinement of the spot plasma
\7QG
u
500 400
(1500/ 200
. i j
FIELD CONTOURS IN X104T
Fig 2.10, A magnetic field contour plot of the cathode spot region, after[ 17,32,45]
qasma
Cathode
Self field adds i Self ■ field interferes
to applied field with applied field
and gives
' to give expansion
confinement
I
Fig 2.11, Effect of asymmetric confinement on the plasma, after [32,45]
Furthermore Drouet calculated that for external magnetic fields in excess of 1 Tesla the self field would be negligible, meaning the arc would again move in the amperian direction.
Two consequences arise from this theory:
* It indicates a subspot structure.
• The maximum distance which the arc spot can jump corresponds to the radius of the plasma cloud.
(b) Movement of the space charge above the spot
Spot
outline
Fig 2.12, Sketch of the cathodes spot according to Harris, after [46]
If a magnetic field is now applied this will lead to the Lorentz force moving the electron cloud in relation to the positive space charge cloud, without moving the emission site. The shift in the negative space charge to the retrograde side of the spot means that the positive space charge is exposed producing an increase in electron emission. The effect of such an increase in emission is that there will be a displacement of the mean locus of emission in the retrograde direction covering the recently exposed positive space charge. Harris used the model to calculate various spot parameters, which agreed well with experimentally obtained values.
It is also noted that much earlier Longini[47] had proposed that retrograde motion of the arc was dependent upon a net space charge shift, though this model did not account for amperian motion above a certain temperature[48,49,50].
(c) Movement of the plasma associated with the cathode spot
stream of ions being carried away from the cathode gives rise to a reverse force in the retrograde direction, Fig 2.13.
An expression for the velocity of the spot is then derived and is dependent upon the magnetic field and the pressure of the surrounding gas. These values of velocity are compared with work of Kesaev and show good agreement.
of
Fig 2.13, Production of reverse force, after[51 ]
(d) Influence of the magnetic field on the plasma column
At present there are three models which propose the effect of the field on the plasma column as the reason for retrograde motion. They all treat the column as flexible but fixed at the cathode spot end, Fig 2.14.
Ionisation of
neutral.
Av. tra jec to ry
neutral atom
Cathode
sheath
Ion-neutral
collision
Ion
traje cto ry
Electron
trajecto ry
Retrograde
Centre of
m rvati
ireStraight axis
Disturbanc
Discharge
channel
Path along current
channel axis in the
direction of the
electric field
The first model to use this approach was constructed by Robson and von Engel 134] They believed that the motion was due to unequal deflection of the arc column, It is pointed out that the column above the spot has a high electric field, with respect to the electric field of the cathode spot. Here the column is assumed to be deflected in the Lorentzian direction, and strongly curved near the cathode. Thus a force acts upon the cathode spot which is related to the sum of the applied field and the self field generated by the curved column, see Fig 2.15
Anode
Retrograde
direction Amperiandirection
Cathode
Fig 2.15 Arc in presence of transverse field, after [34 J
i.e. If the self field is greater than the applied field then the spot will move in the retrograde direction.
At the time of the construction of this model there were some doubts as to its validity, the main problem being that the fields required would mean that the spot would have to be substantially smaller than was currently thought. More recent work regarding spot micro structure(2.L4) would lead to greater current densities and hence higher self fields.
retrograde direction. Hence as the applied magnetic field increases then so does the retrograde force acting upon the spot. At some threshold point an equilibrium between the self field and applied field is reached, above which any increase in the applied field will lead to a force in the amperian direction.
The model also explains a number of features exhibited by the arc, such as:
» Temperature dependence of the velocity of the arc ® Pressure dependence of the velocity of the arc
• The effect of the cathode material upon the velocity of the arc ® The effect of surface condition on the velocity of the arc
The authors also note that retrograde motion of the arc is predicted for current densities in the order of 10I2Anr2, this being in the range of current densities which have been experimentally observed.
Finally there is the model by Schrade[53J. In this model a force acts upon the current carrying channel(arc column), and is dependent upon the self and applied magnetic fields present in the system. This leads the author to the following conclusions.
Plasma and
vapour je ts
Current carrying
plasma channel
(unstable bent)
New spot site
Spot crater
Fig 2.16, A sketch of the effect of the bending of the plasma column, after[53}
(e) Stochastic model of arc motion
This is the final model describing the motion of the arc in this chapter. The model by Care[44] is of particular interest to us, as in chapter 5 the experimental results are compared to values predicted by the theory. Care considers the arc to be moving on a two dimensional grid, Fig 2.17, on the surface of the cathode. The “forces” which influence the spot arise from the application of the transverse and normal components of a magnetic field. It has been observed that the arc moves with a velocity proportional to Br and is confined to move along a path described by the Bn=0 position.
Fig 2.17, 2-D grid as envisaged by Care[44]
bring the spot back to the path at which BN=0(and x=0). The forces described above are explained in more detail in chapter 4, section 4.1.1.
Using these forces and assumptions Care then derives a Fokker-Plank expression. This equation(EQ 2.4) describes the probability density, q>, of the arc’s position with respect to time.
C(p
d dyM 2 + D. +
Term (a)
C^P_
Term (b)
+ , , dtp
/ w * +z r
Term (c)
EQ 2.4
Dy = a{ P m
+ P (4))
Dx=
a(pm + P m ) c = b( Pw - P m ) f ( x) = b { p W - P m }Examining EQ 2.4 and 2.5 it is possible to interpret the expression physically as follows.
# If no magnetic field is applied P0)=P(3), P(2)=P(4) i.e. c=0 and f(x)=0
Hence only term (a) will remain, meaning that the arc will diffuse across the surface of the cathode at a rate governed by Dx and Dv.
• If a transverse field(BT) is now applied then c, and term (b)in EQ 2.4, will become non zero. This will have the effect of driving the arc along the x-axis, moving with a mean velocity c and the random diffusive motion superimposed on the driving motion.
REFERENCES
11] G A Lyubimov, V I Rahkovskii
Soviet Physics Technical Physics, 21(8) (1978) 693
[2] A 1 Bushik, B Juttner, H Pursch
Beitrage Aus Der Plasmaphysik, 19(1979) 177
[3] V I Rahkovskii
IEEE Transactions on Plasma Science, 4(2) (1976) 81
[4] B Juttner
IEEE Transactions on Plasma Science, 15(5) (1987) 474
[5] A E Guille, B Juttner
IEEE Transactions on Plasma Science, 8(3) (1980) 259
[6] A Hull
Physical Review, 126(5) (1962) 1603
[7] V V Kanzel, V I Rahkovskii
Proceedings of 6th International Symposium on Discharges and Electrical Insulation in Vacuum, Swansea, (1974) 265
[8] F R Schwirzke
IEEE Transactions on Plasma Science, 19(5) (1991) 690
19] L A Sena, L I Pranevychius, G.N Fursey
Proceedings of 10th International Conference on the Phenomenon on Ionised Gases, Oxford, (1971) 105
[11] GEcker
Vacuum Arcs, Theory and Application, J M Lafferty(editor) Wiley Interscience (1980)
112] J Kutzner, H C Miller
IEEE Transactions on Plasma Science, 17(5) (1989) 688
[13] A A Plyutto, V N Rhyzkov
Soviet physics JETP. 20 (1965) 328
[14] O Lloyd
Proceedings of 10th International Conference on the Phenomenon on Ionised Gases, Oxford, (1971) 184
[15] V L Sizonenko, M I Markov, L I Kiselevski, G G Shergin Soviet Journal of Plasma Physics, 11 (1985) 1259
[16] D M Sanders
Journal of Vacuum Science & Technology A, 7(3) (1989) 2339
] 17] PJW alke
PhD Thesis, Sheffield Hallam University, September 1994
[18] Y H Fu, R P Smeets
IEEE Transactions on Plasma Science, 17(5) (1989) 727
[19] B Juttner, H Pursch, V A Shilov
Journal of Physics D: Applied Physics, 17 (1984) L31
[20] D Y Fang
Journal of Physics D: Applied Physics, 15 (1982) 833
[21] E Hantzsche, B Juttner
f 22] JE Daalder
IEEE Transactions on Power Application Systems(PAS), 93(1974) 1747
[23] B Juttner
Beitrage Aus Der Plasmaphysik, 19 (1979) 25
[24] G P Smith, R Dollinger, D P Malone, A S Gilmour Journal of Applied Physics, 51(7) (1980) 3657
[25] B Juttner
Journal of Physics D: Applied Physics, 17 (1984) LI 1
[26] B E Djakov, R Holmes
Proceedings of 1st International Conference on Gas Discharges, London, (1970)468
]27] B E Djakov, R Holmes
Journal of Physics D: Applied Physics, 4 (1971) 504
{28} E Hantzsche, B Juttner, H Pursch
Journal of Physics D: Applied Physics, 16 (1983) L173
[29] J E Daalder
Journal of Physics D: Applied Physics, 16 (1983) L I 77
[30] P D Swift, D R McKenzie, I S Falconer, P J Martin Journal of Applied Physics, 66(2) (1989) 505
[31] C J Gallagher
Journal of Applied Physics, 21 (1950) 768
[32] MDrouet
[33] J C Sherman, R Webster, J E Jenkins, R Holmes Journal of Physics D: Applied Physics, 8 (1975) 696
[34] A E Robson, A von Engel Physical Review, 93 (1954) 1121
[35] D Y Fang
Journal of Nuclear Materials, 111/112 (1982) 517
[36] Y H Fu
Journal of Physics D: Applied Physics, 22 (1989) 94
[37] J E Daalder
PhD Thesis, Eindhoven University of Technology, (1978) 66
[38] E Hantzsche
Beitrage Aus Der Plasmaphysik, 17 (1977) 65
[39] J E Daalder
Journal of Physics D: Applied Physics, 16 (1983) 17
[40] S Anders, B Juttner
IEEE Transactions on Plasma Science, 5 (1991) 705
[41] E A Litinov, G A Mesyats, A G Parfenov
Soviet Technical Physics Letters, 16(9) (1990) 723
[42] A E Robson
Journal of Physics D: Applied Physics, 11 (1978) 1917
[44] C M Care
Journal of Physics D: Applied Physics, 25 (1992) 1841
[45] M GDrouet
Japanese Journal of Applied Physics, 20(60 (1981) 1027
[46] L P Harris
Proceedings of 10th International Symposium on Discharges & Electrical Insulation in Vacuum, (1982) 106
[47] R L Longini
Physical review, 71 (1947) 642
[48] C G Smith
Physical review, 73 (1948) 543
[49] J D Cobine, C J Gallagher
Electrical Engineer, 68 (1949) 469
[50] D Y Fang
IEEE Transactions on Plasma Science, 11(3) (1983) 110
[51] A P Nevskii
Soviet Physics Technical Physics, 14(6) (1969) 803
[52] J S Hong, J E Allen
Europhysics Conference Abstracts, IGC, III (1992) 2033
[53] H O Schrade
3.0 MACROPARTICLES
3.1 What Are Macroparticles ?
As has been discussed earlier, when an electric arc interacts with the cathode surface a very small highly active emission site which produces a high velocity stream of cathode material, consisting of several components,
• Metal ions
• Neutral metal vapour
• Microdroplets, often known as macro particles
Metal ior
Metal ions
Microdroplets
(macroparticles)
Dense plasma
region
°Neutral metal
vapour
Metal
Fig 3.1, Illustration of the elements produced by an arc discharge
3.2 Reduction/ Removal Of Macroparticles
The extent to which cathodic arc PVD(CAPVD) systems are used in industrial coating arrangements is seriously affected by the production of macroparticles. It is because of this that many authors! 1, 2, 3, 4] have investigated methods by which they can be reduced or removed.
3.2.1 REDUCTION OF MACROPARTICLES
Over the course of several years a number of workers have catalogued the effect of various parameters upon the production rate of the macroparticles, and have examined methods to control their deposition. The following section is devoted to summarising this work.
* Cathode material
Work by Anders et al[ 1 ] showed that there was a strong dependence of macroparticle production rate on the type of material being used as the cathode. They found that materials with lower melting points produced a much higher number of macroparticles, Fig 3.2. This work supported earlier findings by Daalder[2] into cadmium and copper cathodes. Miinz et al [5] also investigated macroparticle production of a variety of cathode materials with their results supporting the work of Anders and Daalder. They also noted that, when using chromium as the cathode material, a large number of smaller macroparticles were observed. This result was attributed to shrinkage of the droplets due to sublimation either as the macroparticle is in flight, or alternatively after it arrives at the substrate.
» Arc current
Diameter(microns)
Fig 3.2, Particle size distribution, f(d), for various cathode materials, after[l] Fig 3.3, Number of macroparticles versus arc current, after [3]
© 30
o 10
Arc current(A)
• Cathode temperature
• Cathode to substrate geometry
Daalder[8] noted that the majority of the droplet mass is ejected between 20° and 30° from the plane of the cathode. Although it would seem imply that the majority of macroparticles are ejected in this angular range it is not necessarily the case. In Daalders paper the volume of each particle is calculated and then the mass, thus since particles under consideration range from 2pm to 50pm the mass of the largest macroparticle will be more than a ten thousand times more massive than that of the smallest one. Aksenov[9] noted that an appreciable number of small macroparticles travel in the direction normal to the cathode. Therefore if the surface roughness of the piece is critical the angle between the cathode and substrates should be taken into consideration. Work by Baouchi et al[4] also seems to conflict with the results of Daalder, as they find the peak emission angle to be at 60°. It would therefore seem that there is great confusion regarding the angular distribution of macroparticles, since there are a number of methods to describe the macroparticle flux, ranging from mass and volume to actual number of macroparticles. Work presented in chapter 6, uses the number and size of macroparticles counted to assess the contamination due to droplets.
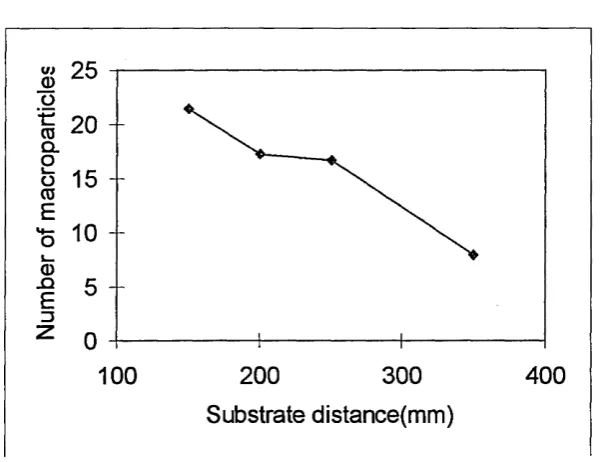
Tai et al[3] noted that the distance between the cathode and the substrate is also critical when considering macroparticles, as is illustrated by Fig 3.4.
a 25
S 20
-CL
200 300
Substrate distance(mm)
[image:52.620.143.444.477.708.2]400 100
Since the droplets are ejected with a finite amount of energy, any increase in substrate to cathode distance could lead to a decrease in the number of macroparticle included in the coating. Anders et al [11] investigated the possibility that gravity was affecting the distribution of macroparticles. The results were obtained by placing samples at various positions about the coating axis and they show that gravity will only affect macroparticles above 10pm in diameter.
• Species, partial pressure, of backing gas used
Several authors[3, 4, 6,10] have noted that the type of reactive gas, as well as its partial pressure, can lead to a change in the macroparticle production rate. This is illustrated by Fig 3.5, which shows the effect of the change in partial pressure on the number of particles detected.
co 30 ■F 25
o 2 0
-=45 A 15
-2 10 -<d
-Qc 5
[image:53.620.97.490.261.538.2]--Partial pressure(mT)
Fig 3.5, Partial pressure versus Number of macroparticles counted, after [4]
• Use of a magnetic field
Numerous authors[3, 4, 10, 12] have studied the effect of magnetic field upon the motion of the arc, and consequently the production of macroparticles. The velocity at which the arc moves across the surface of the cathode and the confinement of the arc to a given path determine the droplet production rate. The effect of these parameters is discussed in more detail in chapter 6.
• Control of the "sticking" of the macroparticles to the substrate
Work by Tai et al[3] showed that the application of a negative bias to the substrate would reduce the number of macroparticles adhering to it. They found that if the bias voltage was changed from -20V to -300V a drop from 2.6xl04 to 7.1xl03 could be achieved, see Fig 3.6 for graphical illustration of results. This was supported by Vyskocil and Musil[13] who produced photographs of the surface of substrates obtained using a range of bias voltages.
Vyskocil and Musil also performed experiments to assess the impact of substrate heating on the adhesion of macroparticles. Their results are illustrated by two micrographs taken at 50°C and 500°C which showed a decrease in the number of macroparticles "sticking" to the substrate during deposition.
o
oo 25
->< wTa>
o 20
-(Q
Q.
O 15
-o(0
E 10
-«*•o
o z
-200 -150 -100 -50
-300 -250 0
-350
[image:54.620.84.447.426.674.2]Bias voltage(V)
• Rotation of the cathode
Kang et al[14] used an unusual method by which to reduce the number of macroparticles making their way to the substrates. In their experiments they used a rotating cathode arrangement, Fig 3.7, which allowed the velocity of rotation to be varied. They observed that changing the velocity from Orpm to 4200rpm led to a reduction in macroparticles from 503xl02 to 5x10² per mm2. The effect of varying velocity on the number of macroparticles, of different sizes, can be seen in Fig 3.8. Kang et al explained the effect as being due to centrifugal forces. As the droplets are ejected from the cathode they travel towards the wall of the chamber at a velocity dependent upon the rotational velocity of the cathode. Hence only the macroparticles are affected as the thermal velocity of the metallic ions is much greater than that of the induced tangential velocity.
Cooling wafer
Outlet
Oil seal
Brush
L—— 3*
Pulley ---- ^
■Magnetic fluid
seal
Chamber
0-ring
BN-ring
[image:55.620.95.448.316.708.2]100000
10000
CL
1000 >0.1 micron
1-2 micron 2-3 micron >3 micron
100
_Q
1000 2000 3000 4000 5000
Rotational velocity(rpm)
Fig 3.8, Plot of number of macroparticles versus rotational velocity, after[14]
• Shutter system
The simplest and cheapest way to reduce the number of macroparticles present in the coating is to introduce a shutter, Of shield, directly into the plasma stream[15]. If the shield is negatively biased it will attract the positively charged ions from the plasma, but this technique also leads to a drastic reduction in the deposition rate.
• Plasma Ducts
To
pump
Fig 3.9, Sketch of a quarter torus plasma duct, afterfl6}
Several methods have been studied to improve the efficiency of the duct, with limited success. The methods tried are:
• Optimising the duct potential! 16], illustrated in Fig 3.9 • Changing the shape of the duct {17, 24, 26, 27]
• Focusing the plasma before entering the duct [28]
REFERENCES
[1] S Anders, A Anders, K M Yu, X Y Yao, I G Brown Proceedings of ISDE1V 1992, Darmstadt. Germany. Published by I.E.E.E 1992
[2] J E Daalder
Journal Of Physics D: Applied Physics 9 (1976) 2379
|3] C N Tai, E S Koh
Surface and Coatings Technology 43/44 (1990) 324
[4] A W Baouchi, A J Perry
Surface and Coatings Technology 49 (1991) 253
15] W D Munz, 1 J Smith, D B Lewis, S Creasey Vacuum 48(5) (1997) 473
[6] R L Boxman, S Goldsmith
Surface and Coatings Technology 51 (1992) 39
m S Shalev, R L Boxman, S Goldsmith
Journal of Applied Physics 58(7) (1985) 2503
18] J E Daalder
Journal of Physics D: Applied Physics 9 (1976) 2379
[8] K Akari, H Tamagaki, T Kumakiri, E S Koh, C N Tai Surface and Coatings Technology 43/44 (1990) 312
f9] I I Aksenov
[10] K Akari, H Tamagaki, T Kumakiri, E S Koh, C N Tai Surface and Coatings Technology 43/44 (1990) 312
[11] S Anders, A Anders, K M Y u, XYYao, IG Brown IEEE Transactions on Plasma Science 21(5) (1993) 440
[12] PD Swift
Journal of Physics D: Applied Physics 29 (1996) 2025
[13] J Vyskocil, J Musil
Journal of Vacuum Science and Technology A: 10(4) (1992) 1740
[ 14j G H Kang, HUchida, E S Koh
Surface and Coatings Technology 68 (1994) 141
[15] H Brandoff
US Patent No, 4,511,593 (1985)
[16] II Aksenov, V A Belous, V G Padalka, V M Khoroshikh Soviet Journal on Plasma Physics 4(4) (1978) 425
[17] J S Storer, J E Galvin, I G Brown
Journal of Applied Physics 66(11) (1988) 5245
[18] P J Martin, R P Netterfield, T J Kinder Thin Solid Films 193/194 (1990) 77
[19] A Anders, S Anders, I G Brown
Journal of Applied Physics 75(10) (1994) 4900
[20[ V N Zhitomirsky, R L Boxman, S Goldsmith
[21] T Witke, P Siemroth
IEEE Transactions on Plasma Science 27(4)(1999) 1039
[22] D R McKenzie, Y Yin, E G Gerstner, M M M Bilek IEEE transactions on Plasma Science 25(4)(1997) 652
[23] Y Yin, D R McKenzie
Journal of Vacuum Science and Technology A: I4(6)(1996) 3059
[24] P J Martin, A Bendavid, H Takikawa
Journal of Vacuum Science and Technology A: 17(4)(1999) 2351
[25] 11 .Aksenov, V A Belous, V G Padalka, V M Khiroshikh Instrumentation and Experimental Technology 5 (1978) 236
[26] S Anders
Proceedings ISDEIV 1996 ^Berkeley, California - Vol 2, pg 904 Published by I.E.E.E
[27[ I I Aksenov, V M Khoroshikh, N S Lomino, V D Ovacharenko IEEE transactions on Plasma Science 27(4)(1999) 1026
[28[ S Anders, A Anders, I G Brown
4.0 EXPERIMENTAL SET UP
This chapter describes the experimental arrangement used in the work for this thesis, and the changes required in order to investigate the parameters of interest. The chapter can be divided into three parts:
* Development o f electromagnetic control o f the arc
This section describes the progress of magnetic/electromagnetic steering systems used for controlling the motion of the arc.
• Development o f new hardware fo r the vacuum rig
This section deals with the design of new hardware for the vacuum apparatus to enable experiments to be performed. The reasons for altering the system are discussed along with the solutions which were used.
® Experimental apparatus used
4.1
Development of Electromagnetic Control of the Arc
This section covers the development of electromagnetic control of the vacuum arc. This development began by using permanent magnets situated behind the cathode[l], and progressed further as electromagnets were used[2,3j. The use of electromagnets heralded a new era for arc control as now magnetic fields of various magnitudes and geometries could be generated.
4.1.1 CONTROL OF THE ARC
Following on from the work of Ramalinghamfl jfsee chapter 1), a range of authors developed electromagnetic arc steering systems. Swift et al[2] developed a control system consisting of a single electromagnetic coil situated at the rear of the cathode, Fig 4.1. Using such an arrangement it is possible to vary the magnitude of the normal and transverse elements of the magnetic field, but not the position at which BN=0, i.e. the orbital radius. In order to alter the orbital radius the coil would have to be moved away from the rear of the cathode, meaning that if the same field values were to be maintained then a large increase in coil current would be required. Flence such a system is said to have only one degree of freedom.
Position / mm
Figure 4.1, sketch of the electromagnets from Swift[2]
From their experiments Swift et al found that the arc tended to follow the path at which BN was equal to zero. They hypothesised that the arc maintained this path due to a restoring
force, F, which was generated by the action of the magnetic field, B, acting upon a positive space charge, +q, which is carrying a current density, j. The existence of this positive space charge is consistent with models produced by Plyutto[4|and Davis and Miller [5] (see chapter 2). From the experimental work performed Swift et al noted that, as in many such cases, the arc moved in the retrograde direction. An empirical description is then,
v ~ - J A B (EQ 4.1)
leading to an expression for the restoring force
F ~ q[va B]
~
q[B a ( m j a B)\ (EQ 4.2)which, using the vector identity a A (bA c ) = (a.c)b -
(
b.c)a, givesF ~ q |B |2y - ( 5 - j ) g (EQ 4.3)
The first term in the above expression represents a force towards the cathode: the second term represents a restoring force; close to the path BNf=0 this takes the form of B ^B r. This acts along BT if BN is negative and opposed to BT if BN is positive.
Swift at al also noted that as the arc traversed around its orbit there was also some small deviation from the path at which the normal component of the magnetic field, BN, was zero. They noted that such deviations grew smaller as the normal field strength increases.
Walke et al[3] considered this further and noted that at small deviations from the BN=0 path then Bn can be approximated to the normal field gradient, BN * multiplied by the distance, x, of the arc from the path at which BN=0, i.e.
B n ~ xBn’
Hence it may be expected that the magnitude of the force restoring the cathode spot to the
Bn =0 position will increase more rapidly for larger normal field gradients.
4.1.2 THE TWO COIL STEERING ARRAY
As mentioned in the previous section the single coil steering array has limitations, it is only possible to alter the orbital radius of the arc by moving the coil away from the rear of the cathode. Following repositioning of the magnet a substantial increase in the coil current would be required to maintain the same level of magnetic field. A two coil magnetic steering system, used by Walke et al - Fig 4.2, gives better control as now the two magnetic fields generated by the electromagnets can be combined to change the overall geometry of the field.
When the fields of the two coils are superimposed it is possible, through the choice of the correct current ratio, to alter the orbital radius of the arc as well as one of either BN! or BT.
The reason for the development of the two coil steering array was twofold:
• To improve the efficiency of cathode usage by varying the orbital radius. * To test the model of arc motion of Care|6J.
50
30
29
99
m
Fig 4.2, Diagram of the two coil magnetic steering array by Walke[3]
4.1.3 THE THREE COIL STEERING ARRAY
Using the steering system of Walke[3] it was impossible to hilly test the model by Care[6], since he could not produce the degree of freedom required (EQ 4.6 and Appendix A). This being the case a new method of controlling the arc was required, this new system being a three coil steering array. The reason for the transition to three coils is explained in the following.
For a two coil arrangement it can be seen that
BT{total) = BT(co il\) + Br (coil2) = K ^ I m + 4 2)/ <2) (EQ 4.4)
B (total)
=
B ( c o i l ] )+
BN(coil2
)
= (EQ 4.5)where
) - Function of radi us dependent on BN of coil x K j - Function of radius dependent on B r of coil x I (x) - Current flowing through coil x
From EQ 4.4 and 4.5 it can be shown(see Appendix A) that if a particular orbital radius is set then
B'v o cIm and Br ocI m
hence BN <x B, , (EQ 4.6)
meaning that BN’ and Br cannot be independently controlled.
However for a three coil system there are now three variables, T1), I<2>, P). Again it is possible to obtain equations for the normal and transverse elements of the magnetic field
B T (total) = 5™ + B<2) + 4 3) = § V 'x)/ (Ar) (EQ 4.7)
B
n(tot
al)
=4 »
+2#»
+Bi
f>
=f
(EQ 4.8)X =1
From these two equations it is possible (see Appendix A) to obtain two simultaneous equations for BNand Br.
Bt
= a (r21)/ <2) + a (r31)/ (3) (EQ 4.9)Bn
= a ^ 21)/ (2> + a ^ 31)7 (3> (EQ 4.10) where the a are functions of radius dependent upon the values of KN and KT for the threecoils.
As can be seen from the above equations BT and BN' are now no longer linked, meaning that with a three coil steering array it is possible to control BN' and Br independently for a given radius,
i.e. there are three degrees of freedom. The extent of independent control of the three parameters depends on how different are the geometries of the three electromagnets.
4.2 Development of New Hardware for the Vacuum Rig
4.2.1 THE THREE COIL STEERING ARRAY
The following section is devoted to describing the design, construction and testing of the novel three coil electromagnetic steering array.
Modelling of the maenetic coils
To enable the design of a series of electromagnets to be designed a method to assess their performance was required. Walke et al|3] investigated various methods to predict the field profiles of an electromagnet and found that a Biot-Savart approach, describing the field produced by current carrying loops, proved satisfactory. This method was then converted to a computer program enabling the modelling of the three coils to be performed simultaneously.
Options for coil configurations
As has been mentioned earlier, to produce the degree of freedom required we need a three coil steering system in which the coils have different field geometries. After careful consideration three such configurations were examined using the Biot-Savart program described above, see fig 4.4.
Using the program it was possible to generate both the normal and transverse field
![Fig 2.4(b), Plot of arc velocity as a function of arc current, after [31]](https://thumb-us.123doks.com/thumbv2/123dok_us/778272.583868/29.618.94.478.34.555/fig-b-plot-arc-velocity-function-arc-current.webp)
![Fig 2.7,Plot of arc velocity as a function of number of arcs, after [20,35]](https://thumb-us.123doks.com/thumbv2/123dok_us/778272.583868/31.617.83.481.456.719/fig-plot-arc-velocity-function-number-arcs.webp)
![Fig 3.5, Partial pressure versus Number of macroparticles counted, after [4]](https://thumb-us.123doks.com/thumbv2/123dok_us/778272.583868/53.620.97.490.261.538/fig-partial-pressure-versus-number-macroparticles-counted.webp)
![Fig 3.6, Bias voltage versus number of macroparticles collected, after[3]](https://thumb-us.123doks.com/thumbv2/123dok_us/778272.583868/54.620.84.447.426.674/fig-bias-voltage-versus-number-macroparticles-collected.webp)
![Fig 3.7, Sketch of the rotating cathode arrangement, after[14]](https://thumb-us.123doks.com/thumbv2/123dok_us/778272.583868/55.620.95.448.316.708/fig-sketch-rotating-cathode-arrangement.webp)

