ASSESSING THE EFFECTS OF AGING ON PULMONARY FUNCTION
TESTS IN ELDERLY POPULATION OF JAMMU
1
Roop Krishan Ji Dhar*, 2Suman Bala and 3Sunil Sachdev
1
M.B.B.S, D.C.P, M.D, Medical Officer Jammu & Kashmir Health Services.
2
M.B.B.S, M.D, Medical Officer Jammu & Kashmir Health Services.
3
M.B.B.S, D.T.C.D, M.D, Professor & Head, Postgraduate Department of Physiology, Govt.
Medical College, Jammu.
ABSTRACT
Objective: The objective of the present study was to assess the effects of aging on lung function tests in elderly population aged 60 years and
above. Methods: The present study was carried out among 185 subjects from Old people homes and different geriatric organisations.
Clinical examination of chest was performed that includes Pulmonary
Function Tests with the help of Medspiror. The subjects with medical
complications were excluded. A p-value of <0.01 was considered
statistically highly significant, p value < 0.05 was considered
statistically significant and that > 0.05 was considered statistically non
significant. Results: The study showed progressive decline in mean values of FVC, FEV0.5,
FEV1, FEV3 and PEFR with age in both males and females. Further FEV.5/FVC%,
FEV1/FVC% and FEV3/FVC% changed insignificantly in both males and females.
Conclusion: The study reported significant decline in most of the parameters of Pulmonary Function Tests with increasing age.
KEYWORDS: Pulmonary Function Tests; physiological alterations; geriatric population
INTRODUCTION
The number of older persons in the population is projected to increase by more than double
from 71 million in 2001 to 173 million in 2026 - an increase in their share to the total
population from 6.9 to 12.4 percent.[1, 2]
Volume 5, Issue 11, 1345-1354. Research Article ISSN 2277– 7105
*Corresponding Author
Dr. Roop Krishan Ji Dhar
M.B.B.S, D.C.P, M.D, Medical Officer Jammu & Kashmir Health Services. Article Received on 17 Sept. 2016,
Several studies have demonstrated that age related functional changes in the respiratory
system result from three physiological events; progressive decrease in compliance of the
chest wall, decrease in strength of respiratory muscles and decrease in elastic recoil of the
lung. [3] With aging there are structural changes to the thoracic cage causing reduction in
chest wall compliance.[4]
Maximum Inspiratory Pressure (MIP) is an index of strength of the diaphragm measured
using a mechanical pressure gauge with a closed valve at the mouth during an inspiration.
Decline in MIP can lead to inadequate ventilation and impaired clearance of airway
secretions.[5]
During the course of aging, alveolar ducts in humans increase in diameter and alveoli become
wider and shallower. There is homogeneous degeneration of the elastic fibers around the
alveolar duct starting around 50 years of age resulting in enlargement of airspaces. Reduction
in supporting tissue results in premature closure of small airways during normal breathing
and can potentially cause air trapping and hyperinflation, hence “senile emphysema”. [6,7]
The ciliary escalator is an important part of the mechanical non –specific immune defences.
The frequency at which cilia beat decreases with age, slowdowns the ciliary escalator. There
is also a gradual reduction in the number of cilia.[8]
Simple ventilatory function tests have proved useful in establishing the diagnosis, prognosis
and in guiding therapy.[9,10] The knowledge of pulmonary function tests is a basic requirement
to understand the respiratory physiology for all medical physiologist and clinicians. Many
studies related to pulmonary function tests have been conducted mainly in the developing
countries. This type of research in electronic media failed to disclose any studies in the
elderly Indian population. Therefore, the present study aimed to assess Pulmonary Function
Tests for elderly population of Jammu.
MATERIALS AND METHODS
The present study was carried out among subjects from Old people homes and different
geriatric organisations located in Jammu city and surrounding area. Before conducting the
study an official permission was obtained from the ethical committee. A list of Old people
administration running these homes and organisations. The aim of the study was elaborated
and the requested participants gave a written consent.
There were around 366 subjects in different centers. The healthy subjects without smoking
habit aged 60 years and above were enrolled and those with clinical abnormalities of high
blood pressure, bronchial asthma, diabetes mellitus, bronchiectesis, tuberculosis and
emphysema were excluded.
A total of 185 subjects were finalized and were categorized into four Groups i.e. Group I
included subjects from age (60 to 64), Group II from (65 to 69) years, Group III (70 to 74)
and Group IV included those who were 75 yrs and above. Each group was further divided
according to gender.
The lung functions were performed in the Department of Physiology, Government Medical
College, Jammu and at Old people homes. All the study subjects were interviewed by the
investigator himself and details of information like age and any significant recent or past
illness was recorded.
General physical examination and clinical examination of chest were performed that includes
Pulmonary Function Tests as mentioned in Table 1.[11]
STATISTICAL ANALYSIS
The statistical difference in mean values was tested using ANOVA (analysis of variance) to
evaluate statistical significance. A p-value of <0.01 was considered statistically highly
significant, p value < 0.05 was considered statistically significant and that > 0.05 was
considered statistically non significant.
RESULTS
In the present study it was depicted that progressive decline in the mean values of Forced
vital capacity (FVC), Forced expiratory volume (FEV0.5), Forced expiratory volume (FEV1)
and Forced expiratory volume (FEV3) among elderly male & female subjects divided in half
decade age groups. The difference in the mean values was statistically highly significant (p
value <0.0001) as shown in Table 2
Table 3 depicts progressive decline in the mean values of Peak expiratory flow rate (PEFR),
expiratory flow rate from 0.2 to 1.2 liters of volume change (FEF0.2 - 1.2) among elderly male
and female subjects.
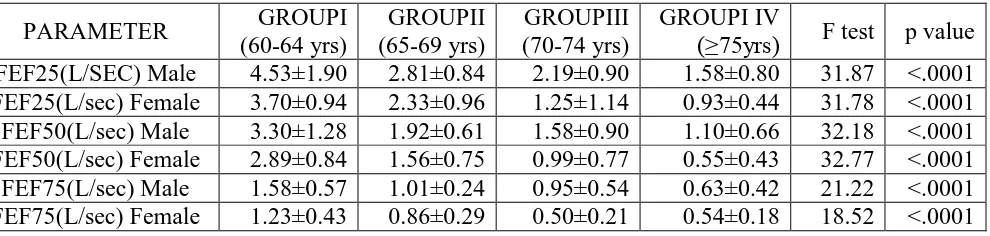
In this Table 4, the mean values of Forced expiratory flow of 25% (FEF25%), 50% (FEF50%)
and 75% (FEF75%) among elderly subjects divided in half decade age groups. The difference
in the mean values was statistically highly significant (p value <0.0001).
Table 5 represents mean values of FEV0.5/FVC% among male subjects divided in half decade
age groups. The mean values of group I & group II were almost same & mean values of
group III & group IV were almost same. In female participants, Group I to Group III, the
values were decreasing; however Group IV has the value more than Group III. The mean
value of FEV1/FVC% and FEV3/FVC(%) showed non significant results in relation to
different age groups.
The mean values of Maximum voluntary ventilation (MVV) was observed significantly
among elderly population (p value <0.0001). Further it was also noticed that almost similar
mean values of Extrapolated time among male & female subjects (p value>0.05) as illustrated
in Table 6.
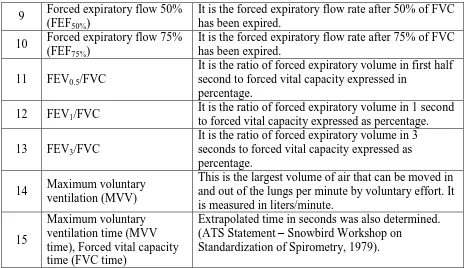
Table 1: Pulmonary function parameters calculated with the help of Medspiror. 1 Forced vital capacity (FVC) It is maximum amount of air exhaled forcibly and
rapidly after forceful inspiration.
2 Forced expiratory volume (FEV0.5)
It is the volume of air which is expelled from the lungs in the first half second of forced expiration.
3 Forced expiratory volume (FEV1)
It is the volume of air which is expelled from the lungs in first second of FVC.
4 Forced expiratory volume (FEV3):
It is the volume of air which is expelled from the lungs in first 3 seconds of FVC.
5 Peak expiratory flow rate (PEFR)
It is the maximum expiratory flow rate sustained by a subject for at least 10millisecond and is expressed in liters/second.
6
Mean forced expiratory flow rate from 0.2 to 1.2 liters of volume change (FEF0.2 - 1.2):
It is the average flow for the expiration of 1 liter of gas starting 200 ml after the beginning of a forced expiration.
7
Mean forced expiratory flow during the middle half of FVC
(FEF25-75%)
It is the mean rate of flow of air in the mid-expiratory phase.
8 Forced expiratory flow 25% (FEF25%)
9 Forced expiratory flow 50% (FEF50%)
It is the forced expiratory flow rate after 50% of FVC has been expired.
10 Forced expiratory flow 75% (FEF75%)
It is the forced expiratory flow rate after 75% of FVC has been expired.
11 FEV0.5/FVC
It is the ratio of forced expiratory volume in first half second to forced vital capacity expressed in
percentage.
12 FEV1/FVC
It is the ratio of forced expiratory volume in 1 second to forced vital capacity expressed as percentage.
13 FEV3/FVC
It is the ratio of forced expiratory volume in 3 seconds to forced vital capacity expressed as percentage.
14 Maximum voluntary
ventilation (MVV)
This is the largest volume of air that can be moved in and out of the lungs per minute by voluntary effort. It is measured in liters/minute.
15
Maximum voluntary ventilation time (MVV time), Forced vital capacity time (FVC time)
Extrapolated time in seconds was also determined. (ATS Statement – Snowbird Workshop on
Standardization of Spirometry, 1979).
Table 2: Overall comparison of FVC, FEV0.5, FEV1 and FEV3 (L) among elderly
subjects
PARAMETER GROUPI
(60-64 yrs) GROUPII (65-69 yrs) GROUPIII (70-74 yrs) GROUPIV
(≥75yrs) F test p value
FVC(L) Male 2.89±0.58 2.22±-0.61 1.88±0.44 1.55±0.37 39.68 <.0001
FVC(L) Female 2.00±0.37 1.58±0.32 1.25±0.48 0.81±0.23 42.47 <.0001
FEV 0.5(L) Male 1.35±0.65 1.08±0.38 0.67±0.34 0.58±0.29 18.77 <.0001
FEV0.5(L) Female 1.16±0.42 0.79±0.28 0.43±0.12 0.44±0.18 20.98 <.0001
FEV1(L) Male 2.06±0.56 1.73±0.52 1.15±0.47 1.01±0.39 30.07 <.0001
FEV1(L) Female 1.58±0.42 1.17±0.39 0.74±0.18 0.60±0.32 26.13 <.0001
FEV3(L) Male 2.77±0.39 2.21±0.60 1.85±0.43 1.46±0.37 48.16 <.0001
[image:5.595.65.532.70.338.2]FEV3(L) Female 1.93±0.45 1.56±0.30 1.09±0.21 0.82±0.23 31.79 <.0001
Table 3: Overall comparison of PEFR, FEF25-75%, and FEF 0.2-1.2 (L/sec) among elderly
subjects
PARAMETER GROUPI
(60-64 yrs) GROUPII (65-69 yrs) GROUPIII (70-74 yrs) GROUPI IV
(≥75yrs) F test p value
PEFR(L/sec) Male 5.18±1.80 3.42±1.21 2.51±1.02 1.91±0.85 37.23 <.0001
PEFR(L/sec) Female 4.23±1.09 2.65±1.01 1.45±0.90 1.14±0.44 37.72 <.0001
FEF25-75(L/sec) Male 2.75±0.96 1.80±0.51 1.31±0.52 1.05±0.59 36.11 <.0001
FEF25-75(L/sec) Female 2.25±0.69 1.41±0.52 0.79±0.38 0.71±0.31 30.62 <.0001
FEF0.2-1.2(L/SEC) Male 3.86±1.44 2.15±0.79 1.43±0.83 1.11±0.82 43.98 <.0001
Table 4: Overall comparison of FEF25% , FEF50% and FEF75% (L/sec) among elderly
subjects
PARAMETER GROUPI
(60-64 yrs) GROUPII (65-69 yrs) GROUPIII (70-74 yrs) GROUPI IV
(≥75yrs) F test p value
FEF25(L/SEC) Male 4.53±1.90 2.81±0.84 2.19±0.90 1.58±0.80 31.87 <.0001
FEF25(L/sec) Female 3.70±0.94 2.33±0.96 1.25±1.14 0.93±0.44 31.78 <.0001
FEF50(L/sec) Male 3.30±1.28 1.92±0.61 1.58±0.90 1.10±0.66 32.18 <.0001
FEF50(L/sec) Female 2.89±0.84 1.56±0.75 0.99±0.77 0.55±0.43 32.77 <.0001
FEF75(L/sec) Male 1.58±0.57 1.01±0.24 0.95±0.54 0.63±0.42 21.22 <.0001
FEF75(L/sec) Female 1.23±0.43 0.86±0.29 0.50±0.21 0.54±0.18 18.52 <.0001
Table 5: Overall comparison of FEV0.5/FVC, FEV1/FVC and FEV3/FVC (%) among
elderly subjects
PARAMETER GROUPI
(60-64 yrs) GROUPII (65-69 yrs) GROUPIII (70-74 yrs) GROUPI IV
(≥75yrs) F test p value
FEV0.5/FVC(%) Male 47.30±23.19 48.89±11.35 37.36±18.07 38.04±17.43 2.93 <.05
FEV0.5/FVC(%) Female 59.41±18.87 52.33±19.69 47.40±12.15 51.95±20.25 3.26 >.05
FEV1/FVC(%) Male 78.14±20.15 76.50±9.52 64.95±20.96 61.76±20.39 2.43 >.05
FEV1/FVC (%) Female 79.92±15.85 76.19±19.34 71.96±17.42 72.70±22.21 1.35 >.05
FEV3/FVC(%) Male 97.09±8.66 99.63±0.86 98.80±2.33 94.49±12.45 2.64 >.05
FEV3/FVC(%) Female 98.54±1.64 99.52±1.31 93.69±18.77 97.84±7.38 1.34 >.05
Table 6: Overall comparison of MVV (L/min) and of EXT.TIME (sec) among elderly subjects
PARAMETER GROUPI
(60-64 yrs) GROUPII (65-69 yrs) GROUPIII (70-74 yrs) GROUPIV
(≥75yrs) F test p value
MVV(L/MIN) Male 71.45±26.65 48.76±14.49 41.27±14.66 24.15±5.34 37.19 <.0001
MVV(L/min) Female 52.72±19.15 23.66±12.79 21.60±6.30 18.97±4.21 21.59 <.0001
EXT.TIME(sec) Male 0.10±0.08 0.08±0.05 0.10±0.07 0.11±0.07 0.90 >0.05
EXT.TIME(SEC) Female 0.08±0.05 0.10±0.07 0.10±0.03 0.10±0.07 0.63 >0.05
DISCUSSION
In the present study, there was progressive decline in mean values of FVC from Group I
(60-64 yrs) to Group IV (≥75yrs) in both males and females and the difference was statistically
highly significant (p value<0.0001). These findings were comparable to the previous studies
showing decline in the mean value of FVC with aging.[10,12,13] However the results were in
disagreement with a study conducted by Woo and Pang (1988) who reported that there was
no age related decline in FVC in aged men 60 years and above.[14] Further, it was seen a
progressive decline in the mean value of FEV0.5 in study subjects with age and the findings
were familiar to the observations of Singh et al (1970).[15] But Kory et al showed highest
[image:6.595.58.553.112.230.2]Forced expiratory volume in one second (FEV1) showed a significant decline in mean values
of from Group I to Group IV. Similar observations were reported by Mannino and Davis
(2006) who also reported continuous diminution in FEV1 values when separated in age
groups by half decade.[17] Whereas Griffith et al reported that healthy men do lose lung
function at a faster rate when compared with healthy women which was in disagreement with
present study.[18] The mean values of FEV3 reduced with age in both males and females and
the difference was statistically highly significant. But no report has been sighted in the
literature regarding the effect of aging on this parameter.
Peak expiratory flow rate (PEFR) is a method of assessing the ventilatory capacity with
single breath.[19] In the present study, overall comparison of PEFR among subjects showed
progressive decline in the mean value of PEFR with increasing age. The current data was in
agreement with those reported by Ruivo et al (2009) who showed linear relationship between
age and mean value of PEFR.[20] Boezen et al (1994) also reported that absolute PEFR values
are lower in older age groups than in younger ones independent of height and smoking
habits.[21]
Expiratory flow rates are being used increasingly to assess the lung function in early
diagnosis of airway obstruction especially when peripheral airways are involved. In this
study, mean value of expiratory flow rates showed significant decline with age. These
findings were in agreement with that reported by Phatak et al (2002), Wu and Yang (1990)
and Stinson et al (1981).[10,22,23] These measurements of expiratory volume are additional
parameters for obtaining information on ventilatory functions and are recorded in tune with
baseline parameters.
The FEV0.5/FVC (%), FEV1/FVC (%), FEV3/FVC (%) ratio is almost similar between male
and female groups. Similar observations were reported by Phatak et al (2002) who mentioned
continuous decline in mean in all four groups.[10] However, the present data is in
disagreement with that reported by Burr et al (1985) who observed that mean values remain
fairly constant in the elderly population.[13]
MVV (L/min) is the largest volume of air that can be moved into and out of the lungs in one
minute by voluntary effort. It is a dynamic test of lung function and it was first introduced by
Hermannsen (1933).[24] In the present study, it was seen that there was progressive turn down
by Ruivo et al (2009) who showed linear relationship between age and mean value of
MVV.[20]
The present study had limitations as follow-up examination of the participants was not done
for more precise results. Other limitations of this study include participants from old age
homes and other old age organization and the comparison has been done with the aged people
living with their families. Along with that the exercise status of the subjects was not included.
CONCLUSION
The present study indicates that age showed strongest negative correlation with pulmonary
functions, as aging process is associated with a reduction in the total diaphragmatic and
respiratory accessory muscle mass as well as with decline in the work output for the same
level of neural stimulation. However the results were approximately significant according to
gender. These physiological adaptations may contribute to age related decline in FVC,
FEV0.5, FEV1, FEV3 and PEFR.
REFERENCES
1. Cohen JE, Martin M. International Perspectives on the Goals of Universal Basic and
Secondary Education. Routledge, New York, London. 2009, Isbn: 978-0-415-99766-9.
2. Maitraya B. Geriatrics: Its importance and its present status in India. Ind J of Gerontology
2006; 20(4): 359-368.
3. Janssens JP. Aging of the Respiratory system: Impact on Pulmonary Function Tests and
adaptation to Exertion. Clin Chest Med 2005; 26: 469-484.
4. Sharma G and Goodwin J. Effect of aging on respiratory system physiology and
immunology. Clin Interv Aging 2006; 1(3): 253-60.
5. Enright PL, McClelland RL, Buist AS, Lebowitz MD. Correlates of Peak Expiratory
Flow Lability in Elderly Persons. Chest 2001; 120: 1861-1868.
6. Yáñez A, Cho SH, Soriano JB. Asthma in the elderly: what we know and what we have
yet to know. World Allergy Organization Journal 2014; 7:8.
7. Ranu H, Wilde M, Madden B. Pulmonary Function Tests. The Ulster Medical Journal
2011; 80(2): 84-90.
8. Hogg JC, McDonough JE, Suzuki M. Small Airway Obstruction in COPD: New Insights
9. Baldi F, Fuso L, Arrighi E, Valente S. Optimal management of pulmonary arterial
hypertension: prognostic indicators to determine treatment course. Therapeutics and
Clinical Risk Management 2014; 10: 825-839.
10.Phatak MS, Kurhade GA, Pradhan GC, Gosavi GB. An epidemiological study of
Pulmonary Function Tests in Geriatic population of central India. Indian J Physiol and
Pharmacol 2002; 46(1): 85-91.
11.Solanki S, Choudhary R, Choudhary K, Mirdha P, Kumar R. Study of Pulmonary
Function Test in different age groups of healthy people in Western Rajasthan. Sch J App
Med Sci 2015; 3(5A):1871-1875.
12.Memon MA, Sancdila MP and Ahmed ST. Pulmonary Function test in a cohort of older
Pakistani Population. Pak J Physiol 2006; 2(1): 34-37.
13.Burr ML, Phillips KM, Hurst DM. Lung function in the elderly. Thorax 1985; 40: 54-59.
14.Woo J and Pang J. Spirometry in healthy elderly Chinese. Thorax 1988; 43: 617-620.
15.Singh HD, Abraham DL, Antony NJ. Expiratory Flow Rates and Timed Expiratory
Capacities in South Indian Men. Journal of the Indian Med Association 1970: 412-416.
16.Kory RC, Callahan R, Boren HG, Syner JC. Clinincal Spirometry in Normal Men. The
American Journal of Medicine 1961; 30(2): 243–258.
17.Mannino DM and Davis KJ. Lung function decline and outcomes in an elderly
population. Thorax 2006; 61(6): 472-477.
18.Griffith KA, Sherrill DL, Siegel EM, Manolio TA, Bonekat HW, Enright PL. Predictors
of Loss of Lung Function in the Elderly. Am J Respir Crit Care Med 2001; 163: 61-68.
19.Dhungel KU, Parthasarathy D, Dipali S. Peak expiratory flow rate of Nepalese children
and young adults. Kathmandu University Medical Journal 2008; 6(3): 346-354.
20.Ruivo S, Viana P, Martins C, Baeta C. Effects of aging on lung function. A comparison
of lung function in healthy adults and the elderly. Rev Port Pneumol 2009; 15(4): 629-53.
21.Boezen HM, Schouten JP, Postma DS, Rijcken B. Distribution of peak expiratory flow
variability by age, gender, and smoking habits in a random population sample aged 20-70
yrs. Eur Respir J 1994; 7: 1814-1820.
22.Wu HD and Yang SC. Maximal expiratory flow and volume in Chinese aged 60 years
and over. J Formos Med Assoc 1990; 89(9): 749-755.
23.Stinson JM, Mcpherson GL, Hicks K, Scott V, Sykes R. Spirometric Standards for
24.Sahu R, Kumar P. Maximum voluntary ventilation in smokers and non-smokers – a
comparison. International journal of behavioral social and movement sciences 2013; 2(1):