215
An Analysis of Backward Linkages in the Irish
Electronics Sector*
HOLGER GÖRG
University of Nottingham and
FRANCES RUANE Trinity College Dublin
Abstract:This paper analyses the development and the determinants of backward linkages between electronics firms and domestic sub-suppliers in Ireland using data for 1982 to 1995. We find that, even when controlling for other firm and sector specific factors, foreign firms have lower linkages than Irish firms. Our results also suggest both foreign and indigenous firms have increased their material linkages over time, which points to the success of Ireland’s industrial policy of developing electronics clusters. Furthermore, we find that there are differences in the determinants of linkages between foreign and indigenous firms, and that these differ as between service and material linkages.
I INTRODUCTION
T
he significance of foreign multinational companies (MNCs) to the Irish manufacturing sector is well recognised and evident in their 48 per centshare of employment, 79 per cent share of net output and 85 per cent share of manufacturing exports in 1997.1 A natural question of interest to economic policy
makers and those interested in structural adjustment in the industrial sector is whether these multinationals are integrated into the Irish economy, or whether they operate in so-called “enclave sectors” with virtually no links to the domestic economy. This issue is important in terms of indicating the commitment of the companies to Ireland and the extent of their possible contribution to its development. Does the exceptionally strong presence of MNCs benefit indigenous manufacturing companies or does it damage them? What benefits are there for indigenous companies in the service sector?2
A key indicator of the degree of integration is the extent to which there are forward and backward linkages between MNCs and the local economy, through customer and supplier relationships with indigenous firms. Where backward linkages occur with firms whose output is not internationally traded, as is the case for many services, the presence of MNCs can raise domestic welfare by generating net additional output in services for the economy, assuming that there is spare capacity.3 Where backward linkages occur with firms whose
products are traded, there may also be positive net welfare effects, if the firms enjoy economies of scale and their output expands beyond what it would do in the absence of the MNCs.4 Furthermore, as Driffield and Mohd Noor (2000)
point out, linkages provide evidence that multinationals have incurred sunk costs in the economy and are therefore less likely to leave the host country in response to short-term shocks.
The aim of this paper is to analyse the extent and the determinants of backward linkages between firms in the Irish electronics sector, using econometric analysis of panel data. Since a key focus of Irish industrial policy over the past twenty years has been the promotion of MNC investment in the electronics sector, we are interested in determining how these linkages have developed and whether there are differences between indigenous and foreign-owned firms in their respective input-sourcing behaviour. We define total linkages as the percentage of total services, raw materials, and intermediate good inputs purchased in Ireland. Because of differences in the degree of tradability, we
1. Figures are derived from the Census of Industrial Production, 1997. The importance of multinational companies for the Irish economy is discussed in, for example, Görg and Strobl (1999), Barry and Bradley (1997), Barry et al. (1999) and Ruane and Görg (1996, 1997).
2. Barry and Hannan (1995) have identified an important potential cost of such multinationals in terms of their potential “Dutch Disease” impact on crowding out indigenous firms.
3. There can also be macro-type effects, but we are concerned here with those effects which occur directly through sub-supply.
decompose total linkages into service linkages (essentially non-tradables) and material (raw materials and intermediate inputs) linkages.5
Our study contrasts with earlier econometric studies of backward linkages in Ireland, which are discussed further in Section II, in two main respects. First, while earlier studies use cross sectional data related to the mid-late 1970s, we cover a more recent period, viz., 1982 to 1995, using panel data which enable us to follow the development of linkages in individual firms over time. Second, our analysis of linkages is concerned solely with the electronics sector. This sector has been the fastest growing sector in the Irish economy over the past two decades, and, as Crowley (1996) argues, it has been perceived by policy makers as offering the highest potential for the development of material linkages in the Irish manufacturing sector. As such, it has been targeted specifically by the Industrial Development Authority (IDA Ireland) in seeking to attract MNCs into Ireland (Görg and Ruane, 2000; White, 2000). As many of these inter-firm material linkages are likely to be within the electronics sector, the strategy adopted was to attract MNCs across the fullest possible range of electronics sub-sectors, with a view to establishing networks of interconnected firms in this sector. The outcome of this diversified strategy is evident in Figure 1 in Section III below.
The remainder of the paper is structured as follows. We briefly review previous studies of inter-firm linkages in Ireland in Section II; this literature finds its origins in the work of Hirschman (1958). In Section III we describe the data set used for the empirical analysis, while in Section IV we present some descriptive statistics on the development of backward inter-firm linkages for a sample of firms in the Irish electronics sector between 1982 to 1995. In Section V we present an econometric model of the determinants of linkages and in Section VI we show the results of the empirical estimation. Finally, Section VII summarises our main results and draws some conclusions.
II INTER-FIRM LINKAGES IN IRELAND
The extent to which MNCs forge linkages with indigenous companies has been of long-standing interest to development economists. Interest in linkages dates back to the post-war debates on whether government interventions to support specific developments in the industrial sector would induce positive growth effects through additional forward and backward supply responses. A further issue associated with this discussion was whether or not governments
should attempt to influence directly the growth of such linkages.6 From a
neo-classical economics perspective, the justification for seeking such linkages was questioned (see, for example, Little, 1982) as, arguably, inter-firm linkages would not have any net welfare effect in an economy with perfectly competitive product and factor markets and perfect information, etc., in which firms face constant returns to scale (CRS). In such a scenario, firms produce their profit maximising outputs at zero profits in equilibrium and changes in the input-sourcing behaviour do not have any particularly positive effect on the performance of supplier firms and hence on welfare. However, in a typical developing country context, information is imperfect, labour markets are distorted,7 and product
markets are far from being perfectly competitive and subject to CRS. In such countries inter-firm linkages can have positive effects on the economy through the emergence of externalities, which result in the expansion of output of sub-supplier firms in response to the establishment of new manufacturing firms. In looking at the overall welfare effects of investments by MNCs in developing countries, the extent of inter-firm linkages which induce additional output is of particular significance.8
The issue of why and how inter-firm linkages might be important has attracted considerable attention recently from neo-classical economists, who have developed formal models to show the various positive effects of linkages arising from MNCs in the presence of imperfect competition and economies of scale.9
The importance of inter-firm linkages for geographical agglomerations (see Krugman and Venables, 1995, 1996 and Venables, 1994, 1996) and for technology spillovers (see Blomström and Kokko, 1998)10 from multinationals to indigenous
firms have also been noted. Inter-firm linkages can also be shown to have positive welfare effects through the creation of secondary (or indirect) employment generated in supplier firms, in a context where the labour market is not com-petitive and unemployment results (see Rodríguez-Clare, 1996).11
6. Hirschman (1958) was enormously influential in focusing the attention of policy makers in developing countries on the potential benefits of induced linkage effects through the promotion of new, export-orientated industries.
7. Typically such economies have “surplus labour” manifesting itself in structural unemployment and labour hoarding; see, for example, Lewis (1954).
8. Clearly it impacts on any cost-benefit evaluation of the impact of MNCs on the economy. 9. Markusen and Venables (1999) show that linkages between final good producing firms and domestic suppliers may have positive effects on the development of both domestic suppliers and final good producing firms. Görg and Strobl (1999), based on the Markusen-Venables model, provide evidence that foreign multinationals in Ireland have had positive effects on the entry of indigenous firms.
10. The issue of agglomerations and technology spillovers has been discussed in the Irish context by O’Donnellan (1994), Barry and Bradley (1997), and Kearns and Görg (2000).
There has been considerable interest shown by Irish researchers and policy makers in inter-firm linkages, particularly those associated with MNCs, over the past twenty-five years. In measuring the total impact of Ireland’s long-standing development policy aimed at attracting MNCs, it is essential to establish whether these MNCs directly generate additional new activity in Ireland. Inter-firm backward linkages in Ireland have been subject to empirical research by various authors, including Stewart (1976), O’Loughlin and O’Farrell (1980), O’Malley (1989, 1995), Kennedy (1991), and Crowley (1996). Our particular interest lies in the papers by McAleese and McDonald (1978) and O’Farrell and O’Loughlin (1980, 1981), which appear to be the only studies using econometric techniques to estimate the determinants of inter-firm backward linkages between Irish manufacturing firms and their domestic suppliers.12
McAleese and McDonald (1978) use data from a large survey of manufacturing firms in Ireland undertaken in 1974 (see McAleese, 1977) to estimate the determinants of backward linkages between manufacturing firms and indigenous suppliers. Their sample comprises a cross-section of 269 manufacturing firms that were in operation in 1974. O’Farrell and O’Loughlin (1980, 1981) carry out a similar analysis for 1976, selecting a sample of 360 firms from a list of 466 firms, which had been grant-aided by the IDA Ireland under the IDA New Industry grant programme.
These studies find, inter alia, that foreign firms tend to have lower linkages than indigenous firms, and that the extent of linkages is negatively related to the size of firms, other things being equal. Including a variable for the age of a firm, they also find that more established firms have higher linkages than newer firms. However, since the data are cross-section it cannot be inferred that linkages at individual firm level increase over time since the data look only at different types of firms at a single point in time. We attempt to clarify this issue below, using panel rather than cross-sectional data.
III DESCRIPTION OF THE DATA
The data used are taken from the Forfás Irish Economy Expenditure Survey (FIEES) which is collected by Forfás, the policy and advisory board for industrial development in Ireland. The survey is undertaken annually and includes output and employment data as well as detailed information on each firm’s expenditure on labour, material and services inputs. The survey does not include the total
population of firms in Ireland but is only sent out to a sub-sample of firms, viz., firms with thirty or more employees. It is not compulsory for firms to take part in the survey, but response rates are generally good; firms responding to the survey account for around 60-80 per cent of employment of the target population each year (O’Malley, 1995).
The Forfás Employment Survey (FES), on the other hand, includes all existing manufacturing and internationally-trading service firms in Ireland irrespective of size; its response rates are usually over 90 per cent (Strobl, 1996), i.e., it can be seen as including the whole population of relevant firms in Ireland. We use data on firm numbers and employment in firms in the electronics sector available from the FES to establish whether our sample of firms taken from the FIEES can be considered representative of the total population.
The data available to us for the period 1982 to 1995 include all firms surveyed in the electronics sector, distinguished by nationality of ownership. The electronics sector itself is classified by Forfás into 12 sub-sectors which cover manufacturing and service activities: Computers, Consumer Electronics, Electronic Components, Instrumentation, Networking & Data Communication, PC Board Assembly (PCBA), Peripherals & Media, Semiconductors, Software Development, Software Production, Telecommunications, and IT Services.13 As
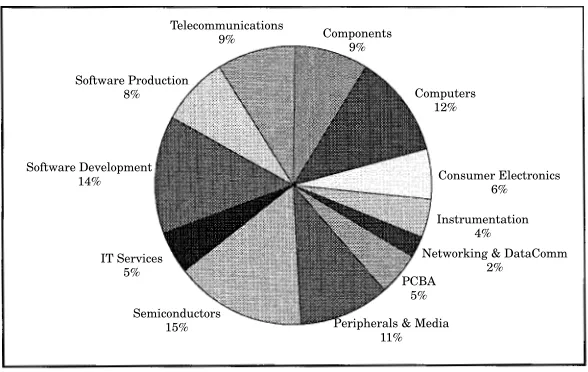
[image:6.499.100.394.399.585.2]noted above, Figure 1, which shows the employment shares of each sub-sector
Figure 1:Employment Shares in Electronics Sub-Sectors, 1995
13 . “IT Services” covers all IT related services not included in the other sub-sectors, such as Systems Integration, IT Consulting and training and education.
Semiconductors 15% IT Services
5% Software Development
14%
Software Production 8%
Telecommunications 9%
Peripherals & Media 11%
PCBA 5%
Networking & DataComm 2% Instrumentation
4%
Consumer Electronics 6% Computers
12% Components
Table 1: Employment in Sample Firms as Percentage of Employment in All Existing Firms in the Sector, 1982-1995
1982 1984 1986 1988 1990 1991 1992 1993 1994 1995
Total Foreign 0.59 0.74 0.77 0.73 0.70 0.85 0.79 0.81 0.74 0.72
Components 0.62 0.60 0.76 1.00 0.81 1.11 1.01 1.10 1.18 0.79 Computers 0.91 0.97 0.91 1.04 1.22 1.33 0.94 0.83 0.23 0.27 Consumer
Electronics 0.47 0.51 0.49 0.49 0.60 0.49 0.53 0.58 0.59 0.64 Instrumentation 0.18 0.29 0.52 0.29 0.69 0.74 0.75 0.76 0.61 0.62 Networking/
Data Com — — — 0.03 0.12 0.30 0.64 0.86 0.73 1.19
PCBA — — — — 0.42 0.56 0.88 0.47 1.39 1.27
Peripherals
& Media 0.52 0.89 0.97 0.96 0.99 0.99 0.96 0.98 0.49 0.63 Semiconductors 0.12 0.72 0.95 0.92 0.88 0.83 0.73 0.91 1.01 0.94 Services — — 0.05 0.08 0.08 0.23 0.59 1.01 0.64 0.63 Software
Development 0.80 0.85 0.51 0.23 — 0.27 0.32 0.79 0.57 0.46 Software
Production — — — — 0.21 0.87 0.82 0.18 0.86 0.88
cations 0.59 1.03 1.48 1.19 1.07 1.35 1.19 0.94 1.08 0.97
Total Irish 0.10 0.38 0.19 0.27 0.47 0.48 0.55 0.60 0.61 0.56
Components 0.20 0.20 0.24 0.40 0.54 0.66 0.66 0.77 0.74 0.65
Computers — — — — — — — — — —
Consumer
Electronics 0.11 1.01 0.22 0.10 1.09 0.73 0.64 1.32 1.28 0.86
Instrumentation — — — — — 0.16 0.25 0.25 0.16 0.09
Networking/
Data Com 0.00 0.42 0.96 0.69 0.73 0.22 0.88 0.86 0.29 0.37 PCBA 0.12 0.24 0.38 0.77 0.91 0.81 0.96 0.77 0.79 0.76 Peripherals
& Media — — 0.30 0.62 — 0.35 0.41 — 0.52 0.64
Semiconductors — — — — — — — — — —
Services — — — — 0.23 0.37 0.29 0.47 0.66 0.78
Software
Development — — — — — 0.23 0.35 0.18 0.22 0.23
Software
Production — — — — — 0.46 0.62 0.64 1.33 1.32
cations — 0.17 — 0.25 0.78 0.40 0.61 0.65 0.74 0.73 Note: Some of the percentages are greater than 1. This may be due to the fact that Employment
Survey data are collected in November while the IEE Survey is carried out in May. One may, therefore, expect small discrepancies between the employment figures obtained in the two surveys.
of electronics in 1995, reveals how the electronics sector in Ireland has the potential for local material sub-supply.14
The sample cannot be regarded as being perfectly representative of the total population of firms in the electronics sector for several reasons. First, indigenous firms are underrepresented, while 75 per cent of the 325 firms in the sample are foreign-owned, the FES data indicate that in the population of 800 firms in the electronics sector, only some 43 per cent were foreign-owned. Second, the exclusion of small firms from the sample leads to an over-representation of large firms; as the figures in Table 1 show, sample firms account for a far higher share of employment than firm numbers: 72 and 56 per cent of employment in foreign and Irish-owned firms in that sector respectively in 1995 compared with 44 and 14 per cent of firms respectively. Third, as the data in Table 1 indicate, the sample’s coverage of the total electronics industry in Ireland in terms of employment differs widely by sub-sector, as well as by nationality of ownership. Hence, while our results may be regarded as offering an insight into the develop-ment and the determinants of linkages in the Irish electronics sector as a whole, the results and the conclusions drawn are only valid for the analysed sample.
Finally, we must note one caveat in using the FIEES data, namely, that they do not allow us to distinguish between linkages with domestically based Irish-owned firms, and linkages with domestically based foreign-Irish-owned firms. Thus, we cannot interpret an increase in linkages as necessarily inducing sub-supply from indigenous firms. Given the huge presence of MNCs in the electronics sector, it is highly likely that some (and possibly most) of the linkages generated by MNCs are linkages to foreign-owned rather than indigenous companies MNCs, particularly since some foreign firms have located in Ireland specifically to sub-supply MNCs. The data limitations suggest that caution must be exercised in interpreting the results but do not invalidate the analysis, since domestically-based foreign suppliers also contribute to the development of the local economy through employment and other expenditures.
IV DESCRIPTIVE STATISTICS
We begin by calculating total backward linkages as the percentage of total inputs (i.e., raw materials, intermediate inputs and services) that are sourced in Ireland.15 In order to give an overview of the development of linkages in
Table 2: Linkages by Sample Firms in the Electronics Sector in Ireland, 1982-1995
(Percentage of raw materials, components and services purchased in Ireland)
1982 1984 1986 1988 1990 1991 1992 1993 1994 1995
Total Foreign 0.17 0.26 0.26 0.26 0.31 0.37 0.40 0.34 0.36 0.39
Components 0.30 0.27 0.26 0.28 0.35 0.32 0.33 0.27 0.31 0.27 Computers 0.15 0.24 0.24 0.22 0.27 0.28 0.34 0.35 0.19 0.28 Consumer
Electronics 0.27 0.31 0.24 0.30 0.29 0.32 0.33 0.32 0.33 0.35 Instrumentation 0.29 0.44 0.26 0.39 0.36 0.28 0.23 0.28 0.40 0.36 Networking/
Data Com — — — 0.25 0.17 0.36 0.27 0.26 0.16 0.19
PCBA — — — — 0.29 0.19 0.16 0.18 0.26 0.23
Peripherals
and Media 0.37 0.31 0.24 0.30 0.44 0.42 0.28 0.27 0.44 0.50 Semiconductors 0.22 0.23 0.18 0.22 0.16 0.12 0.20 0.17 0.13 0.20 Services — — 0.80 0.83 0.55 0.66 0.68 0.44 0.41 0.42 Software
Development 0.16 0.29 0.23 0.10 — 0.57 0.63 0.44 0.45 0.47 Software
Production — — — — 0.72 0.82 0.81 0.91 0.75 0.76
cations 0.20 0.43 0.48 0.53 0.47 0.51 0.42 0.37 0.39 0.29
Total Irish 0.48 0.41 0.44 0.50 0.42 0.44 0.46 0.43 0.49 0.49
Components 0.20 0.21 0.33 0.50 0.51 0.54 0.52 0.39 0.44 0.43
Computers — — — — — — — — — —
Consumer
Electronics 0.48 0.37 0.59 0.55 0.32 0.25 0.34 0.36 0.35 0.27
Instrumentation — — — — — 0.54 0.55 0.66 0.64 0.73
Networking/
Data Com — 0.32 0.52 0.43 0.46 0.17 0.33 0.37 0.22 0.22 PCBA 0.75 0.35 0.40 0.28 0.39 0.30 0.31 0.22 0.37 0.41 Peripherals
and Media — — 0.23 0.82 — 0.59 0.47 — 0.55 0.54
Semiconductors — — — — — — — — — —
Services — — — — 0.80 0.83 0.62 0.71 0.65 0.64
Software
Development — — — — — 0.91 0.74 0.66 0.82 0.83
Software
Production — — — — — 0.63 0.61 0.72 0.63 0.54
cations — 0.90 — 0.90 0.44 0.60 0.54 0.52 0.44 0.47 Note: The considerable fluctuations at the sub-sectoral level in some cases are due to the changing
number of firms responding to the survey which would, in particular, affect sub-sectors with only a very small number of respondents.
sample firms we calculate linkages for each sub-sector in electronics. Since, based on the results by McAleese and McDonald (1978) and O’Farrell and O’Loughlin (1981) one would expect linkages in indigenous firms to be higher than in foreign-owned firms, we calculate the figures for foreign and indigenous firms separately.
Table 2, which shows total linkages by nationality group and sub-sector confirms the findings of earlier studies, namely, that, in aggregate, indigenous firms in the electronics sector have higher linkages with domestic suppliers than foreign firms, although the gap between these groups has narrowed over time. The table also shows that there are large differences between the extent of linkages across particular sub-sectors, which may reflect the fact that firms in different sub-sectors of electronics are at different stages of the production process.16 This finding might also be due to different sub-sectors’ use of different
mixes of materials and services inputs; as one can see from Table 3, services linkages are generally higher than material linkages.
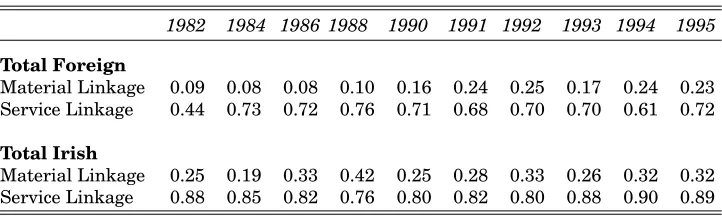
Since, as noted above, we are interested in the distinction between service linkages (defined as the percentage of services inputs sourced domestically) and material linkages (defined as the share of raw materials and intermediate inputs sourced domestically), we present in Table 3 the services and material linkages for electronics overall, for both foreign and indigenous firms over the analysed period. Not surprisingly, local service linkages are significantly higher than material linkages, reflecting the lesser degree of international tradability of many services compared with materials. For both nationality groups, firms’ service linkages have remained fairly constant over the sample period. Material linkages have increased, particularly for foreign firms, since 1982. Since many of these inputs are likely to come from within the sector, this growth is likely to reflect the development of the electronics sector in Ireland, with increasing numbers of firms being established in up-stream sectors.
Table 3 shows that while these material linkages increased steadily up to the early 1990s, they appear to have remained at a relatively constant level, or even declined, since then.17 Policy makers are concerned as to what explains
this “levelling-off”. Is there an effective limit to the extent to which firms can link locally and has this now been achieved? Have linkages in some firms actually
16. Note that the figures in Table 2, especially at the sub-sectoral level, fluctuate considerably over the years. This is due to the changing number of firms responding to the survey which would, in particular, affect sub-sectors with only a very small number of respondents. However, the general trend of increasing linkages in foreign firms is also confirmed in the published figures in Forfás (1996) where the percentages of Irish-sourced raw materials for non-food manufacturing firms are reported. These fluctuations should not pose a problem for the econometric analysis below since we use firm level data for this estimation.
Table 3: Alternative Definitions of Linkages (Percentage of inputs purchased in Ireland)
1982 1984 1986 1988 1990 1991 1992 1993 1994 1995
Total Foreign
Material Linkage 0.09 0.08 0.08 0.10 0.16 0.24 0.25 0.17 0.24 0.23 Service Linkage 0.44 0.73 0.72 0.76 0.71 0.68 0.70 0.70 0.61 0.72
Total Irish
Material Linkage 0.25 0.19 0.33 0.42 0.25 0.28 0.33 0.26 0.32 0.32 Service Linkage 0.88 0.85 0.82 0.76 0.80 0.82 0.80 0.88 0.90 0.89
Source: Own estimates derived from Forfás Irish Economy Expenditure Survey data.
declined, perhaps due to domestic supply constraints or because of new out-sourcing possibilities? Do the data reflect any real change in pattern at firm level or do they indicate the increasing numbers of new firms (especially foreign firms) which have been set up in the 1990s and which have yet to establish local linkages? We look at these questions in more detail in the econometric analysis below.
V ECONOMETRIC MODEL
To analyse the determinants of linkages we, in the spirit of McAleese and McDonald (1978) and O’Farrell and O’Loughlin (1981), relate the level of backward linkages (BL) in a firm i at time t to a number of independent variables,
BLit = β0+ β1foreigni+ β2matureit+ β3matureit2 + β4sizeit+…+
β5exratit+ β6indjt−1+ β8eert−1+ β8Dj+uit (1)
where b0 is a constant assumed to be equal for all firms and uit is the error term which is assumed to consist of two components, viz., uit = µi+ εit with µi capturing a firm specific permanent and unobservable effect, such as the influence of a particular production technology or management technique, and
εit being the remaining period specific error term, assumed to be independent
across firms and over time. We use the three alternative linkage definitions, as presented above, as dependent variables.
and O’Loughlin, 1981) we would expect a negative relationship between this variable and the extent of linkages.18
A proxy variable matureit is included in the regression to account for the
development of linkages as the firm matures. This variable is set equal to one when a firm enters the sample for the first time and then increases by one every year. In order to capture the effect that firms at different stages of their life cycle could have on the creation of linkages we would, ideally, like to include an age variable for each firm, but such data are not available to us in the FIEES. If we take the maturity variable to be an appropriate indicator of age, the coefficient on the variable will capture the marginal effect of age on BL, since the firm-specific constant µi accounts for the difference in age levels across firms.19
Since earlier studies suggest that longer established firms have higher linkages, we would expect this variable to be positively related to the development of linkages. Firms may increase their linkages over time due to a “learning effect”, i.e., firms learn about the quality and reliability of domestic suppliers over time (McAleese and McDonald, 1978). In contrast with the earlier studies, we allow explicitly for the possibility that this learning effect leads to a decreasing rate in the growth of linkages afterwards, i.e., that the “maturity” effect levels off over time, by including the square of the maturity proxy variable matureit2
in the estimation.
Also, as in O’Farrell and O’Loughlin (1981), we include (the log of) average employment as a proxy for firm size.20 We would expect this variable to be
negatively related to the extent of a firm’s linkages to the domestic market. As O’Farrell and O’Loughlin (1981) point out, large firms might be expected to have lower linkages because economies of scale make them more self-sufficient than smaller firms. Furthermore, the recent trends towards global out-sourcing of activities and down-sizing of production in firms suggest that smaller firms may be more likely to have higher linkages than large firms, i.e., to source proportionally more inputs locally.
18. One may expect differences in the extent of linkages across foreign nationalities as well, with firms from outside the EU being more likely to have higher linkages because of the relatively higher costs of sourcing inputs in their home country and shipping them to Ireland (see Rodriguez-Clare, 1996, for a theoretical discussion). However, the data set does not allow us to distinguish between foreign nationalities.
19. Strictly speaking, this assumption only holds if we assume that firms only drop out of the sample due to firm death. Given the way the survey is conducted this may not be too strong an assumption, but we have no way of making sure that this is in fact the case.
We also include a firm’s export ratio as in O’Farrell and O’Loughlin (1981). They argue that firms with a high propensity to export may be more accustomed to dealing with foreign customers and may also be more aware of foreign sources of supply than firms that sell mainly on the indigenous market. Thus they would expect linkages (in particular material and intermediate input linkages) to be negatively related to the export ratio. While this argument may be reasonable for indigenous firms, we would not expect it to be important for foreign owned firms, as such firms, by their very nature, should be familiar with the inter-national environment.
Furthermore, the model includes ind, a proxy for the size of industry j, measured as the (log of) total employment in the electronics industry as defined in this paper. We include this variable to control for aggregate demand in the electronics industry. Also, it serves as a proxy for the size and capability of the industry to provide inputs demanded.21
To account for changes in the macroeconomic environment over time we include the effective exchange rate at time t, eert, in the equation (see Swenson, 2000). We would expect that, as the effective exchange rate appreciates, the relative price of indigenous inputs to imported inputs increases which may lead a firm to substitute imported inputs for Irish sourced inputs. This would, hence, lead to a negative relationship between effective exchange rate and the extent of material and intermediate input linkages in particular.
Finally, the regression includes 11 sectoral dummies to control for differences across sub-sectors in electronics; the reference sector is Networking & Datacommunications. Since there are differences in production processes across these sub-sectors, one may expect different sub-sectors to have varying degrees of linkages.22
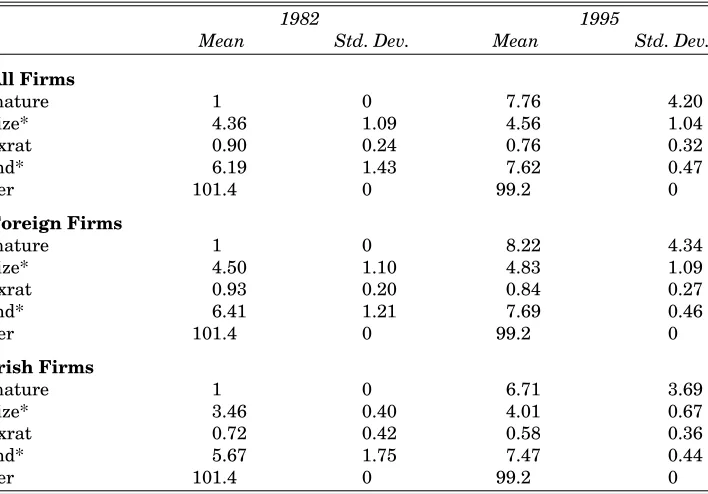
We calculate the industry size variable from employment data in the FES. The data for the eer variable are taken from various issues of the OECD Economic Outlook, while all other variables included in the model are estimated from data in the FIEES. Some summary statistics on the independent variables are presented in Table 4.
21. We are grateful to an anonymous referee for pointing this out to us.
Table 4: Summary Statistics
1982 1995
Mean Std. Dev. Mean Std. Dev.
All Firms
mature 1 0 7.76 4.20
size* 4.36 1.09 4.56 1.04
exrat 0.90 0.24 0.76 0.32
ind* 6.19 1.43 7.62 0.47
eer 101.4 0 99.2 0
Foreign Firms
mature 1 0 8.22 4.34
size* 4.50 1.10 4.83 1.09
exrat 0.93 0.20 0.84 0.27
ind* 6.41 1.21 7.69 0.46
eer 101.4 0 99.2 0
Irish Firms
mature 1 0 6.71 3.69
size* 3.46 0.40 4.01 0.67
exrat 0.72 0.42 0.58 0.36
ind* 5.67 1.75 7.47 0.44
eer 101.4 0 99.2 0
Source: Own estimates derived from Forfás Irish Economy Expenditure Survey data. * These variables are measured in log form.
VI ESTIMATION RESULTS
Our dependent variable provides us with a complication for the estimation of Equation (1) because it is limited to take on values between 0 and 100. Account can be taken of this for non-panel data by using an estimation technique for such limited dependent variables, namely, a Tobit model (Tobin, 1958) as used by Driffield and Mohd Noor (1999). However, the use of panel data and the presence of a firm-specific effect means that we cannot use this technique without further alterations (Baltagi, 1995). Maddala (1987) discusses a Random Effects Tobit estimator which can be used to tackle this problem. We therefore use the RE tobit estimation technique as implemented by Stata Version 6.0 (StataCorp, 1999). Note also that our dataset is not a balanced panel, the estimation, therefore, uses a generalisation for unbalanced panels due to Baltagi (1985).
for firms in the electronics sector over all, while the separate regressions enable us to analyse in more detail the determinants of linkages for the two nationality groups, and possible differences between them.
The estimation results for the RE tobit model for all firms are presented in Table 5. The hypothesis that all coefficients are jointly equal to zero
χ
2 β = β k
(
)
(
)
can be rejected in all specifications. A likelihood-ratio test shows that the RE tobit model is preferred to a simple pooled tobit model without RE
χ
2
(
σu =0)
(
)
for all specifications.
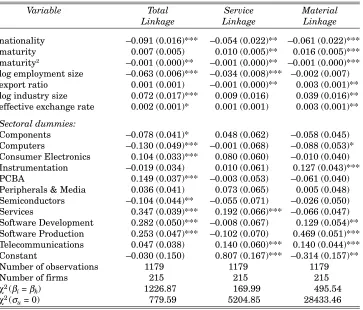
[image:15.499.67.430.279.589.2]The results for the estimation using data for all firms are presented in Column 1. The most important result from our point of view is that the dummy variable controlling for the impact of nationality has the expected negative and statis-tically significant sign. This suggests that, even when controlling for other firm
Table 5: Regression Results for all firms (Tobit Model) Dependent Variable: Linkage in firm i
Variable Total Service Material
Linkage Linkage Linkage
nationality –0.091 (0.016)*** –0.054 (0.022)** –0.061 (0.022)*** maturity 0.007 (0.005) 0.010 (0.005)** 0.016 (0.005)*** maturity2 –0.001 (0.000)** –0.001 (0.000)** –0.001 (0.000)***
log employment size –0.063 (0.006)*** –0.034 (0.008)*** –0.002 (0.007) export ratio 0.001 (0.001) –0.001 (0.000)** 0.003 (0.001)** log industry size 0.072 (0.017)*** 0.009 (0.016) 0.039 (0.016)** effective exchange rate 0.002 (0.001)* 0.001 (0.001) 0.003 (0.001)**
Sectoral dummies:
Components –0.078 (0.041)* 0.048 (0.062) –0.058 (0.045) Computers –0.130 (0.049)*** –0.001 (0.068) –0.088 (0.053)* Consumer Electronics 0.104 (0.033)*** 0.080 (0.060) –0.010 (0.040) Instrumentation –0.019 (0.034) 0.010 (0.061) 0.127 (0.043)*** PCBA 0.149 (0.037)*** –0.003 (0.053) –0.061 (0.040) Peripherals & Media 0.036 (0.041) 0.073 (0.065) 0.005 (0.048) Semiconductors –0.104 (0.044)** –0.055 (0.071) –0.026 (0.050) Services 0.347 (0.039)*** 0.192 (0.066)*** –0.066 (0.047) Software Development 0.282 (0.050)*** –0.008 (0.067) 0.129 (0.054)** Software Production 0.253 (0.047)*** –0.102 (0.070) 0.469 (0.051)*** Telecommunications 0.047 (0.038) 0.140 (0.060)*** 0.140 (0.044)*** Constant –0.030 (0.150) 0.807 (0.167)*** –0.314 (0.157)**
Number of observations 1179 1179 1179
Number of firms 215 215 215
χ2(β
i = βk) 1226.87 169.99 495.54
χ2(σ
u = 0) 779.59 5204.85 28433.46
Notes: Standard Error in parentheses.
and sector-specific effects, foreign firms tend to have lower linkages than domestic firms. This result confirms the descriptive statistics above and coincides with the econometric results in McAleese and McDonald (1978) and O’Farrell and O’Loughlin (1981).
We find a positive and statistically significant relationship between the extent of linkages and the proxy for firm maturity, as indicated by the date at which the firm entered the survey, for the service and material linkage, while the coefficient for the total linkage estimation is positive but marginally insignificant. We also find a statistically significant negative sign for the maturity-squared variable in all specifications, which suggests that there is a concave relationship between the time a firm has been in the sample and the development of linkages, i.e., linkages at firm levelincrease over time at a diminishing rate.
The finding of a positive time effect concurs with the interpretation of cross-sectional results in McAleese and McDonald (1978) and O’Farrell and O’Loughlin (1981), who, as noted above, did not allow for a concave relationship. The initial increase in linkages over time may indicate that firms, once they get accustomed to the local market also source more of their inputs locally, i.e., the transactions costs of sourcing inputs locally decrease over time relative to the transactions costs of purchasing inputs abroad. The concave relationship suggests that this learning effect is strongest in the earlier stage of the firms’ life cycle. In the light of the apparent “levelling-off” of total linkages in foreign electronics firms in the early 1990s, this result appears to suggest that this may be primarily due to new firms establishing in Ireland in this period, rather than to a ceiling or a downturn in the extent of linkages in established firms.
The coefficients on the firm size and industry size variables are largely in line with prior expectations. The negative total linkage effect in the case of firm size, which is consistent with O’Farrell and O’Loughlin (1981), seems to be driven by services, suggesting that larger firms have lower services linkages, possibly implying that they undertake these services “in house”. The positive total effect of industry size coincides, not surprisingly, with a strong material linkages effect, reflecting the ability of the growing sector in Ireland to sub-supply. The results for the export ratio and effective exchange rate are not as clear cut, however. We discuss these in more detail below.
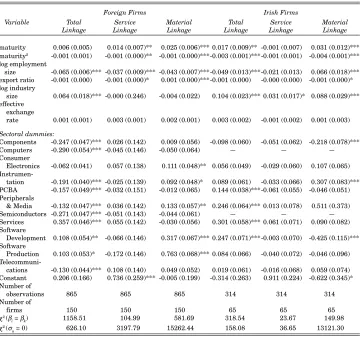
Given the result that foreign firms have substantially lower linkages, even when controlling for other factors, we now investigate whether the determinants of linkages also differ for foreign and indigenous firms. We do this by estimating Equation (1) for foreign and Irish-owned firms separately, excluding the nationality dummy. The results of this exercise are reported in Columns 1 to 3 of Table 6 for foreign, and Columns 4 to 6 for indigenous firms.23 This
disaggregation of the data, and the different definitions of the dependent variable, allow us to identify a number of important differences.
Table 6: Regression Results for Foreign vs. Irish firms (Tobit Model) Dependent Variable: Linkage in firm i
Foreign Firms Irish Firms
Variable Total Service Material Total Service Material
Linkage Linkage Linkage Linkage Linkage Linkage
maturity 0.006 (0.005) 0.014 (0.007)** 0.025 (0.006)*** 0.017 (0.009)** -0.001 (0.007) 0.031 (0.012)*** maturity2 -0.001 (0.001) -0.001 (0.000)** -0.001 (0.000)***-0.003 (0.001)***-0.001 (0.001) -0.004 (0.001)***
log employment
size -0.065 (0.006)*** -0.037 (0.009)*** -0.043 (0.007)***-0.049 (0.013)***-0.021 (0.013) 0.066 (0.018)*** export ratio -0.001 (0.000) -0.001 (0.000)* 0.001 (0.000)***-0.001 (0.000) -0.000 (0.000) -0.001 (0.000)* log industry
size 0.064 (0.018)*** -0.000 (0.246) -0.004 (0.022) 0.104 (0.023)*** 0.031 (0.017)* 0.088 (0.029)*** effective
exchange
rate 0.001 (0.001) 0.003 (0.001) 0.002 (0.001) 0.003 (0.002) -0.001 (0.002) 0.001 (0.003)
Sectoral dummies:
Components -0.247 (0.047)*** 0.026 (0.142) 0.009 (0.056) -0.098 (0.060) -0.051 (0.062) -0.218 (0.078)*** Computers -0.290 (0.054)*** -0.045 (0.146) -0.050 (0.064) — — — Consumer
Electronics -0.062 (0.041) 0.057 (0.138) 0.111 (0.048)** 0.056 (0.049) -0.029 (0.060) 0.107 (0.065)
tation -0.191 (0.040)*** -0.025 (0.139) 0.092 (0.048)* 0.089 (0.061) -0.033 (0.066) 0.307 (0.083)*** PCBA -0.157 (0.049)*** -0.032 (0.151) -0.012 (0.065) 0.144 (0.038)***-0.061 (0.055) -0.046 (0.051) Peripherals
& Media -0.132 (0.047)*** 0.036 (0.142) 0.133 (0.057)** 0.246 (0.064)*** 0.013 (0.078) 0.511 (0.373) Semiconductors -0.271 (0.047)*** -0.051 (0.143) -0.044 (0.061) — — — Services 0.357 (0.046)*** 0.055 (0.142) -0.030 (0.056) 0.301 (0.058)*** 0.061 (0.071) 0.090 (0.082) Software
Development 0.108 (0.054)** -0.066 (0.146) 0.317 (0.067)*** 0.247 (0.071)***-0.003 (0.070) -0.425 (0.115)*** Software
Production 0.103 (0.053)* -0.172 (0.146) 0.763 (0.068)*** 0.084 (0.066) -0.040 (0.072) -0.046 (0.096)
cations -0.130 (0.044)*** 0.108 (0.140) 0.049 (0.052) 0.019 (0.061) -0.016 (0.068) 0.059 (0.074) Constant 0.206 (0.166) 0.736 (0.259)*** -0.005 (0.199) -0.314 (0.263) 0.911 (0.224) -0.622 (0.345)* Number of
observations 865 865 865 314 314 314 Number of
firms 150 150 150 65 65 65
χ2 (β
i = βk) 1158.51 104.99 581.69 318.54 23.67 149.98
χ2 (σ
u = 0) 626.10 3197.79 15262.44 158.08 36.65 13121.30
Notes: Standard Error in parentheses.
statistically significant at *** 1 per cent ** 5 per cent * 10 per cent level.
Computers and Semiconductors are dropped from sample for Irish firms because there are no Irish firms in the sample in these sectors.
their service inputs locally regardless of firm age while foreign firms increase service linkages over time.
The firm-size variable yields an unambiguous result for foreign firms. The coefficient is negative in all three specifications indicating that larger firms tend to have lower linkages, ceteris paribus. This is quite different for indigenous firms. While there is no significant relationship between service linkages and size, we find a positive coefficient on size for material linkages, i.e., large firms source, all other things equal, a larger share of material inputs in the Irish economy. This may perhaps indicate that large indigenous firms have more developed relationships with their domestic material suppliers, or that the intermediate inputs requirements of domestic firms, compared with foreign firms, may be more readily met by domestic suppliers. This finding is consistent with the positive coefficient on industry size in all specifications for indigenous firms. In the case of foreign firms, however, industry size is not statistically significant for either material or service linkages.
As expected we find that indigenous firms with high export ratios have lower material linkages, while the unexpected opposite is the case for foreign firms. However, we may wish to interpret this quite differently, namely, that while traditionally most firms have located in Ireland as an export base, and not to supply the Irish market, the summary statistics in Table 4, which show a falling average export ratio for foreign firms, indicate that there are some foreign firms now locating in Ireland specifically to sub-supply existing firms. One may expect that these firms may not have any particular interest in generating backward linkages.
The coefficient on the effective exchange rate is statistically insignificant in all specifications, which suggests that there is no relationship between this variable and the extent of linkages. This may indicate the greater importance of firm and sectoral characteristics in explaining the extent of a firm’s linkage with the Irish economy. The macroeconomic environment does not seem to affect the decision as to where to source inputs to any extent.24
We also find statistically significant differences in linkages across electronics sub-sectors for some specifications as indicated by the coefficients on the sectoral dummies. As pointed out above, this may be due to the nature of production in these sub-sectors.
VII SUMMARY AND CONCLUSIONS
Econometricstudies of inter-firm linkages in the Irish economy by McAleese and McDonald (1978) and O’Farrell and O’Loughlin (1980, 1981) found that
foreign firms in Ireland in the 1970s tended to have lower linkages than domestic firms. They also found that the extent of linkages differed across sectors and was positively related to a firm’s age. Their results, however, are based on cross-sectional data which do not allow one to conclude on a time trend. Our empirical study of backward linkages in the Irish electronics sector over the period 1982 to 1995 adds to the literature on inter-firm linkages in Ireland by using a panel of firm level data rather than a cross-sectional data set as used in the earlier studies.
Our finding that, in the sample of electronics firms (both foreign and indigenous) analysed, linkages seem to increase over time supports the tentative conclusion of a positive time trend drawn in the earlier papers discussed. This indicates that one may expect new firms attracted to Ireland to start off with relatively low linkages which, however, will increase over time (see, also, Kennedy, 1991).
Our results also confirm the earlier findings that, ceteris paribus, foreign firms have lower linkages than indigenous electronics firms, though the gap between the two nationality groups has narrowed over the period, particularly in the case of service linkages. Both results are to be expected since, in general, indigenous firms would be more likely than foreign firms to source inputs locally and service linkages are likely to be greater given that they are less internationally tradable. The growth in the material linkages is consistent with overall development of the electronics sector in Ireland, and is evident in the significant positive coefficient on industry size in Table 6. It suggests that the Irish strategy of fostering material linkages in this sector was well conceived.
A major issue for future policy is whether, in the world of e-commerce such local supply linkages will be sustainable into the future as MNCs seek global suppliers. The fact that our results show that large foreign firms have lower linkages than other foreign firms gives rise to some concern in this regard. To the extent that these low linkages arise from indigenous suppliers not having the necessary scale to provide large volumes of inputs, the present policy of supporting the expansion of small and medium indigenous sub-supply companies may only be successful, if these firms can achieve the scale required to become global suppliers.
REFERENCES
ANGEL, DAVID P., 1994. “Tighter Bonds? Customer-Supplier Linkages in Semiconductors”, Regional Studies, Vol. 28, No. 2, pp. 187-200.
BALTAGI, BADI H., 1985. “Pooling Cross-Sections with Unequal Time-Series Lengths”, Economics Letters, Vol. 18, pp. 133-136.
BARRY, FRANK, and JOHN BRADLEY, 1997. “FDI and Trade: The Irish Host-Country Experience”, Economic Journal, Vol. 107, pp. 1798-1811.
BARRY, FRANK, JOHN BRADLEY, and EOIN O’MALLEY, 1999. “Indigenous and Foreign Industry: Characteristics and Performance”, in F. Barry (ed.) Understanding Ireland’s Economic Growth, London: Macmillan, pp. 45-74.
BARRY, FRANK, and AOIFE HANNAN, 1995. “Multinationals and Indigenous Employment: An Irish Disease?”, The Economic and Social Review, Vol. 27, No. 1, pp. 21-32.
BLOMSTRÖM, MAGNUS, and ARI KOKKO, 1998. “Multinational Corporations and Spillovers”, Journal of Economic Surveys, Vol. 12, pp. 247-277.
CROWLEY, MARTIN, 1996. National Linkage Programme: Final Evaluation Report, Dublin: Industry Evaluation Unit.
DRIFFIELD, NIGEL, and MOHD NOOR, ABD HALIM, 1999. “Foreign Direct Investment and Local Input Linkages in Malaysia”, Transnational Corporations, Vol. 8, pp. 1-23. FORFÁS, 1996. Annual Survey of Irish Economy Expenditures: Results for 1994, Dublin:
Forfás.
GÖRG, HOLGER, and ERIC STROBL, 1999. “Multinational Companies and the Entry of Indigenous Firms: Panel Data Evidence for Ireland”, Centre for Economic Research Working Paper WP99/8, University College Dublin.
GÖRG, HOLGER, and FRANCES RUANE, 2000. “European Integration and Peripher-ality: Lessons from the Irish Experience”, The World Economy, Vol. 23, pp. 405-421. HIRSCHMAN, ALBERT O., The Strategy of Economic Development. New Haven: Yale
University Press, 1958.
KEARNS, ALLAN, and HOLGER GÖRG, 2000. “Linkages, Agglomerations, and Knowledge Spillovers in the Irish Electronics Industry: The Regional Dimension”, International Journal of Technology Management, forthcoming.
KENNEDY, KIERAN A., 1991. “Linkages and Overseas Industry”, in A. Foley and D. McAleese (eds.), Overseas Industry in Ireland, Dublin: Gill and Macmillan, pp. 82-105.
KRUGMAN, PAUL R., and ANTHONY J. VENABLES, 1995. “Globalization and the Inequality of Nations”, Quarterly Journal of Economics, Vol. 110, pp. 857-880. KRUGMAN, PAUL R., and ANTHONY J. VENABLES, 1996. “Integration, Specialization,
and Adjustment”, European Economic Review, Vol. 40, pp. 959-967.
LEWIS, W.A., 1954. “Economic Development with Unlimited Supply of Labour”, The Manchester School, Vol. 22, pp. 139-191.
LITTLE, I.M.D., 1982. Economic Development: Theory, Policy and International Relations, New York: Basic Books, Inc.
MADDALA, G.S., 1987. “Limited Dependent Variable Models using Panel Data”, Journal of Human Resources, Vol. 22, pp. 303-326,
MARKUSEN, JAMES R., and ANTHONY J. VENABLES, 1999. “Foreign Direct Investment as a Catalyst for Industrial Development”, European Economic Review, Vol. 43, pp. 335-356.
McALEESE, DERMOT, 1977. A Profile of Grant-Aided Industry in Ireland, Dublin: Industrial Development Authority.
Development: External Control in the Scottish Electronics Industry”, Scottish Journal of Political Economy, Vol. 26, No. 3, pp. 287-306.
O’DONNELLAN, NIALL, 1994. “The Presence of Porter’s Sectoral Clustering in Irish Manufacturing”, The Economic and Social Review, Vol. 25, No. 3, pp. 221-232. O’FARRELL, P.N., and BRIAN O’LOUGHLIN, 1980. An Analysis of New Industry
Linkages in Ireland, Dublin: Industrial Development Authority.
O’FARRELL, P.N., and BRIAN O’LOUGHLIN, 1981. “New Industry Input Linkages in Ireland: An Econometric Analysis”, Environment and Planning A, Vol. 13, No. 3, pp. 285-308.
O’LOUGHLIN, BRIAN, and P.N. O’FARRELL, 1980. “Foreign Direct Investment in Ireland: Empirical Evidence and Theoretical Implications”, The Economic and Social Review, Vol. 11, No. 3, pp. 155-185.
O’MALLEY, EOIN, 1989. Industry and Economic Development: The Challenge for the Latecomer, Dublin: Gill and Macmillan.
O’MALLEY, EOIN, 1995. An Analysis of Secondary Employment Associated with Manufacturing Industry, General Research Series Paper No. 167, Dublin: The Economic and Social Research Institute.
RODRÍGUEZ-CLARE, ANDRÉS, 1996. “Multinationals, Linkages, and Economic Development”, American Economic Review, Vol. 86, No. 4, pp. 852-873.
RUANE, FRANCES, and HOLGER GÖRG, 1996. “Aspects of Foreign Direct Investment in Irish Manufacturing since 1973: Policy and Performance”, Journal of the Statistical and Social Inquiry Society of Ireland, Vol. XXVII, Part IV, pp. 37-85.
RUANE, FRANCES, and HOLGER GÖRG, 1997. “The Impact of Foreign Direct Investment on Sectoral Adjustment in the Irish Economy”, National Institute Economic Review, No. 160, pp. 76-86.
STATACORP, 1999. Stata Statistical Software: Release 6.0. College Station, TX: Stata Corporation.
STEWART, J.C., 1976. “Linkages and Foreign Direct Investment”, Regional Studies, Vol. 10, No. 2, pp. 245-258.
STROBL, ERIC, 1996. “Essays on Labour Dynamics in Ireland”, unpublished Ph.D. thesis, Trinity College Dublin.
SWENSON, DEBORAH L., 2000. “Firm Outsourcing Decisions: Evidence from U.S. Foreign Trade Zones”. Economic Inquiry, Vol. 38, pp. 175-189.
TOBIN, JAMES, 1958. “Estimation of Relationships for Limited Dependent Variables”, Econometrica, Vol. 26, No. 1, pp. 24-36.
TUROK, IVAN, 1993. “Inward Investment and Local Linkages: How Deeply Embedded is ‘Silicon Glen’?”, Regional Studies, Vol. 27, No. 5, pp. 401-417.
VENABLES, ANTHONY J., 1994. “Economic Integration and Industrial Agglomeration”, The Economic and Social Review, Vol. 26, No 1, pp. 1-18.
VENABLES, ANTHONY J., 1996. “Equilibrium Locations of Vertically Linked Industries”, International Economic Review, Vol. 37, pp. 341-359.