NEWTON, Philip D.
Available from Sheffield Hallam University Research Archive (SHURA) at:
http://shura.shu.ac.uk/20115/
This document is the author deposited version. You are advised to consult the
publisher's version if you wish to cite from it.
Published version
NEWTON, Philip D. (2003). The presentation of business process models. Masters,
Sheffield Hallam University (United Kingdom)..
Copyright and re-use policy
Return to Learning Centre of issue
Fines are charged at 50p per hour
5 9 ill
All rights reserved
INFORMATION TO ALL USERS
The quality of this reproduction is dependent upon the quality of the copy submitted.
In the unlikely event that the author did not send a com plete manuscript and there are missing pages, these will be noted. Also, if material had to be removed,
a note will indicate the deletion.
uest
ProQuest 10697422
Published by ProQuest LLC(2017). Copyright of the Dissertation is held by the Author.
All rights reserved.
This work is protected against unauthorized copying under Title 17, United States C ode Microform Edition © ProQuest LLC.
ProQuest LLC.
789 East Eisenhower Parkway P.O. Box 1346
The Presentation of
Business Process Models
By
Philip D. Newton
A thesis submitted in partial fulfilment of the requirements
Sheffield Hallam University
for the degree of Master of Philosophy
MPhil The Presentation of Business Process Models Abstract
Abstract
The Presentation of Business Process Models
It has become common practice for businesses encompassing all industries to utilize a tool or technique to capture the data and flow of processes running through a company. As companies grow and the volume and complexity of the business processes increases, it becomes of greater importance to rigorously record the functions being performed. As a consequence of this, the simple diagrams that once represented the flows of information steadily become page after page of complex transactions. Effectively communicating the information stored within these large and often complex models to the end user is a significant problem. This research addresses the issues surrounding the presentation of such large scale and complex Business Process Models to the end user.
An in depth literature review and benchmarking study was carried out, with the intention of investigating the current practices used within industry, and identifying any operational issues regarding these practices. Through this research work, a methodology is developed to allow the transformation and transportation of a selected area within a complex business process model. This transformation/transportation process allows the generation of a new model, containing clear and simple process logic and presented in a user-friendly format.
Acknowledgements
This MPhil research was completed as part of the Master of Philosophy at the School of Engineering, Sheffield Hallam University, between October 2001 and June 2003. The work is my own and the results obtained during the MPhil program are to the best of my knowledge, original, the work of others used or drawn upon is attributed to the relevant source.
MPhil The Presentation of Business Process Models Contents
Contents
Page
Title Page i
Abstract ii
Acknowledgements iii
Contents iv
1. Introduction
1.1. Introduction 1
1.2. Operational Issues 3
1.3. Objectives of the Research 4
1.3.1 Literature Review 5
1.3.2 Benchmarking Software modelling & presentation techniques 5
1.3.3 Develop a methodology to transform Business Process 6
Models into a customised format.
1.3.4 Design and construct a prototype tool, which can then 6
be validated and refined.
2. Literature Review
2.1 Introduction 8
2.2 Process Orientated Approach 8
2.3 Attributes of a Process 12
2.4 The roots of Process Management 14
2.5 The evolution of Process Modelling 16
2.5.1 Established Modelling Techniques 17
2.5.2 IDEF Models 18
2.5.3 Role Activity Diagrams (RAD) 23
2.6.1.2 Object modelling and repository based Tools 29
2.6.2 Dynamic Modelling - simulation tools 30
2.6.2.1 Hybrid Tools 31
2.7 Summary of the modelling Market 32
2.8 The problem of visualising complex models 35
3. Benchmarking Study
3.1 Introduction 37
3.2 The benchmarking Process 37
3.3 Identify what is to be benchmarked 39
3.4 Benchmarking the aspects of model visualisation 41
3.5 Identify comparative companies 45
3.6 Determine a method for data collection 54
3.7 Collection of data 57
3.8 Discussion of results 60
3.9 Benchmarking Conclusions 62
4. Methodology
4.1 Introduction 63
4.2. Structure of the Aris Software 63
4.3 Structure of Visio software 67
4.4 Proposed Solution 69
4.5 Stage 1 : Selecting Model Area 71
4.6 Stage 2: Exporting data from Aris 73
4.7 Stage 3: Capturing the relevant information 75
4.7.1 Excel spreadsheets 76
4.7.2 Block Sheet 77
4.7.3 Connector Sheet 78
4.8 Stage 4: Transferring data into Visio format (Mapping building blocks) 79
MPhil The Presentation o f Business Process Models Contents
5. Experimentation
5.1 Introduction 82
5.2 Experiment A 83
5.3 Aris Software System - Selecting Model Area 84
5.3.1 Aris Software System - Exporting data from Aris 85
5.4 Visio Software System - Starting the model generation process 85
5.5 Excel Software System 86
5.5.1 Excel Software System - VBA Window 87
5.5.2 Populating the Worksheets 87
5.6 Visio Operating Environment - Completing the model generation process 89
5.7 Further Experiments 90
6. Results
6.1 Introduction 95
6.2 Success of the transportation and transformation process 95
6.3 Effectiveness of the Selection process 96
6.3.1 Validation of the selection process 98
6.3.2 Limitations of the selection process 99
6.4 Effectiveness of the data transformation and Mapping process 100
6.4.1 Validation of the data transformation and Mapping process 103
6.4.2 Limitations of the data transformation and Mapping process 105
6.5 Effectiveness of the model generation process in Visio 106
6.5.1 Validation of the model generation process in Visio 107
6.5.2 Limitations of the model generation process in Visio 107
6.6 Feedback from Industry 108
Chapter 1
Introduction
1.1 Introduction
In an increasingly competitive market place only businesses that can stay cost effective will survive (Porter 1980a, 1985). This has forced organisations to continually look for new technology and business practices that can remove processes that do not add value to a product or service (Mintzberg and Quinn 1995).
It has long been established that effectively sequencing tasks to produce an end result can drastically reduce costs. This idea was underlined by the rise of business process re engineering, which in the late 80s and early 90s made organisations think about their business practices, often for the first time (Hewitt 1995 and Davenport 1990). This has lead to the development of many sophisticated software packages dedicated to business process modelling. The purpose of this software is to capture, document and analyse business processes (Davis 2001a p4).
Initial research conducted has suggested that the uptake of these dedicated modelling packages by organisations has been slow, and in the examples where a package has been purchased, the use of the tool is often limited. Although some companies do utilise a specific tool to form the basis for their day to day process modelling needs, many others will use a variety of tools for one off projects, then never use the tool again.
MPhil The Presentation of Business Process Models Chapter 1 : Introduction
The lack of companies corporately adopting modelling tools as their standard procedure for capturing business processes is puzzling. If BPR has lead to an appreciation of the importance of business processes (Hewitt 1995 and Davenport 1990), then why hasn’t there been an increase in the use of modelling tools that reflects this growing awareness?
Although there is information available concerning process modelling, it is largely product information and successful case studies developed in cooperation with the product vendors. There has been very little published about the operational and development issues surrounding process modelling.
The scarcity of information available pointed to one possible reason for the slow uptake of modelling tools. It also meant that to gain a true appreciation of the perception of process modelling within industry, meetings with model users and vendors would be necessary.
It was through these meetings that the following reasons were identified to explain the slow uptake of process modelling tools.
• Lack of awareness - As the Author experienced, there is a lack of information available. There are very few community events for practitioners dedicated process modelling, which as a result means that companies are not being exposed to the potential advantages through meeting with companies successfully using process modelling. Many companies are simply unaware that these tools exist.
• Poor understanding of potential benefits - There is a perception within industry that modelling packages are simply diagramming tools, and their functionality is limited to drawing pictures. There is no appreciation for the potential cost savings and process understanding that a modelling package can bring.
The issues identified above illustrate the main reasons why the uptake of process modelling tools has been slow. They do not, however, explain why the use of such modelling tools after a product has been purchased remains limited to one off projects. It is this question that will be further investigated.
1.2 Operational Issues
Large-scale organisations such as British Telecom do utilize modelling tools to great effect, in order to perform a number of different tasks (BT Exact 2002):
• Conceptualise the processes within the organisation. • Structure these processes.
• Analyse the performance of these processes. • Optimise these processes for efficiency.
Initially the use of process modelling tools within B.T was limited to dedicated teams working on very specialised tasks. The users were, therefore, highly trained and experienced with the software. The success and versatility of the modelling tool, however, has meant that the use of the software has begun to spread throughout the organisation.
The potential advantage of corporate wide modelling for organisations is that all areas and aspects of business can be captured through the use of the same standardised models. The real benefit of process modelling is then felt through the communication and sharing of process logic and new ideas. It is vital then, that a common approach to modelling is applied (Scheer, 1998) so that companies may gain all the benefits that process modelling has to offer (Pidd, 1996).
MPhil The Presentation of Business Process Models Chapter 1 : Introduction
There is however, a technical issue that forms another obstacle to the success of cooperate wide process modelling, that could potentially be resolved.
The increase in the use of modelling tools within B.T has meant that many more users with little or no experience with process modelling have come in to contact with the software in some way.
The problem that faces these new users is that they are often presented with large business models which can be several pages long, with the majority of the data being of little relevance to them. The user would have to filter out the part of the model that represents their individual responsibility. This can often be a complex and confusing task, particularly if the software is not in a format with which they can relate.
After initial discussions with Industrial contacts it became evident that although there are obvious benefits to process modelling, the impact it might have on an organisation was being limited by the presentation capabilities of the tools being used. These presentation issues were restricting the use of the tool itself to smaller projects.
This lead to the obvious question, was there a better way to present the complex data in a model in a more user friendly and understandable way?
1.3 Objectives of the Research
1.3.1 Literature Review
In order to generate a beneficial recommendation, the problem itself must first be fully appreciated. The first stage of the research, therefore, must be dedicated to gaining a greater understanding of what process modelling entails.
The investigation will be conducted in the form of a literature review. This will include the current thoughts of academia, current practitioners and pioneers in the field of process modelling. It will look at how modelling has evolved over time to become more than simple flow diagrams. Although the research will take a general overview of the practices involved in business process modelling, it will be predominately focussed around the presentation techniques adopted by process modelling packages currently available.
To gain a greater understanding of the problems presented by presentation issues, visits will be arranged with industrial contacts. This will provide a greater understanding of the problem and allow a list of requirements for any possible solution to be formed. Visits will also be arranged to the software vendors in order to discuss the issues surrounding the presentation capabilities of current tools.
1.3.2 Benchmarking Software modelling & presentation techniques
Due to the diversity of modem business needs, there is now an equally large number of process modelling packages available on the market, which claim to meet the specific requirements of every business (Sodan, 2002). Although there are similarities between many of the packages, there are clear market leaders. The first task of benchmarking will be to evaluate the different techniques used to model business processes, identifying the strengths and weaknesses within each approach (Zairi, 1994).
MPhil The Presentation of Business Process Models Chapter 1 : Introduction
Identifying good practice in model presentation is therefore invaluable, and will be accomplished through benchmarking the various methods currently used (Hewitt, 1995 and Watson, 1993)
The benchmarking study should highlight the best way in which to capture and store business processes and the most effective way in which to communicate this data with the target audience.
1.3.3 Develop a methodology to transform Business Process Models into a customised format.
Subsequent to the benchmarking process a suitable package will have been selected based upon the strengths of its modelling techniques as well as its flexibility to embrace further development.
The first stage of this development will be to understand what data from the original model needs isolating, and the method in order to achieve this.
Once the relevant data has been captured, the second stage of development will involve the transportation of this data out of the original tool into a new environment.
The third stage will be to develop the visualisation aspects of the new model. How will the information be displayed and what method will be used to do this. The benchmarking study should provide recommendations to allow this stage of the development to be completed.
It is expected that any development will utilise web-based technologies as the market leading packages offer web publishing capabilities. The ability to communicate process models over the Internet or Corporate Intranet has become increasingly necessary due to the national and often international nature of modem business (Aris, 2002).
as a major point of reference. It will also be important to incorporate the lessons learnt about the presentation techniques obtained through the research conducted.
Once a solution has been developed it is crucial that any new model created gives a true representation of the original model. This is not to say that every element in the new model should be kept the same, as a simplification of the original model may be required. It is important, however, that the new model does not present any inaccurate data to the end user, and that data is not corrupted through abstraction.
MPhil The Presentation of Business Process Models Chapter 2 : Literature Review
Chapter 2
Literature Review
2.1. Introduction
Through discussions with several industrial partners currently working on reorganising the way in which the manage businesses processes, it became evident that their was a reoccurring issue which was limiting the success and expansion of process modelling within these companies.
This limiting factor involved the presentation of large-scale business process models and the subsequent interpretation of these models.
With this questions in mind, an in depth literature survey was carried out, in order to establish the current thoughts in academia, current practitioners and pioneers in the field of process management, about the role of processes modelling and current best practices. The literature survey considers the following topics in the field of Process Modelling and related areas.
• Process Orientated Approach • Attributes of a Process
• The roots of Process Management • The evolution of Process Modelling • Summary of the Modelling market
• The problem of visualising complex models
2.2. Process Orientated Approach
(Davenport, 1993) describes a process as being " simply a structured measured set of activities designed to produce a specified output for a particular customer or market" Significantly, Davenport (1993) in this statement describes this set of activities as being structured, as it is this characteristic that adds value. Each activity in itself should add value to the product or service, but the correct sequencing of these activities will be of further benefit to the company.
All processes begin with an event that is typically external to the organisation, such as a request or order, which triggers a chain of activities within an organisation. After these activities have been performed by the organisation the process is ended with the delivery of a product or service.
This idea is illustrated in the following diagrams;
Process before redesign
Request Delivery
\
Figure 2.0 (Sodan, 2002)
MPhil The Presentation of Business Process Models Chapter 2 : Literature Review
In many businesses, the processes performed have simply evolved over time, creating a ‘ way of doing things round here’ approach to process management. The reorganising of these processes within a company, however, could potentially make them more competitive and more profitable, by bringing order to what was a confused system containing wasteful processes;
Process after redesign
/
V
Request — ► — ► Delivery
N,
\
Figure 2.1 (Sodan, 2002)
The benefits to a business of analysing and reordering their processes can be experienced throughout the company (Davis, 2002);
• Productivity can be raised. It is estimated that productivity typically improves initially by 30-50%.
• Customer service can be improved as the number of errors within the system and the process lead-time is reduced.
• A more efficient use of resources can be found, as wasteful processes or eliminated, freeing up staff and machines.
MPhil The Presentation of Business Process Models Chapter 2 : Literature Review
2.3. Attributes of a Process
In figure 2.1 the processes within a business are divided into individual blocks, representing a specific activity carried out within the business. If a traditional functional viewpoint were being utilised, this representation would be acceptable as a complete image of the processes within the organisation.
However with a process orientated view of their operations, this image is no longer a comprehensive representation.
A process can be viewed from a variety of different perspectives depending upon which area of the business it is viewed from, and the type of data that is required from that process. The information contained within a process can be extremely varied in order to encapsulate all areas. Professor John A. Zachman (1987) presented a framework describing the varied nature of data contained within a process, some of which are now described;
• WHAT - The specific data referring to what activities are occurring at each step within a process.
• How - The information referring to how these activities will performed. (The functions which are carried out by the company)
• W here -The information referring to the location in which this activity takes place and the relevant logistics data.
• Who - The information referring to the responsible party for that activity, whether it is a business unit or an individual.
• When - The information referring the timing of the activity, creating a schedule of events.
If the amount of data within a process is so great, and its content so varied, then the traditional functional viewpoint of a company is no longer enough. This theoretical view of business processes was seen by Curtis et al. (1992), who suggested a conceptual framework for business processes. This framework suggests that there are four perspectives of a business process.
• The functional view, which shows the activities performed within a process. It describes the functions that are being carried out by the employees. (The Zachman (1987) framework WHAT)
• The Behavioral view, this relates to when the process is being performed, and how it is being carried out. For example an activity could be going through a feedback loop or a iterative process etc. (The Zachman (1987) framework HOW and WHEN)
• The Organisational view, this shows where and by whom the activities are executed and what physical communication mechanisms and storage are used. (The Zachman (1987) framework WHERE and WHO)
• The informational view, this shows the information details or entities that are being manipulated by the process. In this view both the data structure and its relationships are considered.
MPhil The Presentation of Business Process Models Chapter 2 : Literature Review
2.4. The roots of Process Management
/
From outset of this chapter the importance of process within modem business has been established. However, the idea of reengineering business processes is far from a modernistic concept. In fact the Reengineering of processes can trace its origins back to management theories developed as early as the nineteenth century.
Frederick Taylor (1885) suggested in the 1880's that managers use process reengineering methods to discover the best processes for performing work, and that these processes be reengineered to optimize productivity. He described the purpose of reengineering as;
"making all your processes the best-in-class."
A short time after this in the early 1900's, Henri Fayol (1949) originated the concept of reengineering as; “To conduct the undertaking toward its objectives by seeking to derive optimum advantage from all available resources”.
Although at this time the level of technology was not there to support these early concepts, people were appreciating how important it was to plan their processes.
Nearly 100 years on, at the beginning of the 1990’s, companies were being presented with new economic, legislative and particularly competitive challenges, which were making them think about how efficient their processes were.
It was around this time that the term Business Process Reengineering (BPR) came into being.
It was around this time in the early 1990's when Michael Hammer and James Champy (1993) published their best-selling book, "Reengineering the Corporation", and BPR really reached its peak. The authors described BPR as;
Their ideas would radically redesign and reorganise the processes within a company “wiping the slate clean” as they put it. They believed that this was necessary to lower costs and increase quality of service.
In order to achieve these goals, they suggested seven principles of reengineering:
1.To organise around outcomes, not tasks.
2. To identify all the processes in an organisation and prioritize them in order of redesign urgency.
3. To integrate information processing work into the real work that produces the information.
4. Treat geographically dispersed resources as though they were centralised. 5. Link parallel activities in the workflow instead of just integrating their results.
6. Put the decision point where the work is performed, and build control into the process. 7. Capture information once and at the source.
A key theme that came out of these principles was the importance of identifying and capturing information in some way.
Other visionaries in the BPR world also recognised that acquiring a clear definition of the ‘as-is’ business process, and then developing an understanding about how the process may be re-engineered, is a crucial stage in any BPR project (Fitzgerald 1994, Bevilacqua
1992, Davenport 1990, Carr 1995).
MPhil The Presentation of Business Process Models Chapter 2 : Literature Review
2.5. The evolution of Process Modelling
Process modelling is a vital step within BPR. Although new software packages have extended the capabilities of processes modelling, the capture and documentation of company processes is still regarded as the first and most important step in the BPR activity.
Dr. Jay Bal (2002) in his paper “Process Analysis Tools for Process Improvement” states that the early modelling stage has three major goals;
• To achieve a full understanding of the process to be re-engineered, so as to clarify its objectives and characteristics.
• To create a shared vision and understanding among the re-engineering team. • To have a basis for starting the redesign.
Since the creation of Process modelling, a variety of modelling techniques have been developed to support the process, some of which have become established industry standards.
As IT systems became more powerful and software became cheaper, more and more computer based modelling packages came onto the market. These tools offered increasingly sophisticated database, visulisation and analysis capabilities, and often incorporated allot of the established modelling techniques.
Established Techniques
Software Tools
4 Keeps Popkin
IDEF ProcessMaker ProcessWeaver PACE Design
IDEF CORE
Petri-Net RAD
[image:26.615.50.460.502.621.2]2.5.1 Established Modelling Techniques
Over the past twenty years a great number of modelling techniques have been developed through academia and by software vendors. Many of these techniques were designed to meet a specific problem and their limited scope meant that they were never adopted as industry standards.
IDEF Bachman
Petri-net (CPN) Gantt
Yourdon (DFD) Object Oriented
UML Soft Systems
Booch Meta Modelling
Rumbaugh Row Chart
Shlaer-Mellor ABC
Coad/Y ourdon RAD
Martin Workflow
Chen Simulation
SSADM
Table 2.3: Established Modelling Techniques, (Hommes, 2003)
Dr Jay Bal (2002) discuses that there are many tools available for use in process modelling, however, he also suggests that there are currently just a handful of techniques in favor and subsequently incorporated into software tools.
This idea is supported by a survey conducted by DISA (1995), which concluded that IDEF modelling was found to be the most frequently used technique, with 37.4% of all organisations using them in some form. The survey also showed that only a small number of modelling techniques were used by the majority of organisations.
MPhil The Presentation o f Business Process Models Chapter 2 : Literature Review
2.5.2 IDEF Models
The first technique identified is the IDEF family of modelling methods. This has probably become the most widely adopted industry standard, with many of the current market leading software packages adhering to the IDEF basic principles.
IDEF was founded in the mid-1970’s as a direct consequence of the American Air Force’s need to improve their manufacturing operations. As a result of this need the Integrated Computer-Aided Manufacturing (ICAM) program was established. One of the main problems the new program faced was the requirement to model processes, data, and dynamic (behavioral) elements of their manufacturing operations.
IDEF is often referred to as a family of modelling standards, as it comprises of a number of different modelling techniques (all very similar) which together encompass the entire organisation.
IDEF
Standard
Function Performed
IDEFO Function Modeling
IDEF1 Information Modeling
IDEF1X Data Modeling
IDEF2 Simulation Model Design
IDEF3 Process Description Capture
IDEF4 Object-Oriented Design
IDEF5 Ontology Description Capture
IDEF6 Design Rationale Capture
IDEF8 User Interface Modeling
IDEF9 Scenario-Driven IS Design
IDEF10 Implementation Architecture Modeling
IDEF11 Information Artifact Modeling
IDEF12 Organization Modeling
IDEF13 Three Schema Mapping Design
[image:29.616.70.453.137.398.2]IDEF14 Network Design
Table 2.4: IDEF modelling family.
Table 2.4 shows the complete list of IDEF modelling standards. Some of these standards are more relevant than others, when looking at process modelling. For process capture and analysis the key techniques are:
IDEFO
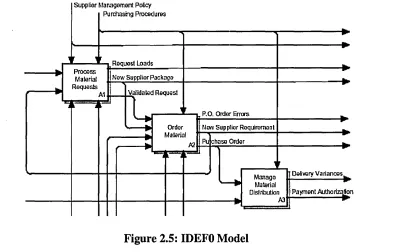
The IDEFO is one of the most widely used tools for functional modelling. It uses a “top- down” hierarchical method of modelling, which provides a description of functions and processes originally designed for the manufacturing industry.
MPhil The Presentation of Business Process Models Chapter 2 : Literature Review
The hierarchical technique used allows the processes in the diagrams to be further decomposed to show lower-level activities. This break down makes IDEFO a very suitable tool for the visualisation of complex and often large scale manufacturing systems. IDEFO is commonly used to show complex systems as it provides a structured representation of the functions, information and objects which are interrelated in a manufacturing system (Kusiak et al 1994).
Supplier Management Policy Purchasing Procedures
1 r
New Supplier Package
Validated Request
P.O. Order Errors New Supplier Requirement
chase Order
Payment Authorization Process
Material Requests
Request Loads
Manage Material
[image:30.617.73.467.205.457.2]Distribution
Figure 2.5: IDEFO Model
IDEF1
The IDEF 1 technique is used for information modeling. The main aim of this is to capture the conceptual views of an enterprise's information. This means that all the information needs of an organisation can be captured, communicated and analysed.
The basic building blocks of an IDEF1 model are entities, attributes and relationships. The entities are represented by boxes, in which are entered the characteristics of the entity. Lines and diamonds represent the relationship that exists between these entities (the nature of the relationship is entered in the diamond).
The benefits of using such a model are that it provides a stable structure with which to control the “constantly changing requirements of manufacturing information” Dr. Jay Bal
(2002).
IDEFlx
IDEFlx was created as an extension of the IDEF1 model. It is used for data modeling, as it captures the logical view of the company’s data. It is considered as an extension of the IDEF1 model as it can be used to design a database of information, once the information system requirements are known (obtained from the IDEF1 model).
It is a commonly used technique, as it has a better graphical representation than the IDEF1 model as well as being easier to understand due to the greater depth of information that it stores.
IDEF3
The most significant modelling technique concerning business process modelling, was the creation of IDEF3 diagrams. These models were specifically created to show a sequence of activities that are carried out by an organisation. It is particularly useful as it allows experts who operate within a process, to document their intrinsic knowledge of that particular process. It differs from the other IDEF models previously described, as it captures the description of what a system actually does.
The most important part of the IDEF3 model from a process modelling perspective, is the process flow description.
MPhil The Presentation of Business Process Models Chapter 2 : Literature Review
• Precedence links - which show the sequence of the activities.
• Relational links - this shows the existence of some sort of relationship between two activities.
• Object flow links - shows the participation of an object between two units of behavior instances.
2.5.3 Role Activity Diagrams (RAD)
Although IDEF in particular became a very successful method of modelling, there was an opinion that the IDEFO and IDEF1X models did not capture the behavioral aspects of a
business process in sufficient detail (The Zachman framework 1987, The Behavioural
view). As a consequence of this Role Activity Diagrams or RAD’s were created, in order to support the IDEF models.
When used in combination RAD’s and IDEF models can be used to create a complete picture of the organisation. The high-level and cross-functional view of a process, which the IDEF model provides, is supported by the more in depth image of the RAD, which shows the interaction between individual activities.
Unlike an IDEF model a RAD shows the dynamics of a processes, and are more concerned with the people within an organisation. It portrays an individuals role, what activities make up this role and their interactions, together with external events and the logic which determines the sequence of the activities (Ould, 1995).
Customer
Found H ou§^a
Local'! Advisor
Customer
is in a state
of waiting
for a
response
i
- o-o-Advising
-a - R ecom m ends
com plete
^
Lending
Forms I
- D
O--O
Sen d s Forms
a- Property Credit
Check Check
Property Q Search I
O----— L
D ecide O
o
eg L C tec
&
Credit A gency Activity [image:33.617.56.453.394.713.2]N
MPhil The Presentation of Business Process Models Chapter 2 : Literature Review
2.5.4 Petri - Net Models
Petri - Net Models are a graphical tool like IDEF and RAD’s in that they use flow charts and block diagrams to represent procedures, processes and machines within an organisation.
From diagram 2.7 it can be seen that they consist of places (circles), transitions
(rectangles), and arcs that connect them. Input arcs connect places with transitions, while
output arcs start at a transition and end at a place.
a place ■with
two tokens a transition
(exponential)
a transition
(immediate)
input arc
multiplicity 2
a transition
(deterministic)
Figure 2.7: Petri - Net Model
2.6 Software Tools
By utilising one or combining a variety of the modelling techniques, described in the previous section, it is possible to capture process data, sequences and even the behavioral aspects of an organisation. However, if Dr. Jay Bal’s (2002) major modelling goals are revisited;
• To achieve a full understanding of the process to be re-engineered, so as to clarify its objectives and characteristics.
• To create a shared vision and understanding among the re-engineering team.
It is impossible to say that these targets have been achieved through any individual modelling technique.
A primary objective of any business process model must be to communicate, therefore a model must be visual and the visual representation must be easy to understand with little explanation.
MPhil The Presentation o f Business Process Models Chapter 2 : Literature Review
As a result of this, and the increasing capabilities of computer software, a whole range of modelling tools have appeared in the modelling market. The tools themselves vary in sophistication, but can be loosely categorised under two headings;
1. The static modelling, based on diagrammatic modelling techniques, which provide a qualitative description of the existing or envisaged process. In static modelling the focus is on describing processes and the resources required to execute them.
2. The dynamic modelling, based on discrete-event simulation, results in a quantitative model which can be used to gather performance statistics. In dynamic modelling, the focus is on evaluating the dynamic performance of a process throughout a specified period of time.
The categorisation of software tools can be further broken down to represent the diverse range of capabilities available.
Static Modelling
Software Tools
Dynamic Modelling
Object modelling and repository
based Tools
Simulation Tools Flowcharting or
Diagramming Tools
Hybrid Tools
2.6.1 Static Modelling
The development of the process modelling market has been rapid, creating a broad spectrum of package capabilities, and as a consequence the customer has been left confused. The market is cluttered with bespoke packages offering sophisticated tools for a specific market, and at the other end of the spectrum simple drawing packages have been marketed as a real solution to process modelling problems.
The least complex form of modelling are the diagramming or simple flowcharting tools that provide the basic functionality required to portray a process as a picture. Law and Kelton (1991) defined a static model as “...a representation of a system at a particular time, or one that may be used to represent a system in which time simply plays no role”. This is fundamentally what a flowcharting tool is used for.
These tools often come with templates that contain pre-created icons and images that are easily recognisble to everyday business use. It is important to say at this point however that a simple process diagram does not, on its own, constitute as a business model. For some modelling packages on the market this would represent the limitation of their usefulness, and so can not in truth be called a business process-modelling tool.
2.6.1.1 Flowcharting or Diagramming Tools
It is often said that a picture is worth a thousand words, in processes modelling this statement is true, as the diagram itself simplifies large and complex processes into easy to follow steps.
A simple flowcharting tool shows a basic representation of a real life business situation, abstracting from this situation the aspects of interest. The abstraction process is a
MPhil The Presentation of Business Process Models Chapter 2 : Literature Review
As an abstraction of the real process, it is true to say that the models are incomplete and even inaccurate, this does not however limit their usefulness. The reduction of
complexity through abstraction allows a greater understanding that might otherwise have been gained.
Flowcharting tools have one major advantage in that they are easily understood by almost everyone within the organisation. They fulfill their role by capturing the most important features of a process, such as where decisions are made, and then presenting this information in a way that is recognisable to all users.
The reason that these basic flow charts are so easy to understand is that they often utilise widely known standard symbols. Many of the market leading packages utilise the American National Standards Institute (ANSI) standard flowchart symbols.
At their most basic, all flowcharts consist of shapes (usually showing the activities), lines (the flow) and text (a description of the activity). Most of the tools in this sector support these basics. It is not strictly necessary to use boxes, circles, diamonds or other such symbols to construct a flowchart, but these do help to describe the types of events in the chart more clearly.
2.6.1.2 Object modelling and repository based Tools
To fulfill Law and Kelton’s (1991) definition of a static model, a modelling tool must do more than capture the simple actions and decisions. They must store the information about a system at any particular point.
True modelling tools often include the ability of mapping. Mapping tools extend the functionality of drawing tools by including spread-sheeting functions that allow the entry of basic data and often-simple calculations.
These tools often include methods to validate the structure of the diagrams being produced and have the ability to search and report on the data being stored.
What truly makes modelling software such a useful tool is the inclusion of some sort of storage facility. Modelling tools are often referred to as object and repository based. This refers to the ability to store data related to the objects that form the process being modelled. Using a database at the core of the software means that the data can be manipulated, searched and reported on to meet the users requirements. Some tools have a fixed database structure whilst others allow a degree of customisation of the structure. Usually the tools that allow the user to customise the structure through the creation of further objects provide extended analytical capabilities and so prove to be more flexible.
These three key features make up the basis of a business process modelling tool. 1. Produce diagrams that capture and simplify business processes.
2. Mapping tools to allow basic data capture. 3. Built around some sort of database.
In short, business-modelling packages are a database of business information captured and presented in a structured way.
MPhil The Presentation of Business Process Models Chapter 2 : Literature Review
activities and resources of an organisation. The object model can then be used to identify the specifics of the organisation, such as process relationships and dependencies.
2.6.2 Dynamic Modelling - simulation tools
Banks (1999) described a dynamic model as follows44....simulation models represent systems as they change over time.” He went on to give on example of this definition, by using a bank, which opens at 9am and closes at 4:30pm. During this time period the system itself changes, dynamic calculations have to be run with data that reflects the changes over time. This type of model gives a truer representation of a system as it can include dynamic events such as waiting times, machine breakdowns and the changes in utilization over time.
Compared to static modelling, tools that use dynamic simulation are relatively new, and their use limited to specilised projects carried out by simulation experts. In the past there they have mainly been used as a tool to help management to justify major capital investments, particularly in the manufacturing industry.
There are a limited number of companies using this technology, particularly in this country, despite the evidence of major cost savings, the technique is viewed as a specialist and expensive activity.
At present the vendors of simulation tools are trying to produce products which are easier to use and can be beneficial to a variety of industries. Recently their efforts have been successful with an increasing number of users, however the tools still tend to be used for one off projects and not on a day to day basis.
2.6.2.1 Hybrid Tools
Some of the market leaders in the static process modelling sector have recently started to appreciate the benefits that a dynamic tool can offer.
All though a customer may not wish to have a dedicated simulation tool, they would like some of the capabilities that they offer.
A limitation of the static tools is that they cannot be used to predict the dynamic performance of a process. It is therefore difficult to establish business performance data against which future performance can be measured.
The solution would be to link the static model created by the organisation to the quantitative facilities of a dynamic model. This would allow the company to investigate dynamics within the organisation such as process time, utilisation of resources and costs.
There are two ways in which this new hybrid tool can be seen in current packages.
Firstly there is the in built tool, which consists of the static model tool with a more restricted version of the simulation system in built. The simulation capabilities are often very limited within these packages, however they do not suffer from inflated prices.
The other option is to create a static model that has the capabilities of interfacing with another simulation tool. The advantage of such a system is that you have all the capabilities of a dedicated simulation tool, however you do have to pay for both products.
These systems are intended to provide a complete answer for modelling business processes. The qualitative features of a business are modelled using the static tool, and the quantitative features can then be investigated using the simulation tools.
MPhil The Presentation of Business Process Models Chapter 2 : Literature Review
The future of modelling will probably lie in this integration between static and dynamic tools, but until the link between them is completely seamless, companies will have to assess the benefits and drawbacks of each approach.
2.7 Summary of the modelling Market
Various authors have tried to categories the modelling market into structured groups. However, most like Hutton (2002) have warned that the packages often do not sit well in one category. They are often designed for a specialist purpose, which means that they can adopt the characteristics of various tools. Also the market is constantly changing, with some of the larger software vendors releasing add on software to increase the capabilities of a tool.
The easiest way to visualise the market at the moment can be seen in the following diagram. However it is important to keep in mind that the lines which separate the categories are somewhat undefined.
Sophisticated Simple RADitor ActianWorkflow Analyst Process Wise WorkBench Optima! -Process--Charter Process Modeler Visio ABC SES Workbench SPARKS ARENA W itness ReThink FirstSTEP Process Wise WorkBench Extend+BPR POWERSII/I i-think VenSim Optima! GRADE CASEwise Process Charter MooD GRADE WorkflowBPR Enterprise Modeler ARI5 BPA CASEwise BDF ProSim Work Draw TOP-IX Design/IDEF
Q Lie sheet
ProcessW ise
[image:42.617.55.381.344.648.2]The usage of these tools is not spread evenly across the categories. Hutton (2002) states that “As a general rule the simpler the user interface and underlying methodology used by the tool, the more accessible the product is to a wider audience.”
This is certainly true of the market at present, with most companies utilising a popular diagramming tool like Microsoft Visio. This type of tool is widely accepted as the models are generated easily, and the symbols that are used can be manipulated and modified to suite the user’s purpose.
For many people the ease of use, and understanding of these tools, together with the fact that they are often used on familiar platforms, makes them a reasonable option. So why should companies spend more money on a package with increasing complexity?
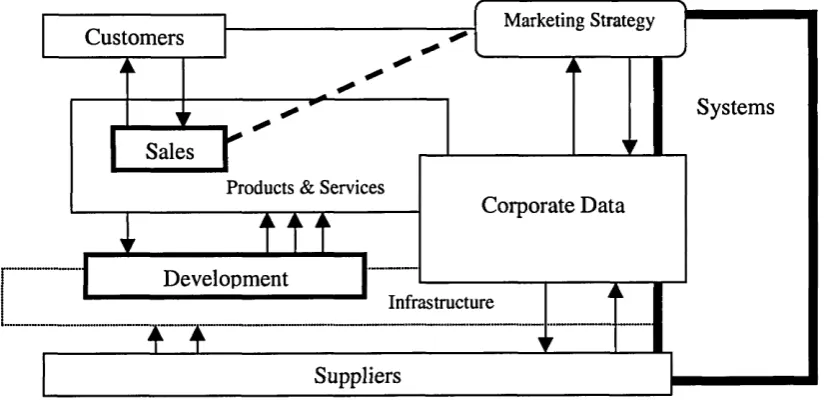
Rob Davis (2001 p27), uses a typical business model, created with a diagramming tool as an example, to answer this question.
Systems
Products & Services
Infrastructure
Sales
Customers Marketing Strategy
Development
Suppliers
[image:43.615.48.461.300.500.2]Corporate Data
Figure 2.10: Typical business model.
MPhil The Presentation o f Business Process Models Chapter 2 : Literature Review
The characteristic, which separates a simple diagram from a model, is that the model is built around a method. Therefore each building block, connecting line and label is used in a constructive and pre-conceived manor. This standardisation of the model format means that once the methodolgy has been learnt, the models can be understood by anyone within the organisation with little explanation.
The repository system that is used also means that the building blocks of the model can be stored and reused within other models. This means that different viewpoints of the organisation can be generated. Another benefit of the repository system is that all knowledge and data within an organisation can be stored in one place. This database can then be queried in order to gather information, such as who is responsible for a particular task.
The advantages of a repository system are not just theoretical, examples can be found in industry of the success of the modelling system over a simple drawing package.
Thomas R.Gulledge (1999) commented after using a modelling package for use in the U.S Navy ERP pilot program, “You cannot maintain business process configuration in a drawing tool. Business process objects are shared across business processes. A change in one object is often reflected in many places. Drawing tools are used when there is no requirement to manage over time”.
The advantages of a process-modelling package can be summarised as follows:
• Encourages standardisation - by enforcing a method. • Improves quality and rigor of process design.
• Provides a single, consistent record through a single repository.
• Encourages the use of a common, well-understood, process vocabulary. • Allows multiple viewpoints.
2.8 The problem of visualising complex models.
The majority of the literature available on business modelling supports the implementation of a sophisticated repository system to capture the nature of a business in its completeness. The evidence in industry would also support this theory as many companies have had great successes using this type of method.
The majority of the case studies and product reports, however, are far from independent publications. The literature available is largely made up of biased product promotions and case studies published in collaboration with the software vendors.
After discussing the day to day use of one such product with an industrial partner, it became evident that there were problems surrounding the complexity of the methodology.
BT are a large organisation with over 100,000 employees, which in turn means that the effective design and management of the internal business process is crucial to the success of the organisation. The company decided that since a period of restructuring in 1999, the company was in need of a single tool to model the existing and emerging business processes. After a substantial evaluation and selection process, the modelling tool Aris would be used as the sole product for the task.
After some time it was decided by the company, not to mandate the use of the tool, as this forced change might create resentment of the new tool. Instead they decided to champion the tool in a pilot project, there by convincing other business units through example. In order to do this the ARIS Modelling Techniques Team was created, to be a dedicated group of experts trained in the ARIS methodology.
MPhil The Presentation of Business Process Models Chapter 2 : Literature Review
People without the formal training on the tool could not understand the complex methodology and the detailed diagrams, which were often several pages long. They did not like the rigidity of the tool, the rules that had to be followed and the unappealing uniformity of the diagrams.
The problem was not only internal. Btexact were publishing all of their process models for external customers in the ARIS format, and many of the same problems were being raised. Several clients inquired if they might have their diagrams published using a package they were used to.
It became evident that this was not an isolated problem and that many other companies had discovered that ARIS was only successful if it was implemented on a corporate scale, involving a comprehensive training scheme. The problem being if training had not been provided, the diagrams would prove too specialised leading to confusion about a process.
Davide Ruozi (2001) who used the ARIS suite to re-engineer a product development process for a mixing plant highlighted this problem. In his final comments about using the package he states; “we can observe that the ARIS Toolset permits to produce a more complete representation of the process using several models, but these ones are more difficult to read and understand”.
Chapter 3
Benchmarking Study
3.1 Introduction
Within the previous chapter, several questions were raised about the complexity and the subsequent functionality of modem business modelling packages.
In order to answer some of these query’s, further investigation about the use of such packages is required.
It was therefore decided that a benchmarking study of a select handful of modelling packages should be carried out.
3.2 The benchmarking Process
The practice of benchmarking is typically associated with the measurement of business performance, through comparison with the best in class. Although the process is generally used on a business unit or corporate scale, it can be a very effective device for the comparison of business tools.
MPhil The Presentation of Business Process Models Chapter 3: Benchmarking Study
There are four main approaches to benchmarking currently being utilised in industry today (M.Zairi 2001).
• Internal benchmarking - A way of establishing good practice within an organisation by comparing the various operations that take place on a company wide scale.
• Competitive benchmarking - This is the comparison of a specific product or service with its main competitors, by looking at a product/services characteristics or functionality.
• Generic benchmarking - This is the comparison of all functions within a business operation. This is achieved by comparing all functions and processes with those best in class.
• Functional benchmarking - This is the comparison of specific functions with the best in industry and best in class. It is a more focussed approach to benchmarking and does not have the scope of generic benchmarking.
It is the competitive approach to benchmarking that will be applicable for the comparison of process modelling tools. By comparing the characteristics and functionality of the best in class tools, any functional gaps between the packages should be become evident.
After a successful competitive benchmarking study Xerox (2001) published their approach to benchmarking. The early planning and analysis stages of this study will form the basis for the authors benchmarking study.
1. Identify what is to be benchmarked 2. Identify comparative companies 3. Determine a method for data collection 4. Collection of data
5. Discussion of results.
3.3 Identify what is to be benchmarked
There have been a number of independent reports carried out, focussing on the modelling software market. Most notably the industry recognised Gartner (1997) report and the commercially available Sodan (2002) report. These reports help potential users, by giving general information about a tools specific market, key features and customer support.
The questions that have been raised in this report, however, require a more detailed observation at a specific aspect of a modelling package.
MPhil The Presentation of Business Process Models Chapter 3: Benchmarking Study
Benchmarking and assessment criteria Main categories
Model Methodology - This has two main areas of interest, the underpinning methodology used by the package as well as the rules and restrictions governing the creation of the models. This is an important category as it establishes which of the packages utilises the complex methodologies that can either add value to a tool or can make it confusing. If there were a methodology present it would also be useful to see what procedures are present to validate the model, so that consistency is maintained.
Model & Data M anagement - This area is primarily about with the way in which data is stored. If a package uses a complex repository system, how is that data maintained and then presented to the user.
Presenting data - This important section is concerned with the way in which data is presented to the user. This includes the page layout, standards conformed to, navigation techniques and filtering methods.
Shapes & Lines - To allow the manipulation of graphics it is important to equip the user with powerful manipulation functions. This section takes a detailed look at the building blocks of the diagram and the methods used to simplify the complexity of the models.
3.4 Benchmarking the aspects of model visualisation
Model Criteria Exnlanation
Model Methodology
Is a methodology utilised Recognises the degree to which a methodology is utilised
by the package. A sophisticated and well-planned methodology can add value to a package by promoting rigor to the modelling process.
Is this methodology unique to the
package The methodologies are either unique to the package or based upon an industry standard. If they are unique the models will be difficult for the untrained user to understand.
Is it clear to understand As a follow up to the previous question, would the
presence of such a methodology course problems to the user?
Does it add value to the product It is commonly accepted that the complex methodology
packages are superior to simple diagramming tools. But to what degree does the methodology add value to the tool.
Are there rules to building the
diagrams This measures the degree to which rules govern the creation of a model.
Are they clear to understand If there are rules, this measures their clarity.
Do they add value to the product In many cases the complexity of the rules acts to the
detriment of the tool. Are there syntax and semantics
checks for verification If there are strict rules governing the tool, are there measures present to maintain consistency.
Is freeform used The alternative to methodical modelling is the use of
freeform. Models can be improved or further abstracted according to the desired perspective of the user if they are not restricted by a methodology.
Is the tool oriented towards a
strategic method A tool will often lean towards a certain view of the organisation. Often multiple views are supported. This question aims to find the degree to which the strategic method is used.
Is the tool oriented towards a
process method This question aims to find the degree to which the process method is used.
MPhil The Presentation of Business Process Models Chapter 3: Benchmarking Study
Is the tool oriented towards a data
method This question aims to find the degree to which the data method is used.
Is the tool oriented towards an
object oriented method This question aims to find the degree to which the object oriented method is used.
Navigation techniques Multiple page set-up - off-page
connectors This is important because most models are not conveniently fitted onto one page. The ability to have off-page connectors that help you navigate from a point on one page to a point on another page helps when trying to visualise a model.
Shape numbering In large, complex models, finding a particular shape can
be problem. Being able to uniquely identify a particular shape can help with the tracking of a process. Not all tools support this type of automated shape-numbering. Instead, they allow the user to enter a number as part of a text field. This however means that there is no unique way to identify that shape. This causes problems when trying to sort and select information by shape number. Active Navigation around the
diagram The scale of complex business models can often leave the user lost within the diagram. Active navigation tools allow the user freedom to move around the diagram.
Links to charts and files Many of today's flowcharting software packages will
allow you to create a link between a shape or line on the flowchart and the supporting documentation.
Model & Data Management
Is a repository system used This measures the degree to which the tool is structured
around a repository or central database system.
Simple storage or active This measures the complexity of the storage system
being used.
Data fields Simple or Detailed This measures how detailed the information within the data fields can be.
Database clean up present This is a method of measuring database consistency and
accuracy. Database clean up procedures, remove old and invalid objects._______
Presenting data
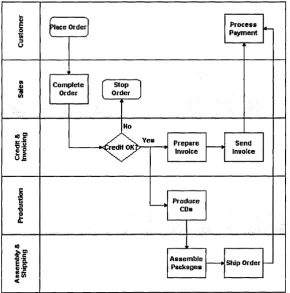
Vertical layout Each tool will have a preferred layout, which is the way
in which the objects are arranged on the page. The vertical layout follows the process from top to bottom of the page with departmental responsibilities being added where appropriate. This question measures the degree to which the package utilises this layout.
Horizontal layout The horizontal layout follows the process from left to
right of the page with departmental responsibilities being added where appropriate. This question measures the degree to which the package utilises this layout.
Swimlane layout The swimlane layout can use either the vertical or
horizontal methods. The difference being each
department, e.g. manufacturing and HR is sectioned off on the diagram, and the process flows between these sections.
Is a filtering system used A method filter enables the user to restrict the data
available on the model according to the amount of detail they wish to share. The data is still within the tool but the visibility of certain objects and data sources can be restricted. This question aims to measure the degree to which a method filter is used by the tool.
Does it aid understanding This measures the degree to which the method filter aids
the understanding of a model.
Are explorer concepts used Explorer concepts are a method of storing, accessing,
sorting, and selecting models and objects in a tree structure. This measures the degree to which this application is used by the package.
Are UML Diagrams used As discussed earlier, many tools are built upon industry
standards. This measures the degree to which the model is built upon UML diagrams.
Are Event driven process chain
Diagrams used This measures the degree to which the model is built upon Event driven process chain diagrams.
Are IDEF Diagrams used This measures the degree to which the model is built
MPhil The Presentation of Business Process Models Chapter 3: Benchmarking Study
Are Petri-net Diagrams used This measures the degree to which the model is built
upon Petri-net diagrams.
Shapes & Lines
Are ANSI standards used As previously discussed ANSI standards are a
recognisable group of shapes, used by many modelling tools. This measures the degree to which these standards are utilised.
Are the shapes linked to the
methodology This measures the degree to which the shapes used in the model are linked to the methodology adopted by the tool.
Can the shapes be formatted to aid
understanding This measures the flexibility of the tool by allowing the model shapes to be formatted.
Automatic line routing Documenting complex process flows can quickly lead to
the "spaghetti diagram" effect. This is the effect you get when there are so many overlapping shapes and lines that you can no longer decipher the intended process flow. Fortunately, the addition of several clever capabilities in today's advanced flowcharting software can help ease this trouble. A program's automatic line-routing capability can mean different things depending on the vendor.
collision avoidance Collision avoidance simply means that shapes cannot be
positioned over other shapes, and shapes cannot be placed over lines so as to obscure the intended meaning of the flow path. If a user attempts to place one shape over another, the software automatically displaces them for clarity. Likewise, when the user places a shape over an existing flow line, the program automatically re-routes the line to accommodate the positioning of the new shape.
auto line crossovers Auto line crossovers show line-path intersections. This is
Do the lines show processes flow The lines within a model can have several different meanings. This question queries whether the lines represent the flow of process within the company. Are the lines dependent on
responses YES/NO This question queries whether the flow of the process is dependent upon YES/NO responses.
Freedom to change colour of an
object This measures the ability to change the colours of the objects within the diagram, without effected the understanding of the system.
Freedom to change shape of an
object This measures the ability to change the shape of the objects within the diagram, without effected the understanding of the system.
Freedom to change the size of an
object This measures the ability to change the size of the objects within the diagram, without effected the understanding of the system.
Freedom to show external objects This measures the ability to show the external objects within the system, without effected the clarity of the diagram.
Freedom to change fonts This measures the ability to change the fonts used within
the diagram, without effected the understanding of the system.
Freedom to show attributes This measures the ability to show the attributes of an
object on the diagram, without confusing the overall model.
3.5 Identify comparative companies
The selection of the packages for evaluation is not a simple task. As discussed previously the market is littered with bespoke packages offering sophisticated tools for a specific market, and at the other end of the market, simple drawing packages being marketed as a real solution to process modelling problems.
In order to gain a broad-spectrum five business process-modelling packages will be selected for evaluation, focussing on their capabilities, limitations and most importantly the way in which they present data to the user.
MPhil The Presentation of Business Process Models Chapter 3: Benchmarking Study
This then leaves the more generalised or ‘complete’ packages. Included in this group are the sophisticated repository based packages as well as some of the simple diagramming to