FORMULATION, DEVELOPMENT & EVALUATION OF NOVEL
SUSTAINED RELEASE ORODISPERSIBLE TABLETS OF
ROPINIROLE HCL BY SPRAY DRYING TECHNIQUE
Mahale Nitin B 1*, Bankar Sandip K1, Chaudhari Abhishek V1, Battase Anil P2, Chaudhari Sanjay R1
1
Amrutvahini College of Pharmacy, Sangamner-422608, Dist: Ahmednagar, Maharashtra,
India.
2
Govinrao Nikam College of Pharmacy, Sawarde-415606, Tal Chiplun,
Dist: Ratnagiri, Maharashtra, India.
ABSTRACT
Ropinirole HCl, a dopamine agonist used in the Paarkinsonism in
reatless legs syndrome (RLS) is a highly water soluble drug (133
mg/ml).It is generally generally available as a conventional solid oral
dosage form which is a major problem for the patients undergoing the
dopamine therapy. The Parkinsonism patients taking Ropinirole HCl
conventional tablet cannot swallow the dosage form due to reduced
muscular activity, unavailability of water, dryness of mouth and
dysphagia. The frequency of administration of this dosage form is
minimum thrice a day due to lower dose (upto 8 mg) and shorter half
life (5 hrs), so the problem arises in the number of doses. To overcome
both these problems the sustained release orodispersible tablet dosage
form of Ropinirole HCl is developed which will deliver the drug over a longer period of time.
Microspheres of Ropinirole HCl were prepared by spray drying technique using the
combination of hydrophilic and lipophillic polymers i.e. HPMC-K1M and Eudragit RL100 &
Eudragit RS100 in drug:polymer ratio 1:9.The ODTs were prepared by direct compression of
mixture containing microspheres formula F12 using crospovidone as a superdisintegrants,
lactose and sodium saccharine as a sweetener. The novel formulation of SR-ODT of
Ropinirole HCl (F12) showed acceptable hardness (3.3 Kp), friability (0.84 %) and
disintegration time (26 sec).The microsphere of Ropinirole HCl showed an increasing trend
of entrapment efficiency and in-vitro drug release. The in vitro drug release study suggests
Volume 3, Issue 4, 1353-1383. Research Article ISSN 2277 – 7105
Article Received on 05 May 2014, Revised on 01 June 2014,
Accepted on 25 Jun 2014
*Correspondence for Author
Mahale Nitin
Amrutvahini College of
Pharmacy, Sangamner-422608,
Dist: Ahmednagar,
the sustained release of drug despite being highly water soluble.Scanning electron
microscopy, differential scanning calorimetry and FT-IR study of the drug and formulation
was carried out.
KEY WORDS: Parkinsonism, Restless legs syndrome, microspheres, spray drying, orodispersible tablet.
INTRODUCTION (1, 2)
Despite tremendous advancements in drug delivery, the oral route remains the perfect route
for the administration of therapeutic agents because of low cost of therapy, ease of
administration, accurate dosage, self‐medication, pain avoidance, versatility, leading to high
levels of patient compliance. Tablets and capsules are the most popular dosage forms. But
due to impaired swallowing ability, unavailability of water during travelling, dryness of
mouth, many elderly patients find it difficult to take some conventional dosage forms such as
tablets, capsules, and powders.This is seen to afflict nearly 35% of the general population.
This disorder is also associated with a number of conditions like Parkinsonism (26). In order to solve this problem and improve patient acceptance and compliance, the development of solid
dosage forms that disintegrate rapidly or dissolve even when taken orally without water is
being taken. Oral fast-disintegrating dosage forms (tablet or a capsule) are a relatively novel
dosage technology that involves the rapid disintegration or dissolution of the dosage form
into a solution or suspension in the mouth without the need for water.
Orally Disintegrating Tablet (ODT) (3, 4)
In 1998, the Centre of Drug Evaluation and Research (CDER) Nomenclature Standards
Committee defined an orally disintegrating tablet (ODT) as ‘‘a solid dosage form containing
medicinal substances which disintegrates rapidly, usually within a matter of seconds, when
placed upon the tongue’’ (US Food and Drug Administration). The European Pharmacopoeia
defined orodispersible tablets as ‘‘uncoated tablets intended to be placed in the mouth where they disperse rapidly before being swallowed’’ (Council of Europe 2002). It is worth
mentioning that to date; the United States Pharmacopoeia does not have a published
definition for ODTs. Simply,it is a tablet that disintegrates and dissolves rapidly in the saliva,
within a few seconds without the need of drinking water or chewing. A mouth dissolving
Ideal Properties of ODT (4, 5)
An orally disintegrating tablet should
a. Not require water or other liquid to swallow.
b. Easily dissolve or disintegrate in saliva within a few seconds.
c. Have a pleasing taste.
d. Leave negligible or no residue in the mouth whenadministered.
Advantages of ODT (4, 5)
1. No need of water to swallow the tablet.
2. Can be easily administered to pediatric, elderly and mentallydisabled patients.
3. Free of risk of suffocation due to physical obstruction whenswallowed, thus offering
improved safety.
4. Suitable for sustained/controlled release actives.
Limitations of ODT (4, 5)
1. The tablets usually have insufficient mechanical strength. Hence, careful handling is
required.
2. The tablets may leave unpleasant taste and/or grittiness in mouth if not
formulatedproperly.
3. Fast dissolving tablet is hygroscopic in nature so must be keep in dry place.
Techniques used in the preparation of orally disintegrating tablets (6, 7)
Some of the new advanced technologies which are commonly being used in last few decades
are summarized as:-
1. Freeze drying/Lyophilization
2. Molding
3. Direct Compression
4. Cotton Candy Process
5. Spray Drying
6. Sublimation
7. Mass Extrusion
Despite of successes of ODT formulations, there are currently no formulations that can
deliver an API in a sustained manner, e.g., delivery for 12 h. Preparing ODTs with
cavity, one way to attain sustained-release from ODTs is to formulate the drug into a micro
particulate system. ODT formulations with sustained release properties would bring new
benefits that were not possible before. One of the controlled release mechanisms is micro
particulate controlled drug delivery. Development of such dosage form will lead to overcome
the drawback of conventional solid orals, inconvenience of dosing frequency as well as the
problem of dysphagia in geriatrics. (27, 28)
SPRAY DRYING (8, 9, 10, 11)
Spray drying is a process by which highly porous, fine powders can be produced. It is one of
the few important processes that can be used for the preparation of the microparticles ranging
from 10-1000 µm. Spray drying is the continuous transformation of feed from a fluid state
into dried particulate form by spraying the feed into a hot drying medium.
Three types of atomizers are commercially used. They are;
1. Rotary atomizer
2. Pressure nozzle
3. Two-fluid nozzle
Fig.1 Laboratory Spray Dryer Principle
Spray drying process mainly involves five steps
(i) Concentration: Feedstock is normally concentrated prior to introduction into the spray dryer.
(iii) Droplet-air contact: In the chamber, atomized liquid is brought into contact with hot gas, resulting in the evaporation of 95% plus of the water contained in the droplets in a matter
of a few seconds.
iv) Droplet drying: Moisture evaporation takes place in two stages-
a. First stage- There is sufficient moisture in the drop to replace the liquid evaporated at the surface and evaporation takes place at a relatively constant rate.
b. Second stage- It begins when there is no longer enough moisture to maintain saturated conditions at the droplet surface, causing a dried shell to form at the surface. Evaporation
then depends on the diffusion of moisture through the shell, which is increasing in
thickness.
(v)Separation: Cyclones, bag filters, and electrostatic precipitators may be used for the final separation stage. Wet Scrubbers are often used to purify and cool the air so that it
can be released to atmosphere.
Parameters to be controlled
The pharmaceutical spray-dried products have important properties like
-Uniform Particle size,
-Nearly spherical regular particle shape,
- Excellent Flowability,
-Improved Compressibility,
-Low Bulk Density,
-Better Solubility,
-Reduced Moisture Content,
-Increased Thermal stability, and suitability for further applications.
Advantages of spray drying
1. It can be designed to virtually any capacity required. (Feed rates range from a few pounds
per hour to over 100 tons per hour).
2. The actual spray drying process is very rapid, with the major portion of evaporation
taking place in less than a few seconds.
3. Adaptable to fully automated control system that allows continuous monitoring and
recording of very large number of process variables simultaneously.
5. It has few moving parts and careful selection of various components can result in a
system having no moving parts in direct contact with the product, thereby reducing
corrosion problems.
6. It can be used with both heat-resistant and heat sensitive products.
Applications
Many pharmaceutical and biochemical products are spray dried, including antibiotics,
enzymes, vitamins, yeasts, vaccines, and plasma There are various applications of spray
drying like microparticles formulation, granulation and tabletting, aerosol formulation,
coating applications, dry emulsions and dry elixirs formulation. Spray drying technology can
also be used for the preparation of orodispersible tablets containing microspheres of active
ingredients.
SUSTAINED RELEASE OF A DRUG (7, 12)
There has been a remarkable increase in the interest in sustained release dosage form, due to
prohibitive cost of developing new drug entities, discovery of the new polymers and
improvement in efficiency and safety provided by these. SRDDS is a modified dosage form
that prolongs the therapeutic activity of the drug. Accordingly, a prodrug or analogue
modification of the drug sustains blood level is considered as sustained release system.
Advantages
1. Decreased local and systemic side effects.
2. Better drug utilization.
3. Decrease in total dose of the drug.
4. Prevents fluctuation of plasma drug concentration.
5. Better Bio-availability of the drug.
6. Improved efficiency in treatment.
7. Improved patient compliance.
8. Economy.
Disadvantages
1. Dose dumping.
2. Reduced potential for accurate dose adjustment.
3. Need for additional patient education.
4. Slow absorption may delay the onset of activity, but this is probably unimportant during
INTRODUCTION TO MICROSPHERES AS DRUG DELIVERY SYSTEMS (5, 13)
The term microsphere describes a monolithic spherical structure with the drugs or therapeutic
agent distributed throughout the matrix either as a molecular dispersion or as a dispersion of
particles.
Fig.2 Microspheres
Micro-particles are the polymeric entities in the range of 1-1000μm.They cover two types of
forms as Microcapsules which are micrometric reservoir systems and Microspheres which are
micrometric matrix systems. Microspheres are essentially spherical in shape, whereas
microcapsules may be spherical or non-spherical. Microparticles offer a method to deliver
macromolecules by a variety of routes and effectively control the release of such drugs. They
may also be used in the delivery of vaccines and molecules such as DNA for use in gene
therapy. Microparticles offer effective protection of encapsulated agent against degradation
(e.g. enzymatic), the possibility of controlled and local delivery of the drug over periods
ranging from few hours to months, and easy administration. The optimum effect of many
medical treatments is obtained by maintaining the drug concentration in the therapeutic range
over a sustained period of time. This is especially true for highly potent drugs, such as
anti-cancer drugs. Administration of the entire drug dose at once using conventional
pharmaceutical dosage (e.g. tablets, bolus injection), the whole amount is rapidly released
Fig.3: Concentration(c) vs. Time (t) profiles for conventional and controlled release drug delivery.
POLYMERS USED FOR MICROSPHERES (14) Synthetic Polymers
Synthetic polymers are divided into two types.
a. Non-biodegradable polymers
e.g. Poly methyl methacrylate (PMMA), Glycidyl methacrylate, Epoxy polymers.
b. Biodegradable polymers
e.g. Lactides, Glycolides& their co polymers, Poly alkyl cyano acrylates, Poly anhydrides.
Natural polymers
Obtained from different sources like proteins, carbohydrates and chemically modified
carbohydrates.
Proteins: Albumin, Gelatin and Collagen.
Carbohydrates: Agarose, Carrageenan, Chitosan, Starch.
Chemically modified carbohydrates:Poly(acryl)dextran.
TECHNIQUES FOR THE PREPARATION OF MICROSPHERES (10) Preparation of microspheres should satisfy certain criteria
1. The ability to incorporate reasonably high concentrations of the drug.
2. Stability of the preparation after synthesis with a clinically acceptable shelf life.
3. Controlled particle size and dispersability in aqueous vehicles for injection.
5. Biocompatibility with a controllable biodegradability and Susceptibility to chemical
modification.
1. Solvent evaporation and extraction based processes:
i. Single emulsion process
ii. Double emulsion process
2. Phase separation-coacervation
3. Polymerization
4. Spray drying
5. Chemical and thermal cross-linking
6. Cross linking using a freeze-thaw technique
MATERIALS AND METHODS MATERIALS
Ropinirole HCl was received as a gift sample from Ind-Swift Labs, Mohali (Punjab).
HPMC K15M was received as agift sample from Colorcon, Mumbai, Eudragit RL100 &
Eudragit RS100 were received as gift samples from Evonik Degussa India Pvt.Ltd, Mumbai
while other chemicals and solvents were procured from Loba Chemie, Mumbai as shown in
Table 3. All materials used were of analytical grade as supplied by manufacturer.
METHODOLOGY
Preparation of Ropinirole HCl microspheres
Ropinirole HCl microspheres were prepared by spray drying technique as described
elsewhere. Spray dryer (Labultima LU-222 Advanced) was used for the preparation of
microspheres. Briefly, different amount of Eudragit RS100 and HPMC K15M was dissolved
in 50 mL of mixture of dichloromethane and acetone in the ratio 1:1 by using a magnetic
stirrer for all batches as shown in Table 1 below. To this the required proportion of HPMC K15M was added and continued stirring until a uniform dispersion was ensured. The
proportions of Eudragit RS100: HPMC K15M, Eudragit RS100:ERL100 and Eudragit RS100
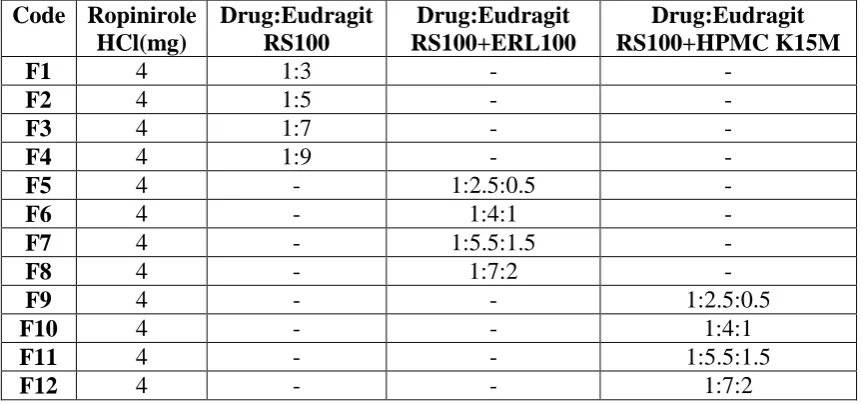
alone were varied. The required quantity of Ropinirole HCl (4 mg) was kept constant and was
dispersed in the polymer mixture. The polymeric solution was allowed to flow through the
Table 1: Formulations of Ropiniorle HCl Microspheres
The spray drying conditions i.e inlet temperarure, outlet temperature and aspirator flow rate
used for the formulations were constant. Inlet temperature was set to 750C and outlet temperature in the range 55 0C-600C.aspirator flow rate was set to 40 Nm3/hr.
CHARACTERIZATION OF MICROSPHERES 1) Percentage yield
The percentage yield of different formulations was determined by weighing the microspheres
after drying. The percentage yield was calculated as follows.
Practical yield
Percentage yield = X 100
Theoretical yield
as shown in Table 6.
2) Drug entrapment efficiency
The various batches of the microspheres were subjected to determination of drug entrapment
efficiency. For each batch 50mg of microspheres were accurately weighed and crushed. The
powdered microspheres were dissolved in (50ml) methanol. This solution was then filtered
through Whatmann filter paper. After filtration, from this solution accurate quantity (1 ml)
was taken and diluted up to 10 ml with methanol. Absorbance was measured against
methanol as a blank. The percentage drug entrapment was calculated as follows.
Shown in Table 6. Code Ropinirole
HCl(mg)
Drug:Eudragit RS100
Drug:Eudragit RS100+ERL100
Drug:Eudragit RS100+HPMC K15M
F1 4 1:3 - -
F2 4 1:5 - -
F3 4 1:7 - -
F4 4 1:9 - -
F5 4 - 1:2.5:0.5 -
F6 4 - 1:4:1 -
F7 4 - 1:5.5:1.5 -
F8 4 - 1:7:2 -
F9 4 - - 1:2.5:0.5
F10 4 - - 1:4:1
F11 4 - - 1:5.5:1.5
3) Percentage drug loading efficiency (15, 16, 17)
Percentage drug loading efficiency was determined by UV spectrophotometric method. Drug
was extracted from the both the drug containing microspheres using
methanol and the absorbance was measured using UV-visible.
as shownin Table 6.
DETERMINATION PRECOMPRESSION PARAMETERS
The flow properties were investigated by measuring the bulk and tapped density.
a) Bulk density
Measuring cylinder of capacity 10mL was taken and 10 gm of powder of all batches were
weighed and passed through the sieves and filled into the cylinder and their volumes were
noted down and bulk density was calculated. The formula used for calculation is as follow.
Mass Bulk density =
Volume
The results for bulk density are given in Table 7. b) Tapped density
Measuring cylinder of capacity 10mL was taken and 10 gm of the powder of all batches were
weighed and filled into the cylinder, volume of powder measured and noted then that cylinder
was tapped about 300 times using bulk density apparatus and again volume of powder
measured and tapped density of powder calculated by following formula.
Mass of powder Tapped density =
Tapped volume
The results for tapped density of material are given in Table 7. c) Carr’sindex
Carr’s index of the powder was determined for determination of flow of the powder, for the calculation of Carr’s index it requires tapped density and bulk density. Relationship between type of flow and Carr’s index are given in table no. 15. Formula for the calculation of the Carr’s index is given below.
Tapped density- Bulk density Carr’s index =
[image:12.595.200.394.481.654.2]Tapped density
Table 2: Relationship between type of flow and their Carr’s index Carr’s index Type of flow
≤ 10 Excellent
11-15 Good
16-20 Fair
21-25 Passable
26-31 Poor
32-37 Very poor
Results for the Carr’s index of material were given in Table 7.
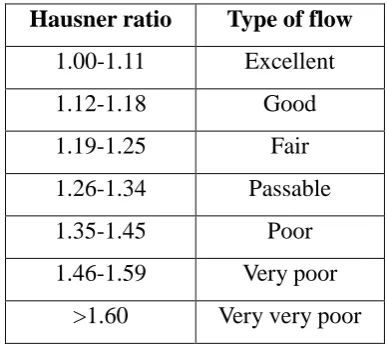
d) Hausner ratio
Hausnerratio gives information about flow ability of the powder, for the determination of the
Hausner ratio it requires tapped density and bulk density. Table no. 16 shows relationship
between Hausner ratio and type of flow.
Hausner ratio = tapped density / bulk density
Table 3: Relationship between Hausner ratio and type of flow.
e) Angle of repose
Angle of repose was determined according to USP 2007 method, funnel was taken and it is
fixed at 1cm height on the stand. One cotton was placed at the orifice of the funnel and on
that cotton a constant powder weight was placed. The cotton was removed and the diameter
formed by powder and height formed by the pile of the powder was measured and angle of
Hausner ratio Type of flow
1.00-1.11 Excellent
1.12-1.18 Good
1.19-1.25 Fair
1.26-1.34 Passable
1.35-1.45 Poor
1.46-1.59 Very poor
repose was calculated from the following formula. Relationship between angle of repose and
flow ability of powder is given in Table 7. (θ) = tan-1 (h / r)
Where h = height formed by the pile of the powder.
R = diameter formed by powder.
Results for angle of repose of core are noted down in Table 7.
Table 4: Relationship between Angle of repose () and flowability Angle of repose Type of flow
25-30 Excellent
31-35 Good
36-40 fair
41-45 Passable
46-55 Poor
56-65 Very poor
>66 Very very poor
FORMULATION OF ORODISPRESIBLE TABLETS OF PREPARED
MICROSPHERES
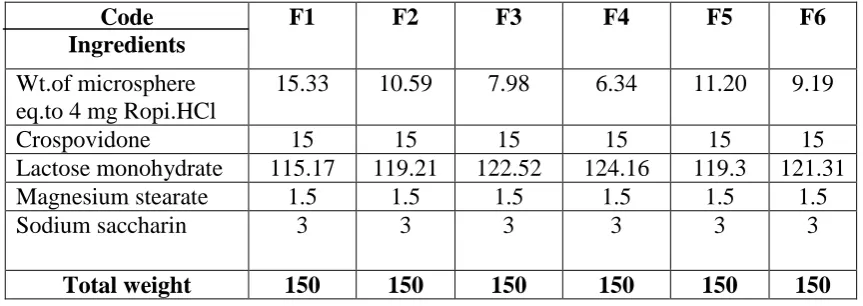
Orodispersible tablets of Ropinirole HCl microspheres were prepared by direct compression
technique using rotary tablet compression machine as described elsewhere. The microspheres
were blended with the excipients like lactose monohydrate, crospovidone, magnesium
stearate, sodium saccharin and talc. All formulations contained microspheres equivalent to 4
mg Ropinirole HCl. Also the level of superdisintegrant i.e. crospovidone was kept constant in
[image:13.595.82.514.596.749.2]all the formulations.
Table 5: Formulation of SR-ODTs Code
Ingredients
F1 F2 F3 F4 F5 F6
Wt.of microsphere eq.to 4 mg Ropi.HCl
15.33 10.59 7.98 6.34 11.20 9.19
Crospovidone 15 15 15 15 15 15
Lactose monohydrate 115.17 119.21 122.52 124.16 119.3 121.31
Magnesium stearate 1.5 1.5 1.5 1.5 1.5 1.5
Sodium saccharin 3 3 3 3 3 3
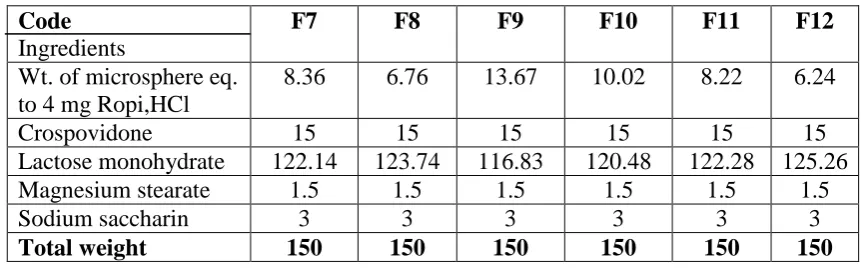
Code
Ingredients
F7 F8 F9 F10 F11 F12
Wt. of microsphere eq. to 4 mg Ropi,HCl
8.36 6.76 13.67 10.02 8.22 6.24
Crospovidone 15 15 15 15 15 15
Lactose monohydrate 122.14 123.74 116.83 120.48 122.28 125.26
Magnesium stearate 1.5 1.5 1.5 1.5 1.5 1.5
Sodium saccharin 3 3 3 3 3 3
Total weight 150 150 150 150 150 150
All quantities in milligrams.
EVALUATION OF PREPARED SR-ODTs (POST COMPRESSION PARAMETERS)
a) Hardness: The crushing strength of the tablets was measured using a Monsanto hardness
tester. Three tablets from each formulation batch were tested randomly.
b) Friability: Twenty tablets were weighed and placed in a Roche friabilator and the
equipment was rotated at 25 rpm for 4 min. The tablets were taken out, dedusted, and
reweighed. The percentage friability of the tablets was calculated using Equation.
Initial weight - Final weight
Percentage friability = *100 Initial weight
c) In Vitro Disintegration time: The disintegration time of tablets is usually measured
with the disintegration apparatus described in IP. A single tablet was put in the disintegration
apparatus and the time required for the disintegration of the tablet was measured in seconds.
[image:14.595.81.512.90.225.2]The medium used for the disintegration was phosphate buffer pH 6.8. The results are given in
Table 8.
d) Disintegration time in oral cavity: The in-vivo taste evaluation was carried out on
healthy volunteers with sound organoleptic senses, with their prior consent. On placing the
dosage form in the oral cavity, the disintegration time was noted after which it was further
held in mouth for 60 sec by each volunteer, and the bitterness level was checked. After 60
sec, the disintegrated tablet was spitted out and the mouth was rinsed thoroughly with mineral
water. Along with the taste evaluation, a simultaneous observation of mouth feel (grittiness or
smoothness) and disintegration time noted to assess the quality of the product. The results are
e) Uniformity of content. Five tablets were selected randomly and dissolved in 100 mL of
0.1 N HCl, stirred for 60 min, and filtered. One milliliter of the filtrate was diluted to 100 mL
with 0.1 N HCl. Absorbance of this solution was measured at 250 nm using 0.1 N HCl as
blank and content of Ropinirole HCl was estimated.
f) Wetting Time: A piece of tissue paper (12×10.75 cm) folded twice was placed in a Petri
dish (internal diameter=9 cm) containing 10 ml of buffer solution simulating saliva, pH 6.8,
and. A tablet was placed on the paper and the time taken for complete wetting was noted.
Three tablets from each formulation were randomly selected and the average wetting time
was recorded. Results of wetting time are given in Table 8 & Fig5, 6..
IN-VITRORELEASE STUDIES
In-vitro release of Ropinirole HCl SR-ODTs was carried out at 50 rpm at 370C using the USP
dissolution test apparatus Type-II (paddle). SR-ODTs containing weighed amounts of
microspheres equivalent to 4 mg of drug were placed in dissolution jar. Dissolution medium
used was 800 ml of 0.1 N HCI (pH 1.2) maintained at 37 ± 0.5°C and stirred at 50 rpm for 2
hrs. At predetermined time intervals of 1 hr, 5 ml of sample was withdrawn and replaced with
equal amount of 0.1 N HCI (pH 1.2). After that dissolution medium was made upto 6.8 pH
for next 10 hrs. The 5 ml withdrawn samples were filtered and suitably diluted with 0.1 N
HCI and 6.8 pH buffer solution and analyzed spectrophotometrically. It is shown in Table 9
and Fig 8.
ASSAYOF SR-ODT OF ROPINIROLE HCL
Five tablets of Ropinirole hydrochloride were weighed and powdered in glass mortar. Powder
equivalent to 10 mg of the drug was transferred to 100 ml volumetric flask, dissolved in
about 50ml distilled water and made up the volume to the mark with distilled water to obtain
the concentration of 100 μg/ml. Aliquots of 0.5 to 3.5 ml portions of the standard solution
were transferred to a series of calibrated 10 ml corning test tubes and the volume in each test
tube was adjusted to 10 ml with distilled water. The absorbance of solutions was measured at
250 nm against reagent blank and calibration curve was constructed. Similarly absorbance of
sample solution was measured and amount of Ropinirole hydrochloride in the tablet was
SCANNING ELECTRON MICROSCOPY (SEM) STUDY
SEM study of Ropinirole HCl microspheres was carried out to evaluate shape and surface
characteristics. The results are shown in Fig.10.
FT-IR STUDY OF ROPINIROLE HCL MICROSPHERES
The infrared spectrum of the prepeaaed Ropinirole HCl microspheres formulation was drawn
which clearly indicates the presence of drug in the formulation and helps to identify the drug.
The results are shown in Fig.11. KINETIC MODELING
In order to understand the kinetic and mechanism of drug release, the result of in-vitro drug
release study of microspheres were fitted with various kinetic equation like zero order
(equation 1) as cumulative % release vs. time, first order (equation 2)as log percentage of
drug remaining to be released vs Time. Higuchi’s model (equation 3) as cumulative % drug
release vs square root of time. R2 and K values were calculated for the linear curve obtained by regression analysis of the above plots. C = K0t ………….. (1) Where k0 is the zero order
rate constant expressed in units of concentration / time and t is time in hours. log C =log C0 -
Kt/2.303 ………(2) Where C0 is the initial concentration of drugs, k is the first
order constant, and t is time. Q = Kht1/2 ………….. (3) Where Kh is Higuchi’s square root
of time kinetic drug release constant To understand the release mechanism in-vitro data was
analyzed by Korsemeyer Peppas model (Equation 4) as log cumulative drug release vs. log
time and the exponent ‘n’ was calculated through the slope of the straight line. Mt / M∞ =
btn…………... (4) Where Mt is amount of drug release at time t, M∞ is the overall amount of the drug, b is constant, and n is the release exponent indicative of the drug release
mechanism. If the exponent n = 0.5 or near, then the drug release mechanism is Fickian
diffusion, and if n have value near 1.0 then it is non-Fickian diffusion and the results are
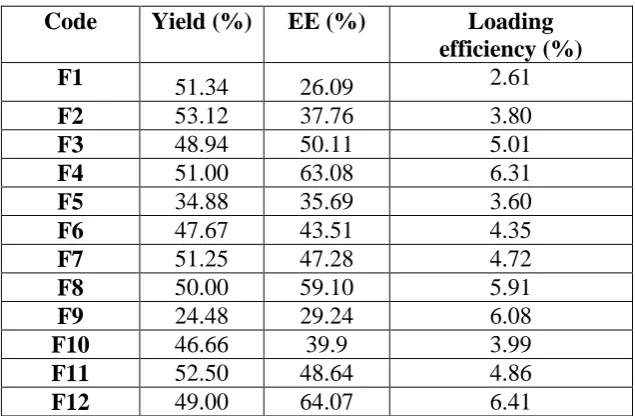
RESULTS AND DISCUSSION Evaluation of Microsphere
Table 6: Evaluation of Microspheres
Code Yield (%) EE (%) Loading
efficiency (%)
F1 51.34 26.09 2.61
F2 53.12 37.76 3.80
F3 48.94 50.11 5.01
F4 51.00 63.08 6.31
F5 34.88 35.69 3.60
F6 47.67 43.51 4.35
F7 51.25 47.28 4.72
F8 50.00 59.10 5.91
F9 24.48 29.24 6.08
F10 46.66 39.9 3.99
F11 52.50 48.64 4.86
F12 49.00 64.07 6.41
The percentage yield of different batches was determined by weighing the microspheres after
drying. The percentage yields of different formulation were in range of 24.48-53.12 %. The
percentage yield of microspheres did not show remarkable change. The drug entrapment
efficiency of different batches of microspheres of Eudragit RS100, Eudragit RL100 and
HPMC K15M in methanol was found in the range of 26.09-64.07 %. The particle size of
Ropinirole HCl microspheres using EudragitRS100: HPMC K15M and it was found to be 90
µm -130 µm. The drug loading efficiency of all batches was found to be 2.61 %- 6.41 %
(Table 6).
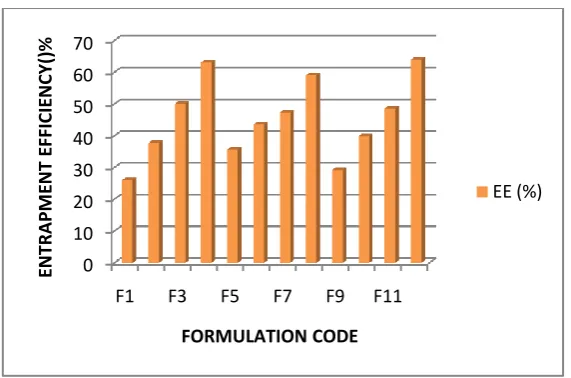
Higher practical yield was found for batch F12 formulation at the Eudragit RS100: HPMC
K15M ratio 7:2. The entrapment efficiency was more (64.07%) at the Eudragit RS100:
HPMC K15M ratio 7:2. Fig.4. Higher percentage of drug loading was obtained by increasing the amount of Eudragit RS100: HPMC K15M in water at 7:2 ratio (6.41%). The formulation
F12 showed more % yield, more % entrapment efficiency, optimum particle size and more
Fig 4: Percentage entrapment efficiency of Ropinirole HCl microspheres prepared by using ERL100, ERS100 & HPMC K15M at different concentrations & combinations. DETERMINATION OF PRECOMPRESSION PARAMETERS FOR SUSTAINED RELEASE ORODISPERSIBLE TABLETS OF ROPINIROLE HCl
Table 7: Evaluation of precompression material. Batch Bulk Density
(gm/cm3)
Tapped Density (gm/cm3)
Hausner ratio
Carr’s Index
Angle of Repose(Ɵ)
F1 0.67 0.77 1.149 12.98 30.21
F2 0.65 0.75 1.153 13.33 32.47
F3 0.66 0.76 1.151 13.15 31.63
F4 0.66 0.76 1.151 13.15 33.06
F5 0.66 0.75 1.151 12.00 32.13
F6 0.68 0.79 1.136 13.92 31.49
F7 0.67 0.76 1.134 11.84 34.15
F8 0.65 0.73 1.076 10.95 30.54
F9 0.64 0.73 1.140 12.32 32.30
F10 0.66 0.77 1.166 14.28 35.69
F11 0.67 0.78 1.164 14.10 33.51
F12 0.66 0.76 1.151 13.15 32.40
The precompression material for the preparation of SR-ODTs of Ropinirole HCl was
evaluated for the parameters like bulk density, tapped density, Carr’s compressibility index
and Hausner ratio. The outcomes of these parameters are tabulated in the above table.
Bulk density of all the 12 batches was in the range of 0.64-0.68 gm/cm3.
Tapped density was in the range of 0.73-0.78 gm/cm3.
0 10 20 30 40 50 60 70
F1 F3 F5 F7 F9 F11
EN
TRAP
M
EN
T
EFFI
CIE
N
CY()%
FORMULATION CODE
Carr’s index was in the range of 10.95-14.28.
Hausner ratio was in the range of 1.076-1.166.
Angle of repose was also found in the prescribed range showing good flow characteristics. It was in the range 30.21-35.69. Only the batch F10 exceeded the normal value of angle of repose. Carr’s index in the range 11 to 15 shows good flow properties and Carr’s index of all
batches is in the range 11-15. Hnece these batches show good flow properties.
Hausner ratio of all the batches was in the range showing good flow properties. Hence
selected for the compression.
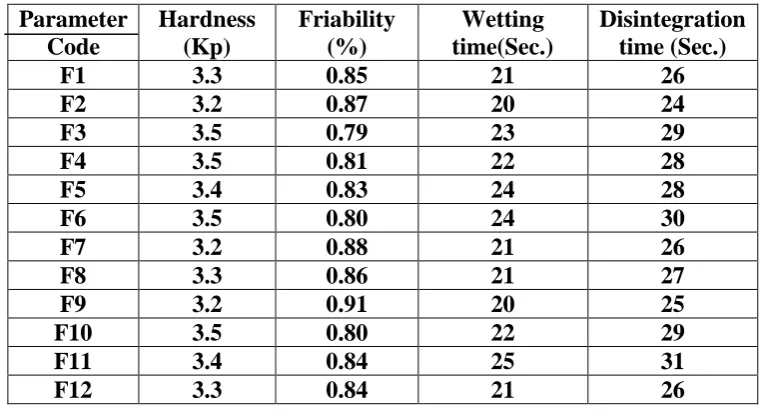
EVALUATION OF SUSTAINED RELEASE ORODISPERSIBLE TABLETS FOR POST COMPRESSION PARAMETERS
Table 8: Technological characterization of tablets Parameter
Code
Hardness (Kp)
Friability (%)
Wetting time(Sec.)
Disintegration time (Sec.)
F1 3.3 0.85 21 26
F2 3.2 0.87 20 24
F3 3.5 0.79 23 29
F4 3.5 0.81 22 28
F5 3.4 0.83 24 28
F6 3.5 0.80 24 30
F7 3.2 0.88 21 26
F8 3.3 0.86 21 27
F9 3.2 0.91 20 25
F10 3.5 0.80 22 29
F11 3.4 0.84 25 31
F12 3.3 0.84 21 26
Hardness was between 3.2-3.5 Kp. All the formulations also passed the friability limits which
were within 0.79-0.91 % and below 1%. The wetting time is closely related to the
disintegration time. There is a direct relationship between the wetting time and disintegration
[image:19.595.106.488.353.559.2]time, which is faster the wetting time, faster is the disintegration time. Wetting time is shown
Fig 5: Before wetting Fig 6: After wetting
The disintegration time for all the batches was found to be within 24-31 seconds which is
within acceptable limits. The in vivo disintegration time for the final formulation was taken
in triplicate which was 30+ 1 seconds.
The wetting time & disintegration time of F12 formulation was found to be 21 seconds & 26
seconds respectively.
In Vivo study
[image:20.595.98.495.74.247.2]Time: 0 seconds Time: 18 seconds Time: 29 seconds Figure 7: In Vivo study of SR-ODT for mouth feel, taste and disintegrating time.
The in vivo study was conducted on human volunteer with their prior consent, to screen MDT
for various parameters like mouth feel (smoothness or grittiness), disintegration time and
taste of mouth dissolving tablet. From in vivo study conducted on human volunteer following
1. Mouth feel: Test was carried out on human volunteer to check mouth feel (smoothness or grittiness) of ODT, it was found that ODT showed smooth mouth feel without any grittiness.
2. Disintegration time: The volunteer were asked for complete disintegration of ODT, and disintegration time for optimized formulation was found about 29 seconds.
4. Taste: The volunteer were also opinioned for taste of ODT, and volunteer sensed ODT to be sweet.
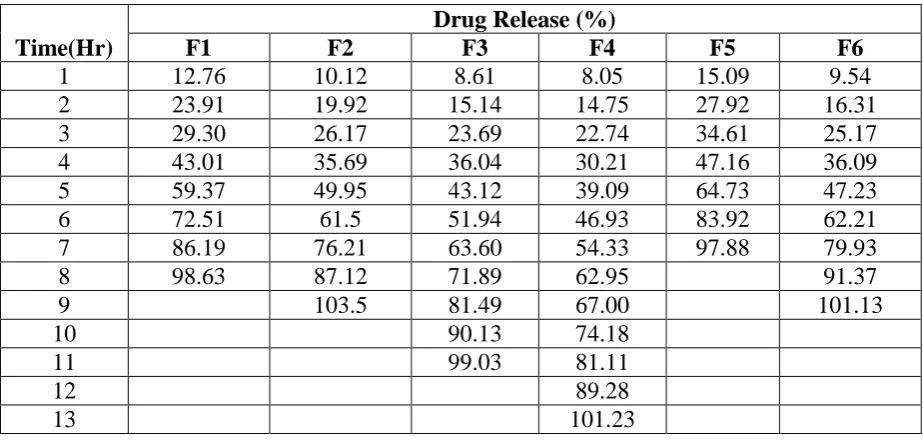
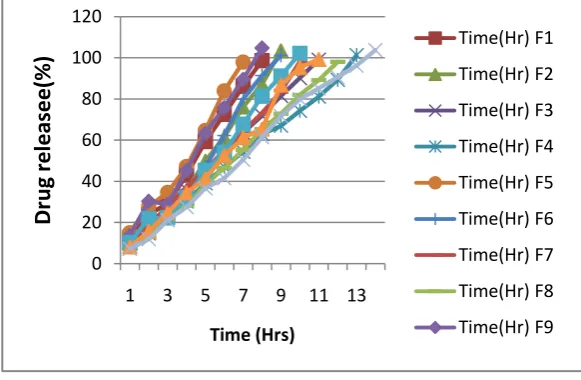
[image:21.595.67.529.277.500.2]IN-VITRO DRUG RELEASE STUDY
Table 9: In Vitro% Cumulative Drug Release of SR-ODTs Time(Hr)
Drug Release (%)
F1 F2 F3 F4 F5 F6
1 12.76 10.12 8.61 8.05 15.09 9.54
2 23.91 19.92 15.14 14.75 27.92 16.31
3 29.30 26.17 23.69 22.74 34.61 25.17
4 43.01 35.69 36.04 30.21 47.16 36.09
5 59.37 49.95 43.12 39.09 64.73 47.23
6 72.51 61.5 51.94 46.93 83.92 62.21
7 86.19 76.21 63.60 54.33 97.88 79.93
8 98.63 87.12 71.89 62.95 91.37
9 103.5 81.49 67.00 101.13
10 90.13 74.18
11 99.03 81.11
12 89.28
13 101.23
Time(Hr) F7 F8 F9 F10 F11 F12
1 9.61 7.54 13.54 10.32 8.24 7.27
2 18.77 13.07 30.32 21.93 15.8 11.97
3 28.07 21.81 28.92 22.38 24.75 21.19
4 37.35 28.29 45.30 32.21 34.50 27.54
5 45.25 38.54 63.32 45.32 41.5 36.59
6 55.36 46.59 75.87 54.05 52.62 41.50
7 64.32 55.45 89.52 67.71 61.29 50.49
8 73.26 65.39 104.82 81.36 65.49 61.49
9 83.64 72.93 91.19 86.88 71.68
10 98.21 82.07 102.11 95.32 79.85
11 89.28 99.34 85.15
12 98.09 90.54
13 96.20
Polymer Eudragit RS100 and HPMC K15M are insoluble in water. Ropinirole HCl
microspheres showed sustained release in pH 1.2 and pH 6.8 buffer solutions. Drug release of
Ropinirole HCl microspheres was evaluated; at 1 Hr approximately 7.27% of the drug was
released initially. Furthermore, drug release from the microspheres was sustained by the
polymers. Eudragit RS100 is water insoluble polymer and it does not show pH dependency.
As the ERS100 content was increased, the release of drug was decreased significantly and
sustained the effect over 14 hours depending upon the ERS100 and HPMC K15M ratio. At
the end of 14th hour drug release was found to be 103.75 % (F12) Table 9. The microspheres prepared by using ERS100 and HPMC K15M polymer ratio of 1:9 shows better sustained
release of Ropinirole HCl than microspheres prepared using same ratios of ERL100:ERS100
& ERS100 alone. Table 9 and Fig 8. The drug release of ‘F4’ and ‘F8’ was found to be
[image:22.595.151.442.337.527.2]101.23 & 98.09 % at the end of 13 Hrs & 12 Hrs respectively as shown in Table 9 and Fig 8.
Fig 8: In- Vitro% CDR of Ropinirole HCl microspheres.
In vitro drug release study of Ropinirole HCl SR-ODT formulation F12 in triplicate Table 10: In vitro drug release study of selected formulation.
% DRUG RELEASE
Time (Hrs) F12a F12b F12c Avg. SD
1 7.27 8.91 8.11 8.106 0.835
2 11.97 12.41 12.62 12.33 0.331
3 21.19 20.17 19.97 20.44 0.654
4 27.54 27.09 27.73 27.45 0.328
5 36.59 37.17 37.02 36.92 0.301
6 41.50 42.15 41.29 41.64 0.448
0 20 40 60 80 100 120
1 3 5 7 9 11 13
Dr
u
g
re
le
asee
(%)
Time (Hrs)
Time(Hr) F1
Time(Hr) F2
Time(Hr) F3
Time(Hr) F4
Time(Hr) F5
Time(Hr) F6
Time(Hr) F7
Time(Hr) F8
7 50.49 52.28 51.78 51.51 0.923
8 58.49 57.78 57.26 57.84 0.617
9 66.68 67.34 67.09 67.03 0.333
10 73.85 74.01 74.94 74.26 0.588
11 82.07 81.73 82.11 81.97 0.208
12 89.54 90.23 90.01 89.92 0.352
13 96.20 97.18 96.31 96.56 0.536
14 103.75 102.97 101.43 102.71 1.18
The in vitro drug release of the selected formulation was repeated twice to study the
reproducibility of the results. The sustained drug release was found to be reproducible in case
[image:23.595.91.507.282.710.2]of the selected SR-ODT formulation F12.
Fig 9: In vitro drug release of selected formulation (F12) in triplicate.
y = 7.576x - 2.031 R² = 0.999
0 20 40 60 80 100 120
0 5 10 15
% d ru g Re lease Time (Hrs)
F12a
F12ay = 7.546x - 1.495 R² = 0.998
0 20 40 60 80 100 120
0 5 10 15
% Dr u g Re lease Time(Hrs)
F12b
F12by = 7.510x - 1.494 R² = 0.998
0 20 40 60 80 100 120
0 5 10 15
ASSAY OF ROPINIROLE HCL SUSTAINED RELEASE ORODISPERSIBLE TABLET (F12)
Table 11: Drug content of Ropinirole HCl SR-ODT
SCANNING ELECTRON MICROSCOPIC ANALYSIS
Scanning Electron Microscopy of Ropinirole HCl microspheres showed spherical shape with
no visible major surface irregularity. Few wrinkles were appeared at the surface and some
[image:24.595.143.456.269.663.2]crystal shape particles appeared as shown in Fig .
Fig 10: Scanning Electron Micrograph of Ropinirole HCl Microspheres prepared with Eudragit RS100 and HPMC K15M
Drug content Limit
Table 12: The major peaks observed and corresponding functional groups solubility
Fig.11: The FT-IR spectrum of the formulation shows the charecteristic peaks of the drug and polymers.
The peaks obtained at specific wavenumbers show that there is not significant interaction
between the drug and the polymers.
KINETIC MODELING
Table13: Release kinetics study of RopiniroleHCl microspheres of F12 formulation. Sr.
No.
Groups Peak assignments Standard
Peaks(cm-1)
Observed Peaks (cm-1)
1 -CH group of alkanes -C-H- rocking vibration
600-1500 761.73
2 -CH group of
alcohols,ethers,carboxylic acids,esters.
-C-O- stretching 1000-1300 1071.38
3 Carbonyl group -C=O stretching 1680-1760 1729.19
4 -CH group of alkanes -C-H stretching 2850-2960 2927.89
5 Amine group -N-H stretching 3300-3500 3479.80
Code Zero Order
First Order
Higuchi Korsmeyer Peppas
Hixson crowell
Release exponent
R2 R2 R2 R2 R2 n
[image:25.595.138.454.288.467.2]Fig 12: Zero order release study of F12 batch.
Fig 13: First order release study of F12 batch.
Fig 14: Korsemeyer Peppas model study of F12 batch.
0 20 40 60 80 100
0 4 8 12 16 20 24
% of Cumul at iv e Dr ug R e le ase Time (hrs)
Zero order Release
Zero order Release
y = -0.166x + 2.589 R² = 0.578
-2 -1.5 -1 -0.5 0 0.5 1 1.5 2 2.5 3
0 4 8 12 16 20 24
Log %Cum ul ati ve r em ai n to re e la se Time (h)
First Order
First Ordery = 1.077x + 0.789 R² = 0.997
0.000 0.300 0.600 0.900 1.200 1.500 1.800 2.100
-0.500 -0.200 0.100 0.400 0.700 1.000 1.300
Log % of R e le ase Log t
Fig 15: Higuchi model study of F12 batch
Fig.16: Hixson Crowell model study of F12 batch.
Fig 17: Graph of Release exponent.
y = 28.61x - 18.05 R² = 0.869
0 20 40 60 80 100
0 0.5 1 1.5 2 2.5 3 3.5 4
% Cumula ti ve dr ug r el ea se √t
Higuchi Model
Higuchi Modely = -0.273x + 5.274 R² = 0.873
0 1 2 3 4 5 6
0 5 10 15
Cub e root of % d ru g re m ain in g Time(Hrs)
Hixson Crowell model
Series1
Linear (Series1)
y = 0.924x - 1.225 R² = 0.600
-1.5 -1 -0.5 0 0.5 1 1.5
0 0.5 1 1.5 2 2.5
[image:27.595.148.449.543.743.2]The in-Vitro release data was applied to various kinetic models to predict the drug release
kinetic mechanism. The release constant was calculated from the slope of appropriate plots
and the regression coefficient (r2) was determined. The correlation coefficient (r2) of Ropinirole HCl was in the range of 0.578-0.9978 for SR-ODTs of microspheres of ERS100
& HPMC K15M various formulations. It was found that the in-vitro drug release of
orodispersible tablet containing sustained release microspheres was best explained by Zero
order kinetics and followed Korsemeyer Peppas model Fig . The value of n was 0.6003 i.e.n ˃0.5 for F12 formulation, indicated that drug release is by Non-Fickian mechanism as
shown in Fig .
CONCLUSION
Different development aspects of orodispersible tablets containing sustained release
microspheres were studied. Sustained released microspheres of Ropinirole HCl were
successfully prepared using Eudragit RS100 and HPMC K15M by spray drying technology.
Microspheres were prepared at different concentration of Eudragit RS100 and HPMC K15M
which were formulated into Orodispersible tablets. It was found that as the concentration of
Eudragit RS100 and HPMC K15M increases up to optimum ratio (9:1), microspheres showed
good yield, particle size, entrapment efficiency and drug release. Change in concentration of
Eudragit RS100 and HPMC K15M in formulation has enormous impact on drug loading and
drug release The drug entrapment efficiency of different batches of microspheres of Eudragit
RS100 and HPMC K15M was found in the range of 26.09-64.07 %. In case of F12
formulation of Ropinirole HCl SR-ODT, microspheres showed good entrapment efficiency
than other formulations.
Percentage drug loading of all formulations were in the range of 2.61-6.41%. Higher
percentage of drug loading was obtained in F12 formulation (6.41%). Optimum size of
microspheres was obtained for F12 formulation. Tapped density of all formulations was
found to be of 0.73-0.78gm/cm3 and Bulk densities were 0.64-0.68 gm/cm3. In-Vitro drug release study of Eudragit RS100 and HPMC K15M ratio (9:1) for F12 showed 103.75 % drug
release upto 14 hour. F12 formulation showed microspheres of Ropinirole HCl were
spherical and smooth. Microspheres of Ropinirole HCl in formulation F12 showed drug
release in slow and sustained manner over 14 hours. The In-Vitro release data was applied to
formulations, indicated that drug release is by Non-Fickinian mechanism. Present research
work has successfully developed at different processing and formulation parameters for
sustained release Ropinirole HCl microspheres to formulate them into Orodispersible tablets.
REFERENCES
1. Yoshio K, Masazumi K, Shuichi A, Hiroaki N. Evaluation of Rapidly Disintegrating
Tablets Manufactured By Phase Transition Of Sugar Alcohols. Journal of Controlled
Release.2005; 105:16-22.
2. G. Abdelbary, P. Prinderre, C. Eouani, J. Joachim, J.P. Reynier, Ph. Piccerelle. The
Preparation of Orally Disintegrating Tablets Using A Hydrophilic Waxy Binder.
International Journal Of Pharmaceutics. 2004; 278 :423-433.
3. Amjad M. Qandil,Shereen M. Assaf ,Enas A. Al Ani,Alaa Eldeen Yassin,Aiman A.
Obaidat. Sustained-Release Diclofenac Potassium Orally Disintegrating Tablet
Incorporating Eudragit ERL/ERS: Possibility of Specific Diclofenac-Polymer Interaction.
Journal of Pharmaceutical Investigation.2013; 43:171–183.
4. Tejvir K, Bhawandeep G, Sandeep K, Gupta G. Mouth Dissolving Tablets: A Novel
Approach to Drug Delivery. International Journal of Current Pharmaceutical Research.
2010;3 (1):1-7.
5. Gupta A.K, Mittal A, Jha K.K. Fast Dissolving Tablet- A Review. The Pharma
Innovation.2012; 1(1):1-7.
6. P. Ashish, M.S. Harsoliya, J.K.Pathan, S. Shruti; A Review- Formulation Of Mouth
Dissolving Tablet, Int. J Pharm Clin Sci(2011); 1 (1): 1-8.
7. Bhowmik D, Chiranjib B, Krishnakanth, Pankaj, Margret Chandira R. Fast Dissolving
Tablet: An Overview. J Chem Pharm Res. 2009;1(1): 163-177.
8. Agnihotri N, Mishra R, Goda C, Arora M. Microencapsulation – A Novel Approach to
Drug Delivery: A Review. Indo Global Journal Of Pharmaceutical
Sciences.2012;2(1):1-20.
9. Kaur T, Bhawandeep G, Sandeep K, Gupta G. Mouth Dissolving Tablets: A Novel
Approach to Drug Delivery. International Journal of Current Pharmaceutical Research.
2010;3(1):1-7.
10.Waldron K, Winston W, Zhangxiong W, Wenjie L. Hierarchically Porous Microparticles
Via Spray Drying.2012;3(2):15-21.
11.Patel R, Spray Drying Technology: An Overview. Ind. Jour. Of Sci. And Tech. 2009;
12.Kuchekar B.S.Kulkarni M. Sustained release drug delivery: an overview. International
journal of pharmaceutics.2009; 1:156-168.
13.Prasanth V, Moy A, Mathew S, Mathapan R, Microspheres – An Overview, Intenational
Journal Of Research In Pharmaceutical Biomedical Sciences. 2011; 2: 332-338.
14.Agnihotri N, Mishra R, Goda C, Arora M. Microencapsulation – A Novel Approach to
Drug Delivery: A Review. Indo Global Journal Of Pharmaceutical
Sciences.2012;2(1):1-20.
15.Rongfeng H, Jiabi Z, Guangliang C, Preparation of Simvastatin microspheres by spherical
crystallization technique. Asian jour of Pharm sci. 2006; 1: 127-132.
16.Maravajhala V, Venkata N, In vitro and in vivo studies on controlled release
microspheres of Simvastatin. Int Conference on Biology, Environment and Chemistry
IPCBEE. 2011; 24.
17.British Pharmacopoeia, 6th edition of European pharmacopeia, 2010; 2; 432,602,841, 1086, 1296, 1329, 1343, 1880, 1968.
18.U. B. Hadkar, A Handbook of Practical Physical Pharmacy and Physical Pharmaceutics,
NiraliPrakashan, 85-88.
19.J. Carstensen, G. Banker, C. Rhodes, Preformulation. In: Modern pharmaceutics,
Fourthedition. New York: Marcel Dekker Inc. 2002; 174-191.
20.M.E. Aulton, Pharmaceutics, The design and manufacture of medicines, Churchill living
stoneelsevier, 2007; 3; 432-435,356.
21.Indian Pharmacopoeia, Government of India, Ministry of health and family welfare,
2010; (1): 140-142,561.
22.Ercu¨ment K, Karasulub Y, Extended release lipophilic indomethacin microspheres:
formulation factors and mathematical equations fitted drug release rates. Eur Jour of
Pharm Sci. 2003; 19: 99–104.
23.Indian Pharmacopoeia, Government of India, Ministry of health and family welfare,
2010; (1): 140-142,561.
24.Goole J, Amighi K. Levodopa Delivery Systems For The Treatment Of Parkinson’s
Disease:An Overview. International Journal of Pharmaceutics.2009; 380:1-15.
25.Wang A, Yu-Peng L, Rui-Fu Z, Effect of Process Parameters On The Performance Of
Spray Dried Hydroxyapatite Microspheres-Powder Technology. 2008: 1-6.
26.Patel R, Patel M, Suthar A. Spray Drying Technology: An Overview. Indian Journal of
27.Seong Hoon Jeong ,Kinam Park. Development Of Sustained Release Fast-Disintegrating
Tablets Using Various Polymer-Coated Ion-Exchange Resin Complexes. International
Journal of Pharmaceutics .2008; 353:195–204.
28.Gamal A.Shazly,Hesham M.Tawfeek, Mohamed A.Ibrahim,Sayed H. Auda, Mona
El-Mahdy. Formulation and Evaluation Of Fast Dissolving Tablets Containing
Taste-Masked Microspheres Of Diclofenac Sodium For Sustained Release. Digest Journal Of
Nanomaterials And Biostructures.2013; 8(3):1281-1293.
29.Sahoo S, Mallick A, Barik B, Senapati P. Formulation and In Vitro Evaluation Of
Eudragit Microspheres Of Stavudine. Tropical Journal of Pharmaceutical Research.2005;
4(1):369-375.
30.Freiberg S, Zhu X, Review- Polymer MicrospheresfFor Controlled Drug Release. Int.