DEVELOPMENT AND VALIDATION OF A NOVEL ANALYTICAL
METHOD FOR ESTIMATION OF TELMISARTAN IN TABLET
DOSAGE FORMS USING HYDROTROPIC SOLUBILIZATION
Pal Tapas Kumar1*, PandaMoumita1, Roy Chowdhury S1
1
Department of Pharmaceutical Analysis & Quality Assurance, NSHM Knowledge Campus, Kolkata – Group of Institutions NSHM College of Pharmaceutical Technology, 124, B.L.
Saha Road, Kolkata -700053, India
ABSTRACT
The objective of the present work was to explore the application of a hydrotropic solubilization phenomenon in the quantitative analysis of a model poorly water soluble (BCS Class II) drug. Other part of study was to develop and validate simple, easy, cost effective, eco-friendly unique spectrophotometric method of analysis for the novel poorly water soluble drug, Telmisartan, in pure and tablet dosage forms, utilizing the principle of single hydrotropic solubilization involving 20(M) Urea and 2(M) Sodium Benzoate. Solubility of Telmisartan in distilled water and each of the hydrotropes were determined and compared. The percentage label claims of Telmisartan in bulk and tablet forms were estimated by this novel spectrophotometric method. This method was validated for accuracy, linearity, precision, specificity and robustness as per recommendations in official guidelines. The study results revealed that the solubility of Telmisartan had been enhanced by more than 19 times in 20 (M) Urea and 11 times in 2(M) Sodium Benzoate respectively. The standard calibration curves were found obeying Beer-Lambert’s principles as well as linearity at concentration range of 5 - 20 μg/ml (R2 = 1 and % RSD < 2 both intra- and inter-day precision). Analysis of commercial tablets were found to contain drug content well within specified official label claim, (100.53% - 102.95%) of Telmisartan utilizing both the hydrotropes; while per cent recoveries in both the hydrotropes were found ranging from (100.13%-103.73%) - which was well within the specified official limit (90.0%-110%) of Pharmacoepoeal monograph of Telmisartan tablets (ref. USP 2011), even
Volume 3, Issue 5, 577-598. Research Article ISSN 2277 – 7105
Article Received on 18 May 2014,
Revised on 12 June 2014, Accepted on 06 June 2014
*Correspondence for
Author
Dr Tapas Kumar Pal
Department of Pharmaceutical
Analysis & Quality Assurance,
NSHM Knowledge Campus,
Kolkata – Group of Institutions
NSHM College of
Pharmaceutical Technology,
124, B.L. Saha Road, Kolkata
comparable to official HPLC method of analysis. %RSD and %CV were calculated and found < 2 with low standard error. LOD and LOQ were 0.575, 1.745 and 0.406, 1.231 in Urea and Sodium Benzoate respectively. In this assay method, there was no significant interference from any common pharmaceutical additives and diluents. The developed analytical method was proved as simple, specific, selective, reproducible, robust and validated for routine analysis of Telmisartan in pure and tablet dosage forms even without using costly and harmful organic solvents.
KEY WORDS: Angiotensin, ARB, BCS Class II, hydrotrope, LOD, LOQ, label claim.
INTRODUCTION Telmisartan
Telmisartan is 4’-[1,4’-dimethyl-2-propyl [2,6’-bi-benzimidazole]-1’-yl] methyl
1,1’-biphenyl 2-carboxylic acid. It is obtained as a white crystalline powder with melting point in
the range of 221º C - 223º C. Telmisartan is practically insoluble in water; sparingly soluble in strong acid; soluble in strong bases.[1,2] Telmisartan prescribed for the treatment of essential hypertension is a new Angiotensin II receptor blocker that shows high affinity for the angiotensin II receptor type 1 (AT1), with a binding affinity 3000 times greater for AT1
than AT2. It has the longest half-life of any ARB (24 hours) and the largest volume of
distribution among ARBs (500 liters). It blocks the vasoconstrictor and aldosterone secreting effects of angiotensin II by selectively blocking the binding of angiotensin II to the AT1 receptor in many tissues, such as vascular smooth muscle and the adrenal gland.[2]
Hydrotropic Solubilization
Among the newly developed drug molecules, most of them are lipophilic in nature and poor solubility is one of the most difficult problems of these drugs for their analysis.[3,4] For spectrophotometric analysis the poorly water soluble drugs can be solubilized only in various organic solvents.[5,6] In order to avoid the usage of organic solvents, because of their toxicity, volatility and also high cost, attempts to develop alternative analytical methods have been explored so far. Lipophilic drugs having poor water solubility have encountered difficult problems during their spectrophotometric analysis in their formulation. Thus, it is necessary to enhance their aqueous solubility in order to facilitate their direct estimation in dosage forms or even dissolution testing. Among various methods available, HYDROTROPY is one of the advanced and most successful method,[5,7] in which aqueous solubility of poorly water soluble drugs is increased by co-dissolving with other highly water soluble inert substances. Such agents used to increase the solubility of poorly water soluble drug in aqueous medium are known as hydrotropic agent or HYDROTROPES like Sodium Benzoate, Niacinamide, Sodium Citrate, Sodium Acetate and Urea.[5,8-11] To preclude the use of organic solvents, hydrotropic solution may be a proper choice. Concentrated aqueous hydrotropic solutions of Sodium Benzoate, Sodium Salicylate, Urea, Nicotinamide, Sodium Citrate And Sodium Acetate have been observed to enhance the aqueous solubility of many poorly water-soluble drugs.[12,13,14] Maheswari et.al[4,6] have developed various analytical techniques using hydrotropic solubilization for analyzing many poorly water soluble drugs like Norfloxacin, Tinidazole, Ketoprofen etc.
Advantages Of Hydrotropic Solubilization Technique [12,13,17,18]
1. Superior to other solubilization methods, such as miscibility, micellar solubilization, co-solvency and salting in, as the solvent character is independent of pH, highly selective and it does not need emulsification.
2. Simple mixing of the drug with the hydrotrope in water.
3. No chemical modification of hydrophobic drugs or preparation of emulsion system. 4. No use of any organic solvent
MATERIALS AND METHODS Reagents and Chemicals
1. TELMISARTAN was obtained as free sample from M/s Auctus Pharma Ltd (Unit11). 2. Telmisartan 20 mg tablets of three different brands were purchased from different local
retail pharmacies at Kolkata, India.
3. The following commercial tablets of Telmisartan 20 mg were taken for the study:
Drug product Information of Three Brands of Telmisartan Tablets (20mg) SL
NO.
BRAND NAME
BATCH NO.
MFG. DATE
EXP. DATE
PRICE/10
UNITS MANUFACTURER
1 TELMA 18130466 Jul. 13 Jun. 16 Rs.75/15tab Glenmarck Pharmaceuticals Ltd. 2 TAZLOC 48003034 Sep. 13 Aug. 15 Rs.42.50 USV Limited 3 TETAN 1301001501 Sep. 13 Aug. 15 Rs. 41.50 Alembic
Pharmaceuticals Ltd. All other chemicals and solvents used were of analytical grade. The reagents used were Methanol (AR), Ammonium Dihydrogen Phosphate (AR), HPLC grade water, Urea (GR), Sodium Benzoate (GR), Niacinamide (GR). Freshly prepared glass distilled water was used throughout the work.
Equipments and Instruments
1. UV Visible Spectrophotometer: Shimadzu UV-1560 2. Digital Balance: Mettler Toledo (ML204/A01)
Preliminary Solubility Study of Telmisartan in Hydrotropes
Solubility of Telmisartan was determined at 25±5°C. 10 mg of the drug was added to 50ml of each of Glass Distilled Water, 10(M) Urea solution, 20(M) Urea solution, 2(M) Niacinamide solution, 2(M) Sodium Benzoate solution respectively in separate stoppered conical flasks. The flasks were shaken mechanically for 48 hrs at 25±5°C, in a vibratory mechanical shaker. These solutions were next centrifuged for 5 mins at 2000 rpm. The supernatant of each conical flask was separately filtered through Whatman filter paper # 41. The individual filtrates were diluted suitably and analyzed spectrophotometrically against corresponding solvent blank. Enhancement ratio in solubility (Table 1) was also determined by following formula:
Enhancement ratio = Solubility of drug in hydrotropic solution / Solubility of drug in Distilled water. [19]
Preparation of Standard Calibration Curve of Telmisartan by Official HPLC Method
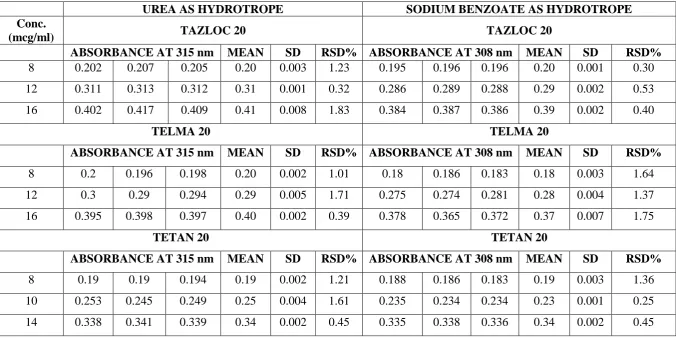
100 mg of Telmisartan pure drug was accurately weighed in a digital balance and transferred into a 100 ml volumetric flask. The drug substance was shaken to dissolve in Methanol of HPLC grade and the volume was made up to the mark with the Mobile Phase (Methanol : Buffer = 70:30). Then the solution was filtered through 0.45 µm membrane filter. From the resulting solution, further dilution was made in mobile phase to obtain a stock solution of 100 µg/ml. Aliquots from the above solution were taken and diluted further in mobile phase to have a set of final concentration e.g. 10µg/ml, 20µg/ml, 30µg/ml, 40µg/ml, 60µg/ml, 80µg/ml of Telmisartan respectively. Each of these drug solutions (20 μl) were injected into the column, and the peak area and retention time were recorded. Evaluation was performed with UV detector at 298 nm and a calibration curve (Fig. 2) was constructed for Telmisartan by plotting the peak area of drug (y - axis) against the concentration of drug (μg/ml) (x - axis).[1]
Preparation Of Standard Calibration Curve of Telmisartan by the Proposed Method
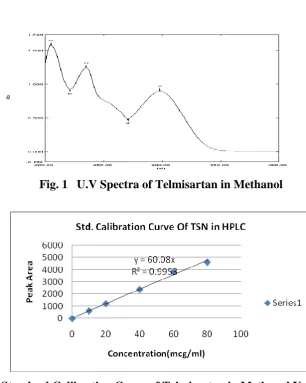
further in glass distilled water to have a set of final concentration e.g. 4.2µg/ml, 8.4µg/ml, 10.5µg/ml, 14.7µg/ml of Telmisartan respectively. These solutions were scanned in the UV - range of 200-400nm against blank. The absorption maxima were found to be 315 nm against solvent blank (Fig. 3). A standard calibration curve (Fig. 4) was prepared for Telmisartan by plotting the absorbance of the drug (y- axis) at 315 nm against corresponding concentration of the drug (µg/ml) (x-axis).[19] The same procedure was repeated with 2(M) Sodium Benzoate. [20 ] (Fig. 5 & 6).
Analysis Of Telmisartan Commercial Tablets by the Official HPLC Method
Tablets of different manufacturer`s were procured from local market. Ten tablets from each of the three brands (TELMA 20, TAZLOC 20, TETAN 20) of Telmisartan 20mg tablets were separately weighed and finely powdered. The powdered tablets were passed through 60# sieve. An accurately weighed quantity of each lot of sieved powder equivalent to 100 mg of Telmisartan was transferred individually to 100 ml volumetric flasks. The mixtures were sonicated for 15mins and then allowed to cool at room temperature. The powdered drug product of each brand was allowed to mix & dissolve in Methanol (HPLC grade) and then the volume in each individual flask was adjusted up to the 100 ml mark with addition of mobile phase (Methanol : Buffer = 70:30). Then the respective solution of each brand from each individual flask was filtered through 0.45µm membrane filter. From each resulting filtrate, further dilution was made in mobile phase to obtain a stock solution of concentration -100µg/ml. Aliquots from each respective solution were taken and diluted further in mobile phase to have a final set of concentration e.g. 20µg/ml, 40µg/ml, 60µg/ml of Telmisartan respectively. 20µl of each sample preparation of the respective three brands were injected into injector (column) of HPLC and the peak area and retention time were recorded. Evaluation was performed with UV detector at 298 nm. From the peak response of Telmisartan (TSN), the drug content in each individual sample of the respective brands was computed.[1]
Formula: % of Sample = (ru/rs) * (cs/cu)*100
Where, ru = peak response of TSN from the sample solution
rs = peak response of TSN from the standard solution
cs = Concentration of USP Telmisartan RS in the standard solution (mg/ml)
Analysis Of Telmisartan Commercial Tablets By The Proposed Method
Tablets of different manufacturer’s were procured from local market. Ten tablets from each of the three brands (TELMA 20, TAZLOC 20, TETAN 20) of Telmisartan 20mg tablets were separately weighed and finely powdered. The powdered tablets were passed through 60# sieve. An accurately weighed quantity of each lot of sieved powder equivalent to 10mg of Telmisartan was transferred individually to 50ml volumetric flasks. To each of these flasks, 40ml of 20(M) Urea solution were added. The mixtures were sonicated for 15mins and then allowed to cool at room temperature. Then the volume in each individual flask was made up to 50 ml mark with glass distilled water to obtain a stock solution of concentration - 200µg/ml. The respective drug product solution of each brand was then kept at vibratory shaker incubator for 24hrs. Then the respective individual solution was filtered through Whatman filter paper # 41. From each of the individual filtrates, aliquot was taken and diluted further in glass distilled water to have a final set of concentration e.g. 8µg/ml, 12µg/ml, 16µg/ml of Telmisartan respectively. Finally, their absorbance was measured at 315nm against the respective reagent blank. The drug content of each branded preparation was calculated using the standard calibration curve.[19] The same procedure was repeated with 2(M) Sodium Benzoate.[20]
Recovery Study Of The Proposed Method
PROPOSED METHOD VALIDATION [19,22,23] Accuracy
Accuracy of the developed method was confirmed by doing recovery study as per official guidelines. For the recovery studies of the proposed method, known amount of pure drug was added to the pre-analyzed powder sample and the mixture was analyzed for the drug content using the proposed method. The result of accuracy study was reported in [Table 5]. From the recovery study it was clear that the proposed method is Accurate for quantitative estimation of Telmisartan in tablet dosage form.
Precision
Precision was determined by studying the repeatability and intermediate precision. Repeatability result indicates the precision under the same operating conditions over a short interval time and inter-assay precision. The standard deviation, coefficient of variance and standard error were calculated. Repeatability was performed for three times with commercial tablets of Telmisartan. The results of % relative standard deviation are given in [Table 6]. Intermediate Precision was studied as intra-day and inter-day variations. Intra-day precision was determined by analyzing the Telmisartan commercial tablets for three times using the concentration range of (8-16) μg/ml in the same day. Inter-day precision was determined by analyzing the same concentration range of solutions daily for three days and the results were recorded. The %RSD of intra-day and inter-day precision was determined and reported in [Table 7&8]. From the data obtained, the developed spectroscopic method was found to be
Precise and Accurate.
Specificity
The specificity of the proposed method was checked for the interference of impurities in the analysis of a drug solution. It was determined by comparing the UV spectra obtained from 100 μg/ml solution of Telmisartan in pure and commercial samples in order to assess the level of interference from excipients and additives used in making commercial dosage forms of the drug. The method was found to be specific as there was no interference of impurities.
Linearity and Range
The Beer- Lambert’s concentration range was found to be (5-20) μg/ml for Telmisartan in both hydrotropes. [Fig.4 & 6, Table 9]
Limit of Detection (LOD) and Limit of Quantitation (LOQ)
Limit of Detection (LOD) and Limit of Quantification (LOQ) were calculated as 3.3 ∂/Sand
10 ∂/S, respectively as per ICH guidelines, where ∂ is the standard deviation of the response and Sis the slope of the calibration plot. The LOD is the smallest concentration of the analyte that gives a measurable response. The LOQ is the smallest concentration of the analyte which gives response that can be quantified accurately. The result of accuracy study was reported in [Table 5]
Ruggedness
It was determined by carrying out the experiment on different instruments and by different operators. It was observed that there were no marked changes in the results, which demonstrated that the spectroscopic method developed, are rugged and robust.
[image:9.595.136.443.373.757.2]RESULTS
Fig. 1 U.V Spectra of Telmisartan in Methanol
[image:9.595.138.427.403.544.2]
Fig. 3 U.V Spectra Of Telmisartan In 20(M)Urea
Fig. 4 Standard Calibration Curve of Telmisartan in 20(M)Urea at 315nm
[image:10.595.102.450.542.731.2][image:11.595.87.490.314.466.2]
Fig. 6 Standard Calibration Curve of Telmisartan in 2(M) Sodium Benzoate at 308nm
Table 1: Solubility of Telmisartan In Different Hydrotropes
Drug Solvent
System*
Solubility (mg/ml)
Temperature (0C)
Enhanced By
Telmisartan DW 0.452 25±5°C
Telmisartan 10(M)UR 5.309 25±5°C 11.74 Telmisartan DW 0.452 25±5°C _ Telmisartan 20(M) UR 8.856 25±5°C 19.59 Telmisartan DW 0.452 25±5°C _ Telmisartan 2(M)NIA 9.417 25±5°C 20.83 Telmisartan DW 0.452 25±5°C _ Telmisartan 2(M)SB 5.113 25±5°C 11.31
*
DW- Distilled Water, UR- Urea, NIA- Niacinamide, SB- Sodium Benzoate
Table 2: Drug Content of Telmisartan brands using HPLC (as per official method in USP)
Brand Label Claim (mg)
% Label Claim Estimated* (Mean ± S.D )
% Co-eff. Of Variation
Standard Error
TELMA 20 99.66 ± 1.36 1.37 0.79 TAZLOC 20 99.30 ± 1.38 1.39 0.80 TETAN 20 99.26 ± 1.25 1.26 0.72 *Average of six determinations
Table 3: Drug Content of Telmisartan brands with 20(M) Urea at 315nm
Brand Label Claim (mg)
% Label Claim Estimated* (Mean ± S.D )
% Co-eff. Of
Variation Standard Error
[image:11.595.67.536.532.613.2]Table 4: Drug Content of Telmisartan brands with 2(M) Sodium Benzoate at 308nm
Brand Label Claim (mg)
% Label Claim Estimated* (Mean ± S.D )
% Coeff. Of Variation
Standard Error
TELMA 20 100.68 ± 1.17 1.16 0.68 TAZLOC 20 100.53 ± 1.05 1.05 0.61 TETAN 20 101.38 ± 2.42 1.39 1.4 *Average of six determinations
Table 5: Recovery Studies For Commercial Tablets Of Telmisartan
Hydrotrope Brand
Label Claim (mg)
Eqv. Amt taken for analysis (mg)
Spike amt of drug added (mg)
Derived amt of drug after analysis
Estimated* (Mean±S.D)
%
Recovery by
analysis
20(M) UREA at 315nm
TELMA 20 5.02 2.5 7.77 ± 0.163 103.32 TAZLOC 20 5.01 2.5 7.78 ± 0.107 103.60 TETAN 20 5.09 2.5 7.59 ± 0.141 100.00 2(M) SODIUM
BENZOATE at 308nm
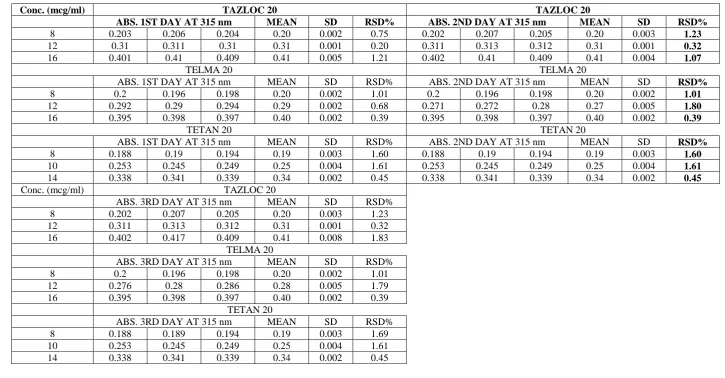
Table 6: Data For Repeatability For Commercial Tablets Of Telmisartan
UREA AS HYDROTROPE SODIUM BENZOATE AS HYDROTROPE
Conc.
(mcg/ml) TAZLOC 20 TAZLOC 20
ABSORBANCEAT 315 nm MEAN SD RSD% ABSORBANCE AT 308 nm MEAN SD RSD%
8 0.202 0.207 0.205 0.20 0.003 1.23 0.195 0.196 0.196 0.20 0.001 0.30 12 0.311 0.313 0.312 0.31 0.001 0.32 0.286 0.289 0.288 0.29 0.002 0.53 16 0.402 0.417 0.409 0.41 0.008 1.83 0.384 0.387 0.386 0.39 0.002 0.40
TELMA 20 TELMA 20
ABSORBANCE AT 315 nm MEAN SD RSD% ABSORBANCE AT 308 nm MEAN SD RSD%
8 0.2 0.196 0.198 0.20 0.002 1.01 0.18 0.186 0.183 0.18 0.003 1.64 12 0.3 0.29 0.294 0.29 0.005 1.71 0.275 0.274 0.281 0.28 0.004 1.37 16 0.395 0.398 0.397 0.40 0.002 0.39 0.378 0.365 0.372 0.37 0.007 1.75
TETAN 20 TETAN 20
ABSORBANCE AT 315 nm MEAN SD RSD% ABSORBANCE AT 308 nm MEAN SD RSD%
Table 7.1 : Data for Intra-day precision for Commercial Brands of Telmisartan tablets with 20(M)Urea as Hydrotrpe
Conc. (mcg/ml) TAZLOC 20 TAZLOC 20
ABS. 2ND HR AT 315 nm MEA
N SD RSD% ABS. 4TH HR. AT 315 nm MEAN SD RSD%
8 0.201 0.204 0.204 0.20 0.002 0.85 0.201 0.208 0.205 0.20 0.004 1.72
12 0.32 0.31 0.31 0.31 0.006 1.84 0.309 0.315 0.312 0.31 0.003 0.96
16 0.401 0.41 0.409 0.41 0.005 1.21 0.405 0.412 0.409 0.41 0.004 0.86
TELMA 20 TELMA 20
ABS. 2ND HR AT 315 nm MEAN SD RSD% ABS. 4TH HR. AT 315 nm MEAN SD RSD%
8 0.198 0.196 0.198 0.20 0.001 0.59 0.2 0.198 0.198 0.20 0.001 0.58
12 0.291 0.292 0.294 0.29 0.002 0.52 0.274 0.276 0.28 0.28 0.003 1.10
16 0.394 0.396 0.397 0.40 0.002 0.39 0.398 0.398 0.397 0.40 0.001 0.15
TETAN 20 TETAN 20
ABS. 2ND HR AT 315 nm MEAN SD RSD% ABS. 4TH HR. AT 315 nm MEAN SD RSD%
8 0.188 0.189 0.194 0.19 0.003 1.69 0.197 0.195 0.198 0.20 0.002 0.78
10 0.252 0.243 0.249 0.25 0.005 1.85 0.279 0.28 0.286 0.28 0.004 1.34
14 0.336 0.343 0.339 0.34 0.004 1.03 0.391 0.397 0.397 0.40 0.003 0.88
TAZLOC 20
ABS. 6TH HR. AT 315 nm MEAN SD RSD%
8 0.188 0.189 0.194 0.19 0.003 1.69
12 0.252 0.243 0.249 0.25 0.005 1.85
16 0.336 0.343 0.339 0.34 0.004 1.03
TELMA 20
ABS. 6TH HR. AT 315 nm MEAN SD RSD%
8 0.189 0.19 0.194 0.19 0.003 1.39
12 0.252 0.247 0.249 0.25 0.003 1.01
16 0.332 0.342 0.339 0.34 0.005 1.52
TETAN 20
ABS. 6TH HR. AT 315 nm MEAN SD RSD%
8 0.19 0.189 0.194 0.19 0.003 1.39
10 0.255 0.248 0.249 0.25 0.004 1.51
Table 7.2 : Data for Intra-day precision for Commercial Brands of Telmisartan tablets with 2(M)Sodium Benzoate as Hydrotrope
Conc.
(mcg/ml) TAZLOC 20 TAZLOC 20
ABS. 2ND HR AT 308 nm MEAN SD RSD% ABS. 4TH HR. AT 308 nm MEAN SD RSD%
8 0.193 0.199 0.196 0.20 0.003 1.53 0.19 0.196 0.196 0.19 0.003 1.79
12 0.283 0.29 0.288 0.29 0.004 1.26 0.287 0.289 0.288 0.29 0.001 0.35
16 0.38 0.385 0.386 0.38 0.003 0.84 0.384 0.387 0.386 0.39 0.002 0.40
TELMA 20 TELMA 20
ABS. 2ND HR AT 308 nm MEAN SD RSD% ABS. 4TH HR. AT 308 nm MEAN SD RSD%
8 0.181 0.185 0.183 0.18 0.002 1.09 0.181 0.186 0.183 0.18 0.003 1.37
12 0.272 0.276 0.281 0.28 0.005 1.63 0.271 0.274 0.281 0.28 0.005 1.86
16 0.375 0.364 0.372 0.37 0.006 1.54 0.373 0.363 0.372 0.37 0.006 1.49
TETAN 20 TETAN 20
ABS. 2ND HR AT 308 nm MEAN SD RSD% ABS. 4TH HR. AT 308 nm MEAN SD RSD%
8 0.182 0.186 0.183 0.18 0.002 1.13 0.185 0.186 0.183 0.18 0.002 0.83
10 0.23 0.232 0.234 0.23 0.002 0.86 0.233 0.236 0.234 0.23 0.002 0.65
14 0.332 0.336 0.336 0.33 0.002 0.69 0.33 0.335 0.336 0.33 0.003 0.96
Conc.
(mcg/ml) TAZLOC 20
ABS. 6TH HR. AT 308 nm MEAN SD RSD%
8 0.19 0.197 0.196 0.19 0.004 1.95
12 0.285 0.288 0.288 0.29 0.002 0.60
16 0.381 0.388 0.386 0.39 0.004 0.94
TELMA 20
ABS. 6TH HR. AT 308 nm MEAN SD RSD%
8 0.183 0.185 0.183 0.18 0.001 0.63
12 0.273 0.273 0.281 0.28 0.005 1.68
16 0.374 0.365 0.372 0.37 0.005 1.28
TETAN 20
ABS. 6TH HR. AT 308 nm MEAN SD RSD%
8 0.181 0.187 0.183 0.18 0.003 1.66
10 0.231 0.235 0.234 0.23 0.002 0.89
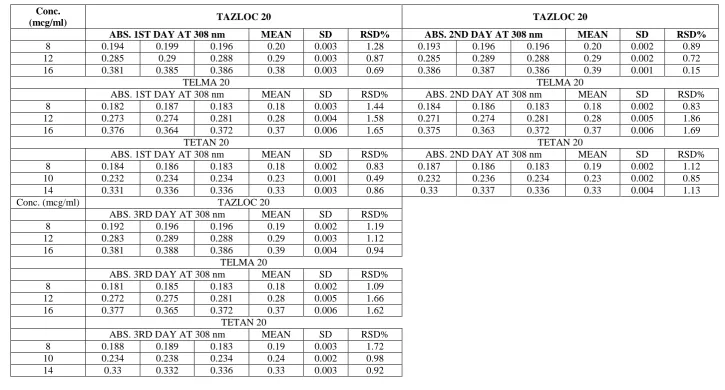
Table 8.1 : Data for Inter-day precision for Commercial Brands Of Telmisartan tablets with 20(M) Urea
Conc. (mcg/ml) TAZLOC 20 TAZLOC 20
ABS. 1ST DAY AT 315 nm MEAN SD RSD% ABS. 2ND DAY AT 315 nm MEAN SD RSD%
8 0.203 0.206 0.204 0.20 0.002 0.75 0.202 0.207 0.205 0.20 0.003 1.23
12 0.31 0.311 0.31 0.31 0.001 0.20 0.311 0.313 0.312 0.31 0.001 0.32
16 0.401 0.41 0.409 0.41 0.005 1.21 0.402 0.41 0.409 0.41 0.004 1.07
TELMA 20 TELMA 20
ABS. 1ST DAY AT 315 nm MEAN SD RSD% ABS. 2ND DAY AT 315 nm MEAN SD RSD%
8 0.2 0.196 0.198 0.20 0.002 1.01 0.2 0.196 0.198 0.20 0.002 1.01
12 0.292 0.29 0.294 0.29 0.002 0.68 0.271 0.272 0.28 0.27 0.005 1.80
16 0.395 0.398 0.397 0.40 0.002 0.39 0.395 0.398 0.397 0.40 0.002 0.39
TETAN 20 TETAN 20
ABS. 1ST DAY AT 315 nm MEAN SD RSD% ABS. 2ND DAY AT 315 nm MEAN SD RSD%
8 0.188 0.19 0.194 0.19 0.003 1.60 0.188 0.19 0.194 0.19 0.003 1.60
10 0.253 0.245 0.249 0.25 0.004 1.61 0.253 0.245 0.249 0.25 0.004 1.61
14 0.338 0.341 0.339 0.34 0.002 0.45 0.338 0.341 0.339 0.34 0.002 0.45
Conc. (mcg/ml) TAZLOC 20
ABS. 3RD DAY AT 315 nm MEAN SD RSD%
8 0.202 0.207 0.205 0.20 0.003 1.23
12 0.311 0.313 0.312 0.31 0.001 0.32
16 0.402 0.417 0.409 0.41 0.008 1.83
TELMA 20
ABS. 3RD DAY AT 315 nm MEAN SD RSD%
8 0.2 0.196 0.198 0.20 0.002 1.01
12 0.276 0.28 0.286 0.28 0.005 1.79
16 0.395 0.398 0.397 0.40 0.002 0.39
TETAN 20
ABS. 3RD DAY AT 315 nm MEAN SD RSD%
8 0.188 0.189 0.194 0.19 0.003 1.69
10 0.253 0.245 0.249 0.25 0.004 1.61
Table 8.2 : Inter-day precision For Commercial Brands Of Telmisartan With 2(M) Sodium Benzoate
Conc.
(mcg/ml) TAZLOC 20 TAZLOC 20
ABS. 1ST DAY AT 308 nm MEAN SD RSD% ABS. 2ND DAY AT 308 nm MEAN SD RSD%
8 0.194 0.199 0.196 0.20 0.003 1.28 0.193 0.196 0.196 0.20 0.002 0.89
12 0.285 0.29 0.288 0.29 0.003 0.87 0.285 0.289 0.288 0.29 0.002 0.72
16 0.381 0.385 0.386 0.38 0.003 0.69 0.386 0.387 0.386 0.39 0.001 0.15
TELMA 20 TELMA 20
ABS. 1ST DAY AT 308 nm MEAN SD RSD% ABS. 2ND DAY AT 308 nm MEAN SD RSD%
8 0.182 0.187 0.183 0.18 0.003 1.44 0.184 0.186 0.183 0.18 0.002 0.83
12 0.273 0.274 0.281 0.28 0.004 1.58 0.271 0.274 0.281 0.28 0.005 1.86
16 0.376 0.364 0.372 0.37 0.006 1.65 0.375 0.363 0.372 0.37 0.006 1.69
TETAN 20 TETAN 20
ABS. 1ST DAY AT 308 nm MEAN SD RSD% ABS. 2ND DAY AT 308 nm MEAN SD RSD%
8 0.184 0.186 0.183 0.18 0.002 0.83 0.187 0.186 0.183 0.19 0.002 1.12
10 0.232 0.234 0.234 0.23 0.001 0.49 0.232 0.236 0.234 0.23 0.002 0.85
14 0.331 0.336 0.336 0.33 0.003 0.86 0.33 0.337 0.336 0.33 0.004 1.13
Conc. (mcg/ml) TAZLOC 20
ABS. 3RD DAY AT 308 nm MEAN SD RSD%
8 0.192 0.196 0.196 0.19 0.002 1.19
12 0.283 0.289 0.288 0.29 0.003 1.12
16 0.381 0.388 0.386 0.39 0.004 0.94
TELMA 20
ABS. 3RD DAY AT 308 nm MEAN SD RSD%
8 0.181 0.185 0.183 0.18 0.002 1.09
12 0.272 0.275 0.281 0.28 0.005 1.66
16 0.377 0.365 0.372 0.37 0.006 1.62
TETAN 20
ABS. 3RD DAY AT 308 nm MEAN SD RSD%
8 0.188 0.189 0.183 0.19 0.003 1.72
10 0.234 0.238 0.234 0.24 0.002 0.98
Table 9 : Validation Parameters & Optical Characteristics of The Proposed Method
Parameters 20(M) Urea 2(M) Sodium Benzoate
Established λmax (nm)
Beer’s limit (µg/ml) (Linearity) Correlation Coefficient (r2)* Regression Equation* Intercept*
Slope*
LOD*(µg/ml) LOQ*(µg/ml) Intra-day* (CV) Inter-day* (CV) Robustness Ruggedness
315nm 308nm (5-20) (5-20) 1 1
0.0235x+0.0055 0.0221x+0.01 0.0055 0.01
0.0235 0.0221 0.575 0.406 1.745 1.231
0.15-1.85 % 0.35-1.95 % 0.20-1.83 % 0.15-1.86 % Robust (% RSD < 2) (% RSD < 2)
Rugged Rugged
*Mean of 6 determinations; CV= Coefficient of Variation; RSD= Relative standard deviation
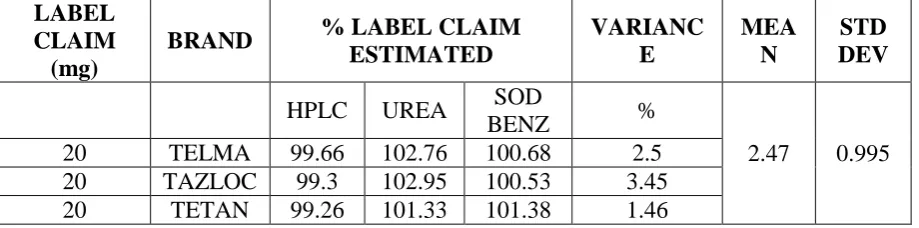
Table 10: Comparison of drug content of Telmisartan brands using Official Method (as per USP) vs the Developed Method
LABEL CLAIM
(mg)
BRAND % LABEL CLAIM
ESTIMATED VARIANC E MEA N STD DEV
HPLC UREA SOD
BENZ %
2.47 0.995 20 TELMA 99.66 102.76 100.68 2.5
20 TAZLOC 99.3 102.95 100.53 3.45 20 TETAN 99.26 101.33 101.38 1.46
Table 11: Calculation of ANNOVA and VARIANCE between different brands of Telmisartan 20mg tablets
Brands Sample Count Sum Avg. % Estimated Variance Within Brand
TELMA 3 303.1 101.03 2.50 TAZLOC 3 302.78 100.92 3.45 TETAN 3 301.97 100.65 1.46
Source of Variation SS df= (N-1) MS=SS/df F calculated P- value FCV
Between Brands 0.22 2 0.11 0.045 0.95 5.14
Within Brands 14.81 6 2.46 Total Variation 15.04 8
[image:18.595.67.531.573.704.2]The Critical Value of F
To find the critical value from an F distribution, the numerator (MSTR) and denominator (MSE) degrees of freedom, along with the significance level. FCV has df1 and df2 degrees of
freedom, where df1 is the numerator degrees of freedom equal to C-1 and df2 is the denominator degrees of freedom equal to N-C. [C = no of brands (3) & N = Total nos. of analytical methods applied (3 concentration ranges of each of three brands)] In our example, df1 = (3 – 1) = 2 and df2 = (3*3 – 3) = 6. Hence we need to find F CV2,6 corresponding to α
= 5%. [Using the F tables in reference text, it was observed that F CV2,6 = 5.143253]
Decision Rule
We reject the null hypothesis if: F (observed value) > FCV (critical value).
We accept the null hypothesis if: F (observed value) < FCV (critical value).
Final decision
In this case, F (observed value) is 0.46 and FCV (critical value) is 5.14. Hence we accept the
Hypothesis that there is significant similarity between the analytical methods applied with P value <1.
DISCUSSION
Drug content was estimated using the proposed method which had been ranged as percent label claim from 101.33 ± 1.46 to 102.95 ± 0.95 and from [Table 4], it was found that ranged from 101.38 ± 2.42 to 100.68 ± 1.17. Since the % label claims are within specified limit (90.0% to 110%) of official Pharmacopoeal monograph of Telmisartan tablets (ref. USP 2011), the proposed method can be described as accurate and gets further validated statistically by low values of standard deviation, % coefficient of variation and standard error. The result of recovery studies (presented in Table 5) indicates that % recovery estimated with Urea ranged from (100% to 103.60%) and that with Sodium Benzoate ranged from (100.13% to 103.73%) by use of proposed method. Since the percent recovery values are within specified limit (90.0% to 110%) of official Pharmacopoeal monograph of Telmisartan tablets (ref. USP 2011), this indicates the accuracy of the proposed method. Values of standard deviation, % coefficient of variation and standard error are satisfactorily low and confirm further the accuracy, reproducibility, precision of the proposed method. Results for repeatability and precision (intra and inter day) were presented in [Table 6-8]. [Table 9] shows the optical characteristics of the proposed method. [Table10] presents a comparative study for the analysis of commercial brands of Telmisartan using the Official Pharmacopoeal Method with that of the developed method. [Table 11&12] represents the results for the Annova Single Factor and Variance between the commercial brands of Telmisartan comparing the official method of analysis with that of the developed method which concludes that the methods are significant. From this study, it is obvious that there was no interference of Urea and Sodium Benzoate in the estimation of Telmisartan (λ-max–298 nm). Urea and Sodium Benzoate does not interfere above 250 nm and 300 nm respectively. Just like Telmisartan as model drug (poorly water soluble or practically insoluble), a large number of poorly water-soluble drugs having λ-max above 300 nm may be tried for estimation by the proposed method provided that their preliminary solubility studies are conducted to observe the enhancement effect on solubility in order to preclude the use of organic solvents.
CONCLUSION
precluded but not at the expense of accuracy. The proposed method is worth adopting in Pharmacopoea. By proper choice of hydrotropic agents, the use of organic solvents in analysis may be discouraged to a large extent. The proposed method shall prove equally effective to analyze Telmisartan in the corresponding drug sample and may prove to be of great importance in pharmaceutical analysis. There is a good scope for other poorly water soluble drugs which may be tried to get solubilized by suitable hydrotropic agents to carry out their spectrophotometric analysis excluding the use of costlier and unsafe organic solvents.
REFERENCES
1. USP, Revision Bulletin, Official July 1, 2011.
2. Essentials Of Medical Pharmacology. K.D.Tripathi. 4th Edition.
3. Mahavir Chhajed., et al. New Quantitative Estimation Of Acetazolamide Bulk Sample Using Hydrotropic Solubilizing Agents. WJPR Vol 1, Issue 1, 50-57, ISSN : 2277-7105.
4. Maheshwari RK, Maheshwari RB, Bhatt P. Simultaneous Spectrophotometric estimation of norfloxacin and tinidazole in two component tablet formulations. Asian J Chem, 2006; 18:1481-1486.
5. Aditya Narayan Jhariya., et al. Application Of Sodium Citrate As Hydrotropic Agent In Spectrophotometric Analysis Of Salicylic Acid. International Journal Of Recent
Advances In Pharmaceutical Research. January 2013; 3(1) : 36-38.
6. Maheshwari RK, Rathore A, Agrawal A. New Spectrophotometric method to determine Ketoprofen in tablet dosage form using mixed Hydrotropy. Int J of Chem and Analytical Sci.2010;1(4):62-63.
7. Kim JY, Kim S, Papp M, Park K, Pinal R. Hydrotropic Solubilization of Poorly Water- Soluble Drugs. J of pharm sci. 2010; 99(9): 3953-3956.
8. Bhawsar N, Maheshwari RK, Ansari A, Saktawat Y. New spectrophotometric estimation of Gatifloxacin in the tablets using mixed solvency approach. Int J Pharm and Bio Sci. 2011;2(2):270-274.
10.Pandey S, Maheshwari RK. A novel spectroscopic method for the estimation of ketoprofen in tablet dosage form using hydrotropic solubilizitation phenomenon. Middle East J of Sci Res. 2010;6(3):209-212.
11.Maheshwari RK. Application of hydrotropic solubilization phenomenon in spectro photo metric estimation of norfloxacin in tablets. Indian J Pharm Educ Res. 2006;40(4):2005:237-240.
12.Neha Sharma., et al. Hydrotropy. IJPPR, Volume 2, Issue 4, December- 2011 ISSN NO : 0976-6723.
13.Rajawardhan Reddy.M., et al. A review on hydrotropy. JPR, ISSN: 2319-5622. 14.Gaikar V.G. et al.; Drug Dev. Ind. Pharm., 1997; 23(2): 309-312.
15.Badwan A.A. et al.; International Journal of Pharmacy, 1983, 13, 67-73. 16.C. Neuberg.; Biochem. Z., 1961, 76, 107-109.
17.Poochikian G.K. et al.; Journal of Pharmaceutical Sciences, 1979, 68, 728-729. 18.R.K. Maheshwari, M. Singh.; Asian Journal Of Chemistry, 2008, 20, 6, 4922-4924. 19.Shyni Bernard., et al. Validated spectrophotometric method of estimation of Rosuvastatin
by using hydrotropic solubilization. Asian Jounal Of Pharmaceutical and Health Sciences.
20.N. Nagendra Gandhi., et al. New quantitative estimation of Famotidine using hydrotropic solubilizing agents. International Journal Of Pharmacy and Pharmaceutical Science
Research ISSN : 2249-0337.
21.Deepak N. Patil. Spectroscopic determination of Lovastatin by hydrotropic solubilization technique. International Journal OfPharmaceutical and Chemical Sciences ISSN: 2277-5005.
22.Sanap et al., Novel And Validated Spectrophotometric Determination Of Budesonide From Bulk And Tablets Using Mixed Hydrotropic Solubilization Technique. IJPSR, 2011; Vol. 2(9) : 2419-2423, ISSN : 0975-8232.