EVALUATING THE OUTCOME OF TRANSFORMING
GENETICALLY MODIFIED
E.COLI
CELLS WITH HUMAN
COAGULANT FACTOR IX CDNA
Emmanuel Paul Okoi*, Gregory Elayeche Oko and Khuyen Thi Kim Vo
1
Department of Genetics and Biotechnology, Faculty of Biological Sciences, University of
Calabar; Nigeria, PMB 1115 Calabar.
2
Department of Biochemistry, College of Medical Sciences, University of Calabar; Nigeria,
PMB 1115 Calabar.
3
Department of Biosciences and Chemistry, Sheffield Hallam University, Sheffield, S1 1WB
UK.
ABSTRACT
Haemophilia B is a rare but severe genetic blood disorder that result in
the malfunctioning of the gene that codes for the expression of human
factor IX proteins in the coagulation cascade thus leading to an
imbalance in haemostatic regulation of blood clot in damage blood
vessels. The primary aim of this study was to clone the coding
sequence of human factor IX into a bacterial vector (pETBlue 2
plasmid) for transient expression of hFIX protein in E.coli cells. RNA
extraction from HepG2 cells was carried out from which aliquots
obtained were used for cDNA synthesis using M-MLV Reverse
transcriptase enzyme. Synthesised cDNA sample was subjected to
PCR analysis with different annealing temperatures (57⁰C, 55⁰C,52⁰
and 50⁰C) for amplification of hFIX coding sequence using primers
designed from the coding sequence. Sucessful transformation of E.coli cells was observed
through the blue and white screening analysis of colonies. Evidence for transcient expression
of hFIX protein in E.coli could not be ascertain as at the time of this research.
INTRODUCTION
The human coagulation cascade encompasses series of relatively indispensable proteins
required for the formation of blood clots in response to injury or damaged blood vessels.
Volume 7, Issue 6, 80-97. Research Article ISSN 2277– 7105
Article Received on 27 Jan. 2018,
Revised on 17 Feb. 2018, Accepted on 09 March 2018,
DOI: 10.20959/wjpr20186-11514
*Corresponding Author
Emmanuel Paul Okoi Department of Genetics
and Biotechnology,
Faculty of Biological
Sciences, University of
Calabar; Nigeria, PMB
Within this cascade exist an important vitamin K-dependent hydrophilic protease called
coagulation factor IX (Chavali et al, 2008). This single chain glycoprotein is synthesised and
secreted into the blood stream in an inactive state as a proenzyme classified under the
peptidase family S1 (Christophe et al, 2001). The coagulation factor IX is circulated in the
bloodstream as a zymogen prior to injury or damage of blood vessels (Kulkarni and lusher,
2001). The utterly matured factor IX zymogen structurally comprises of eight exons which
constitute; a signalling peptide located at the amino terminal region, a glutamic acid domain,
two epidermal growth factor domains (EGF1 and EGF2), activation peptide region which is
discarded once the inactive factor IX is activated and a catalytic domain located at the
carboxyl terminal which controls protease activity (Schwartz et al, 2007).
The ability of the body’s haemostatic system to regulate the coagulation cascade can be
altered when a mutation occurs in genes coding for the expression of protease found within
the coagulation cascade thus resulting in bleeding disorders (Mackman et al, 2007). This
includes haemophilia A, disorders of fibrinogen and haemophilia B which directly relates
with the deficiency of factor IX. The effectiveness of factor IX in the coagulation cascade
relies on the state of the FIX gene that codes for its expression.
Haemophilia B is a bleeding disorder and a recessive X-linked genetic disease that is
transmitted from parents to offspring and found within the family pedigree (Peters et al,
2010). This is caused by heterogeneous mutations that occurs within FIX gene segment
located at band Xq27 of the X-chromosome and constitutes 8 exons and 7 introns (Verma et
al, 2010). The altered FIX protein is ineffective in blood coagulation cascade and cannot
initiate blood clot at the site of vascular injury (Kay et al, 2000).
Mutations in FIX gene can either cause the synthesis of completely inactive copies of FIX or
limit the production of FIX (Collins et al, 2010). Haemophilia B can be severe or moderate.
Severe haemophilia B occurs when the change in FIX gene structure causes total destruction
of its function while, moderate haemophilia B is as a result of incomplete elimination of FIX
activity (Mankor-Johnson et al, 2007). Treatment of individuals suffering from haemophilia
B has evolved over the years. However, FIX deficiency still remains one of the largely
neglected bleeding disorders due to its low incidence rate of 15-20% of all cases of
Most frequently used treatment for FIX deficiency involves lifelong intravenous infusion of
recombinant FIX concentrates or plasma-derived FIX proteins (Nathwani et al, 2014). This
requires rigorous screening of human plasma derived from donors to prevent viral
contaminants like HIV, hepatitis A, B and C and other blood transmitted viruses (Nathwani et
al, 2001). This treatment measure has only proven to be effective in the prevention of sudden
bleeding episodes but lacks a long lasting curative potentials and its harmful due to prolonged
regular injections (Nathwani et al, 2014). Intravenous administration of FIX concentrates
requires an average cost of $250,000 per year for each patient which is usually unaffordable
by most Haemophilia B patients and results in decrease in life expectancy (Gringeri et al,
2003).
However E.coli cells have proven to be a reliable and cheaper host systems used as a tool for
production of useful proteins. Although further protein modifications techniques are required
to avoid inclusion bodies.
In this research, it is expected that the amplified gene of interest (hFIX) will be successfully
used to create multiple copies of recombinant hFIX for transient expression in E. coli cells
(vector system) which will be examined and documented for future research.
MATERIALS AND METHODS
Primers Design: Forward and reverse primers were designed using the nucleotide database of the NCBI website. This was achieved by designing primers from nucleotide sequences for
each of the 8 exons. The following primers were used as shown below:
Exon 2 Forward primer: 5’ TCAGTGCTGAATGTACAGTTTTTTCT 3’ (25bp) Exon 2 Reverse primer: 5’ TCTCCATCAACATACTGCTTCCA 3’ (23bp)
Expected product length from both exon 2 primers is 213 base pairs.
Exon 6 Forward primer: 5’ TGTGAACCAGCAGTGCCATT 3’ (20bp) Exon 6 Reverse primer: 5’ ACAACCTGCCAAGGGAATTGA 3’ (21bp)
Expected product length from both exon 6 primers is 222 base pairs. CDS Forward primer: 5’ GTTATGCAGCGCGTGAACAT 3’ (20bp) CDS Reverse primer: 5’ TCCATCTTTCATTAAGTGAGCTTTG 3’ (25bp)
Expected product length from both coding sequence primers is 1420 base pairs.
fetal bovine serum and 100 units/ml penicillin plus 100 µg/ml streptomycin for 4 days to
obtain a suitable confluence level of 70% - 80% for RNA extraction. Cell passaging was
repeated at intervals to keep the cells growing throughout the duration of laboratory sections
using the HepG2 cell passaging kit. Spent media from T75 flask containing HepG2 cells was
discarded and cells were washed with 10ml Phosphate Buffered Saline to allow for
trypsinization. Detached HepG2 cells were transferred into 50ml falcon tube and then 3 ml of
fresh media (an equal volume of trypsin) was added to inhibit trypsin activity. Cells were
centrifuged at 1000 rpm. Thereafter, the supernatant was discarded and pelleted cells were
re-suspended in 6 ml of media from which 1 ml of re-re-suspended cells was added into sterile T75
flask containing 30 ml of culture medium. HepG2 cells in T75 flasks were visualised under
the microscope to determine the presence and volume of cells in the flask. Flasks with
adequate volumes of cells were incubated under 37⁰C for next harvesting section.
RNA Extraction Analysis: Sub-cultured HepG2 cells with 70% growth confluence were used for RNA extraction, the media was discarded and treated with 7.5ml of TRIzol®
reagent. The Homogenized and lysed cells sample was incubated at room temperature for 5
minutes to allow for complete dissociation of the nucleoprotein complex (Chen et al, 2014).
Phase separation was achieved by centrifugation at 12,000 x g and the aqueous phase was
removed for RNA isolation through RNA precipitation, purification and resuspension using
the RNA extraction kit.
Spectrophotometric Analysis: Extracted total RNA from HepG2 cell line was used to run spectrophotometric analysis to determine the concentration of RNA being extracted to
ascertain volume of Total RNA to be used for cDNA synthesis. Readings were done using 50
µl RNA extracts in cuvette tubes.
Complementary DNA Synthesis: First strand cDNA synthesis was done using mRNAs from coagulant factor IX. 4-6µl of total RNA extract was used alongside 2µl of oligo
d(T)20VN primer (50µM), reaction Mix buffer, Moloney Murine Leukemia Virus (M-MLV)
Reverse Transcriptase and nuclease free water. Also, a negative control was prepared by
excluding the addition of the Reverse Transcriptase enzyme in the control sample. Gene
specific primer was also used to derive gene specificity in cDNA synthesis. The synthesis
Amplification of Factor IX cDNAs by Polymerase Chain Reaction: Synthesised cDNAs of factor IX coding sequence derived from human liver cells with GenBank accession
number NM_000133.3 was subjected to PCR amplification with the help of suitable reverse
and forward primers as described by Rech et al (2008). Three samples were used for PCR
analysis. The first sample contained the cDNA, the second sample contained the total RNA
extract without reverse transcriptase (negative control 1 (-RT)), and the third sample being
PCR positive control was void of template DNA with an equivalent volume (4µl) of sterile
water to replace the template DNA. All three samples were run on a PCR machine for 30
cycles at varying annealing temperatures. PCR products were analysed for amplification
through gel electrophoresis stained with ethidium bromide.
Analysis of PCR Product by Gel Electrophoresis: PCR products from HepG2 cells cDNA clones were subsequently subjected for analysis using agarose gel electrophoresis. 1x
concentrate of Tris-acetate running buffer was prepared from 10x Tris-acetate stock solution
and was used to prepare 1%(10mg/ml) pre-stained agarose gel. The gel was placed in the
steamer and allowed to completely dissolve. Thereafter, the partially cooled gel was stained
with 10mg/ml ethidium bromide and was poured into the gel mould and allowed to solidify.
The gel tank was then filled with 1X TAE buffer after which PCR products to be analysed
were mixed with loading buffer (0.25 % bromophenol blue) and samples were carefully
loaded into the wells. Gels were run at 80v -103V for 50 - 60 minutes and were then
visualised using UV light trans-illuminator.
Inoculation of E. coli Cells for Plasmid DNA Extraction: E. coli bacteria strain having the pETBlue 2 plasmid was plated on L agar containing 10mg/ml ampicillin solution for
selective growth of only strains with the pETBlue 2 plasmid having the ampicillin resistance
gene for selectivity. E. coli cells were cultured under 37⁰C in an incubator and left for 16hrs
after which a colony was subcultured in L broth medium for 3hrs. Volumes of inoculated E.
coli cells in L broth were used to determine the exponential growth phase by measuring the
absorbance rate of UV light from spectrophotometer at an interval of 30 minutes until an
absorbance of 400nm is achieved. E. coli cells in exponential phase were subjected to
plasmid DNA extraction and purification protocols as described by the miniprep kit.
Extracted plasmid DNA were authenticated using gel electrophoresis to determine if the size
Preparation of Competent E. coli Cells for Transformation: The ability of the E. coli cell strain to take up recombinant plasmid was tested by determining the cells ability to take up
non recombinant pETBlue 2 plasmid. Cell were allowed the get to exponential growth phase
and determined by optical density of 0.45nm. Thereafter, cells were treated with 5ml 0.1 M
of MgCl₂ and CaCl₂ respectively to make their cell walls permeable for the uptake of
plasmid DNA as described by panja et al, (2006). Treated cells were cultured in L broth
medium containing 10µl of pETBlue 2 plasmid and incubated for 40 minutes under 37⁰C.
Thereafter, 6µl of the inoculum was spread on culture plates containing L agar with 800µl of
ampicillin. This was incubated for 48 hours under 37⁰C to allow for maximum uptake of
plasmid DNA.
RESULTS
Determination of Size and Purity of Extracted RNAs from HepG2 Cells: For accuracy of results in gene expression analysis and creation of cDNA libraries of desired genes, it is
always essential to authenticate the isolation of intact RNA as most techniques involving
priming with oligo(dt) demands the utilisation of RNA extracts with high stability.Aliquot of
total RNA from cultured HepG2 cell line showed clear 28S and 18S rRNA bands respectively
when run on a denaturing agarose gel stained with 10mg/ml ethidium bromide alongside with
aliquot of a 100 base pair marker as shown in figure (1) below.
[image:6.595.148.445.471.674.2]Clear and visible 28S rRNA band was twice as thick as the 18S rRNA band as shown in
figure 1, lane 3 above. The 2:1 intensity ratio of the bands is an indication that the extracted
RNA is intact and stable as unstable and degraded RNA will have smeared appearance
lacking visible bands across the gel (Becker et al, 2010). The visibility of the bands is likely
due to the concentration of RNA aliquot that was run on gel, the duration (50min) and
voltage (100V) of gel electrophoresis. A concentration of 100µg/ml of total RNA was used
for gel electrophoresis.
cDNA Synthesis and Optimization of Human Factor IX Nucleotide Sequence: Synthesis of cDNAs from aliquots of intact RNA yielded varying PCR products due to effects of
varying temperature on enzyme activity and elimination of secondary structures. It was
observed while using the M-MLV Reverse Transcriptase for cDNA synthesis that the higher
the temperature for enzyme activity, the greater the possibility of yielding cDNA clones from
which the quality of PCR product through amplification partially depends. This is because the
elimination of secondary structures is important and usually achieved at a temperature level
of 70⁰C, lower temperatures below 70⁰C for reverse transcriptase enzyme activity might lead
to the formation of hydrogen bonds thus resulting in the formation of secondary structures.
However, the possibility of reformation of secondary structures during cDNA synthesis is
high when there is significant decrease in temperature from the 70⁰C initial temperature for
denaturation of RNA thus limiting cDNA synthesis. The production of human factor IX
cDNA library using (M-MLV) Reverse Transcriptase at 42⁰C resulted in the degradation of
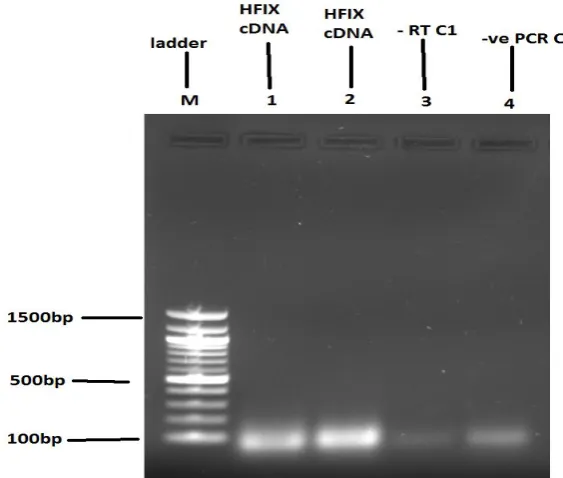
RNA and formation of primer dimers as shown in Figure (2).
[image:7.595.150.444.540.719.2]primers designed from exon 2) and lane 2 (composed of primers designed from exon 6. Bands from DNA marker can be visibly seen in lane (M). Lane 3 represents the negative (-RT) control sample 1 with aliquots of total RNA without reverse transcriptase showing no band formation. Lane 4 represent PCR control 2 with no visible band formation as no template DNA was added to it.
The above PCR product was obtained at an annealing temperature of 57⁰C. Further
optimization of PCR yielded similar results at varying annealing temperatures of 55⁰C, 52⁰C
and 50⁰C as shown in Figure (3), depicting that the quality of cDNA product might be void
of synthesised complementary DNA sequence of factor IX gene as no visible bands were
seen on gel to ascertain gene amplification.
FIGURE 3: Gel electrophoresis showing no visible cDNA amplification of hFIX gene. Lane 1 (hFIX cDNA with primers designed from exon 2), 2 (hFIX cDNA with primers designed from exon 6), 3 (negative control (-RT) 1 without reverse transcriptase) and 4 (PCR control 2 without template DNA) shows degradation of nucleic acids and formation of primer dimers.
cDNA samples used for amplification prior to PCR optimization were obtained at 42⁰C of
enzyme activity (M-MLV Reverse Transcriptase) and thus hindered PCR optimization
because the PCR analysis is highly dependent on the quality of cDNA. However, the
[image:8.595.151.433.312.551.2]initial 42⁰C to 70⁰C at an annealing temperature of 50⁰C showed positive. Results obtained
from gel electrophoresis showed successful amplification of factor IX cDNA sequence (with
band size of 1432bp) and plasmid digest when compared with BstEll digest of phage-DNA
[image:9.595.149.448.173.453.2]marker as shown in Figure (4) below.
Figure 4: Gel electrophoresis showing band sizes of Lambda/BstEII DNA Marker (line 1), PCR reaction with amplified hFIX cDNA (line 3), PCR Digest with restriction enzymes (line 4), Uncut plasmid (line 5) and plasmid Digest with restriction enzymes (line 6).
product/PCR digest (digested with FspI and EcoRI restriction enzymes) of the hFIX cDNA
showed visible thick and light band sizes of approximately 1432bp respectively thus
indicating amplification of target sequence and the activity of enzymes used as shown in line
3 and 4 of the gel photograh in Figure 1 above. The pETBlue-1 plasmids used for cloning in
E. coli cells were also digested with endonuclease enzymes (EcoRV and EcoRI) to allow for
integration of insert (PCR digest of hFIX cDNA). Result obtained from gel electrophoresis of
plasmid digest revealed varying band sizes of approximately 2,323bp for uncut plasmid and
3,476bp for cut plasmid as expected thus differentiating between supercoiled and linear forms
Spectrophotometric Analysis of Plasmid DNA for Quality and Quantity
Result obtained from spectrophotometric analysis of pETBlue-1 plasmid DNA samples
extracted from genetically modified strain of E. coli showed UV absorbance of 1.69 at 260nm
and 0.9 at 280nm respectively. Plasmid DNA purity was determined by calculating the ratio
of absorbance at 260nm (1.69) divided by absorbance at 280nm (0.9) thus having an optical
density (OD260:OD280 ratio) of 1.87. The concentration of plasmid DNA was calculated by
multiplying its absorbance rate at 260nm (1.69) × the dilution factor (10) × Extinction
coefficient (50µg/ml for 1.0 absorbance at 260nm) = 845µg/ml.
Estimation of E. coli Bacterial Growth by Measurement of Optical Density
The growth estimation of cultured E. coli cells was determined by measuring the optical
density of cultured samples at 600nm.Spectrophotometric analysis showed an optical density
of 0.481. The estimated cell number at 0.481 optical density was 0.380×10⁹ cells/ml as
shown in the calibration curve in Figure (5) below. E. coli cell number was calculated as 1
[image:10.595.108.491.387.612.2]OD= -log10.
FIGURE 5: Shows the calibration curve for estimated E. coli cell number (0.38×10⁹) per
ml of culture media with an optical density of 0.481 at 600nm.
E. coli Cells Transformation and Screening for Plasmid Uptake
Transformed E. coli cells with non-recombinant and recombinant plasmids containing the
ligated target sequence for Human factor IX protein expression showed integration of both
on solidified L-agar plates as shown in the table below. Ampicillin and petBlue2 plasmid
with Amp resistant gene that allow recombinant cells to grow on ampicillin medium were all
contained in the variousplates. Also, X-gal was spread in all the plates as an anologue of
lactose. The two P (positive control) contained the non-recombinant plasmid, the two N
(negative control) contained competent cells and sterile water, and the two L (ligation) plates
contained the competent cell with recombinant plasmid and an uncultured plate as control for
possible contamination. 20µl and` 100µl aliquots of each content prepared for the 6 plates
was spread on each plate and incubated at 37ºC for 48hours. No visible colony was observed
on the 20ul ligation plate, but at 100µl of P & L they were visible colony. The N(negative
control) is needed to check the contamination within the competent cell and therefore should
not have colonies as indicated in table(1). The positive control (P) at 100µl has 186 blue
colonies and 41 blue colonies at 20ul.The ligation plate (L) has Four (4) white colonies at
100µl but lack at 20ul.However, both P & L plates were meant to have colonies at 20µl and
100µl. But blue colonies should not be in Ligation (L) but white colonies. And positive
control (P) should have only blue colonies as shown below.
Table1: An obtained data from blue/white screening analysis for cell transformation (6): The values 0 symbolize no visibility or absent of colonies. 4,41 and 186 values show visibility of colony.
Negative control(N)
Negative control(N)
positive control(P)
positive
control(P) Ligation(L) Ligation(L)
White Blue White Blue White Blue 20µl Nil(0) Nil(0) Nil(0) 41 Nil (0) Nil( 0) 100µl Nil (0) Nil (0) Nil(0) 186 4 Nil(0)
DISCUSSION
Low cost production of recombinant proteins is an important factor considered when
choosing expression systems for production of valuable human proteins (Lau and Sun, 2009).
However, these recombinant proteins need be extracted from cells that actively express the
gene of interest through synthesis of desired protein from which complementary DNA clones
to be amplified are generated. It is from this point that successfully amplified coding gene
sequence is used for transformation through suitable vectors and expression systems. This
was applicable in this study as the primary goal of this research was to evaluate the
competency of GM E.coli strain in the uptake of recombinant plasmid DNA incorporated
In this study, complementary DNA sequence from mRNA was synthesised using total RNA
extracts from HepG2 cells. First strand cDNA protocol used for cDNA synthesis revealed the
importance of choice of reverse transcriptase and effect of different incubation temperature
for enzyme activity during synthesis of cDNA (Bustin, 2000). M-MLV Reverse Transcriptase
used could only transcribe hFIX gene at high incubation temperature of 70⁰C depicting that
the extracted RNA contained high amounts of secondary structures and required a
thermostable reverse transcriptase like the one used in this study, mostly in cases where
transcription is only achieved at high incubation temperature. Apart from being capable to
withstand high thermal conditions, M-MLV-RT is also known to have low RNase H activity
with the ability to transcribe mRNA with secondary structures and also enhances priming
specificity (Gerard et al, 2002). It has a half-life of 120 minutes at 65⁰C. Increased yield in
first strand cDNA is achievable due to reduced RNase H activity (Herschhorn et al,2010). In
other to enhance gene specificity during cDNA synthesis, the reverse primer designed from
coding sequence was used in place of oligo(dt) primer. Since transcription was rarely
achievable with oligo(dt) priming, it was necessary to determine the possibility of achieving
transcription using a gene specific primer as it allows the transcript to start much further in from the 3’ end thus avoiding some of the potential secondary structures during transcription
(Stahlberg et al, 2004). Generated cDNA clones containing the gene of interest had to be
amplified through polymerase chain reaction with series of optimization to obtain better PCR
product.
PCR optimization was done in several ways. There are basically four factors to look out for
while optimising PCR product. This includes, annealing temperature, concentration of Mg⁺⁺,
buffer pH and the condition of cycling. The most important is annealing temperature. This is
because of its importance in the activity of primers used (Korbie et al,2008), in this case, the
primer pairs designed should closely match in annealing temperature to avoid the
effectiveness of one primer against the other. Concentrations of Mg⁺⁺ can easily be
manipulated as it can be used separately in form of MgCl₂ from the rest of the standard
reaction buffer making adjustment in concentration easier. Although, adjustment should be
made with care as Mg⁺⁺ and dNTPs are interdependent. An increase in concentration of
dNTPs decrease the concentration of free Mg⁺⁺ ions (Roux, 2009). Adjustment can be made
between 0.5 – 5.0 Mm of the solution (Kramer and Coen, 2002). Optimization of annealing
temperature should be done within the range of 10⁰C above or below estimated temperature
optimization, in this regard, it is usually advisable to design new set of primers that cleave to
relative DNA sequence (Chou et al, 1992). The use of certain substances during preparation
of template DNA like sodium dodecyl sulphate, phenol, heparin, xylene, bromophenol blue
and cyanol exhibit inhibitory effects on the performance of PCR when used in excess or if
purification of extracts is done inaccurately. When this is suspected as a limiting factor for
PCR analysis then a 100-fold dilution of template DNA is recommended to eliminate
inhibitory effects or a re-extraction can be done with more accuracy (Weyant et al, 1990).
One major challenge in the production of recombinant proteins is usually the difficulty in
creating cDNA library with efficient amplification of the gene of interest. This is usually
because the effectiveness of transcribing and amplifying a particular gene sequence is based
on a complex variation of factors ranging from the cell line to be used and its ability to
express the gene of interest, the type of primers to be used, the choice of reverse transcriptase
and annealing temperature (Tang et al, 2009) suitable for both forward and reverse primers to bind to 3’ and 5’ ends of the coding sequence and initiate amplification through polymerase
chain reaction. It is usually advisable to examine the product of cDNA clones before
amplification to be more specific when optimising PCR analysis. Where possible, this could
be achieved by the application of southern blot techniques with the help of gene specific
probe to determine if the desired cDNA is present and to ascertain the complexity of the
cDNA clones (Rasool et al,2016). With this, it will be much easier to determine if the HepG2
cell line used for RNA extraction have the potential for expressing the desired gene or
probably regulate the annealing temperature or optimise other PCR factors that enhance the
quality of PCR product.
To assess the integrity of amplified PCR product (hFIX), it was adequate to analyse using gel
electrophoresis as an effective technique used in identifying the size of amplified DNA
sequence for correlation with the expected band size with the help of a molecular marker. Gel
electrophoresis involves running DNA/RNA samples on a denaturing agarose gel to allow
adequate downstream separation of DNA/RNA molecules into bands of different sizes
(Westermeier, 2016). It requires minimal electric voltage needed to cause migration of
negatively charged DNA molecules from the cathode to the anode region of the apparatus
(Xia et al, 2016). Analysed DNA molecules on gel electrophoresis as shown on the result
section proved accurate amplification of the target sequence. The reason for lack of visible
length of nucleotides incised by EcoRI and FspI endonucleases are so little and not enough to
make visible differences that could be noted on the gel. Also, the differences in band sizes of
cut plasmid and uncut plasmid digest is because of differences in the compartment of DNA
molecules. The uncut plasmid is in a supercoiled form with compressed DNA molecules thus
preventing accurate analysis of the DNA size. However, the plasmid digest incised with
endonucleases (EcoRV and EcoRI) caused the unwinding of DNA double helix thus
revealing the actual size of the plasmid DNA on the gel.
Transformation of E. coli cells with non-recombinant and recombinant (with hFIX DNA
insert) plasmid vector revealed an unseen metabolic activity between the inoculated cells and
its environment (growth media) that is vital in the blue/white screening for transformed cells.
Cell colonies with blue colouration only indicated the cells’ ability in taking-up non-recombinant plasmid because of unaltered LacZ gene responsible for expressing
β-galactosidase which breaks down lactose (X-gal was used and added in the media as a
substitute) to give glucose + galactose thus producing bromophenol blue in the process which
is responsible for the blue colouration. On the contrary, white cell colonies indicated the cells’ competence in taking-up recombinant plasmid. The reason for the white or colourless
appearance of colonies is because the LacZ gene has been altered by the insertion of hFIX nucleotide sequence and so the production of functional β-galactosidase needed for the
breakdown of X-gal present in the media is hindered. Although cell transformation showed
positive result yet there are possibilities of having recombinant plasmid in transformed E. coli
cells with untranscribed hFIX sequence to produce mRNA needed for expression of the
human factor IX protein. To achieve this, certain laboratory techniques are applied such as
the use of real-time PCR and enzyme-linked immunosorbent assay (ELISA).
The application of real-time PCR techniques is useful in analysing for transcription of target
DNA sequence that was inserted into plasmids taken-up by host cells. This technique
involves labelling of target DNA with sequence specific DNA probes that has a fluorescent
reporter molecule which allows detection of labelled DNA sequence on hybridization of the
probe with complementary sequence (Arya et al, 2014). Once this is achieved, further
application of enzyme-linked immunosorbent assay is required to make sure the mRNA has
REFERENCES
1. Arya, M., Shergill, I.S., Williamson, M., Gommersall, L., Arya, N. and Patel, H.R., 2014.
Basic principles of real-time quantitative PCR. Expert review of molecular diagnostics.
2. Assenberg, R., Wan, P.T., Geisse, S. and Mayr, L.M., Advances in recombinant protein
expression for use in pharmaceutical research. Current opinion in structural biology,
2013; 23(3): 393-402.
3. Becker, C., Hammerle-Fickinger, A., Riedmaier, I. and Pfaffl, M.W., mRNA and
microRNA quality control for RT-qPCR analysis. Methods, 2010; 50(4): 237-243.
4. Bustin, S.A., Absolute quantification of mRNA using real-time reverse transcription
polymerase chain reaction assays. Journal of molecular endocrinology, 2000; 25(2):
169-193.
5. Chavali, S., Sharma, A., Tabassum, R. and Bharadwaj, D., Sequence and structural
properties of identical mutations with varying phenotypes in human coagulation factor
IX. Proteins: Structure, Function, and Bioinformatics, 2008; 73(1): 63-71.
6. Chen, D., Bi, A., Dong, X., Jiang, Y., Rui, B., Liu, J., Yin, Z. and Luo, L., Luteolin
exhibits anti-inflammatory effects by blocking the activity of heat shock protein 90 in
macrophages. Biochemical and biophysical research communications, 2014; 443(1):
326-332.
7. Chou, Q., Russell, M., Birch, D.E., Raymond, J. and Bloch, W., Prevention of pre-PCR
mis-priming and primer dimerization improves low-copy-number amplifications. Nucleic
Acids Research, 1992; 20(7): 1717-1723.
8. Christophe, O.D., Lenting, P.J., Cherel, G., Boon-Spijker, M., Lavergne, J.M., Boertjes,
R., Briquel, M.E., de Goede-Bolder, A., Goudemand, J., Gaillard, S. and d'Oiron, R.,
Functional mapping of anti–factor IX inhibitors developed in patients with severe
hemophilia B. Blood, 2001; 98(5): 1416-1423.
9. Collins, P.W., Björkman, S., Fischer, K., Blanchette, V., Oh, M., Schroth, P., Fritsch, S.,
Casey, K., Spotts, G. and Ewenstein, B.M., Factor VIII requirement to maintain a target
plasma level in the prophylactic treatment of severe hemophilia A: influences of variance
in pharmacokinetics and treatment regimens. Journal of Thrombosis and Haemostasis,
2010; 8(2): 269-275.
10.Frey, U.H., Bachmann, H.S., Peters, J. and Siffert, W., PCR-amplification of GC-rich
11.Gerard, G.F., Potter, R.J., Smith, M.D., Rosenthal, K., Dhariwal, G., Lee, J. and
Chatterjee, D.K., The role of template‐primer in protection of reverse transcriptase from
thermal inactivation. Nucleic acids research, 2002; 30(14): 3118-3129.
12.Gringeri, A., Mantovani, L.G., Scalone, L. and Mannucci, P.M., Cost of care and quality
of life for patients with hemophilia complicated by inhibitors: the COCIS Study Group.
Blood, 2003; 102(7): 2358-2363.
13.Herschhorn, A. and Hizi, A., Retroviral reverse transcriptases. Cellular and molecular life
sciences, 2010; 67(16): 2717-2747.
14.Kay, M.A., Manno, C.S., Ragni, M.V., Larson, P.J., Couto, L.B., McClelland, A., Glader,
B., Chew, A.J., Shing, J., Herzog, R.W. and Arruda, V., Evidence for gene transfer and
expression of factor IX in haemophilia B patients treated with an AAV vector. Nature
genetics, 2000; 24(3): 257-261.
15.Korbie, D.J. and Mattick, J.S., Touchdown PCR for increased specificity and sensitivity
in PCR amplification. Nature protocols, 2008; 3(9): 1452-1456.
16.Kramer, M.F. and Coen, D.M., The polymerase chain reaction. Current Protocols in
Protein Science, 2002. A-4J.
17.Kulkarni, R. and Lusher, J., Perinatal management of newborns with haemophilia. British
journal of haematology, 2001; 112(2): 264-274.
18.Kutyavin, I., Use of base-modified deoxynucleoside triphosphates to improve nucleic acid
detection. U.S. Patent, 2013; 8,349,556.
19.Lau, O.S. and Sun, S.S., Plant seeds as bioreactors for recombinant protein production.
Biotechnology advances, 2009; 27(6): 1015-1022.
20.Mackman, N., Tilley, R.E. and Key, N.S., Role of the extrinsic pathway of blood
coagulation in hemostasis and thrombosis. Arteriosclerosis, thrombosis, and vascular
biology, 2007; 27(8): 1687-1693.
21.Manco-Johnson, M.J., Abshire, T.C., Shapiro, A.D., Riske, B., Hacker, M.R., Kilcoyne,
R., Ingram, J.D., Manco-Johnson, M.L., Funk, S., Jacobson, L. and Valentino, L.A.,
Prophylaxis versus episodic treatment to prevent joint disease in boys with severe
hemophilia. New England Journal of Medicine, 2007; 357(6): 535-544.
22.Nathwani, A.C., Davidoff, A., Hanawa, H., Zhou, J.F., Vanin, E.F. and Nienhuis, A.W.,
Factors influencing in vivo transduction by recombinant adeno-associated viral vectors
expressing the human factor IX cDNA. Blood, 2001; 97(5): 1258-1265.
23.Nathwani, A.C., Reiss, U.M., Tuddenham, E.G., Rosales, C., Chowdary, P., McIntosh, J.,
efficacy of factor IX gene therapy in hemophilia B. New England Journal of Medicine,
2014; 371(21): 1994-2004.
24.Panja, S., Saha, S., Jana, B. and Basu, T., Role of membrane potential on artificial
transformation of E. coli with plasmid DNA. Journal of biotechnology, 2006; 127(1):
14-20.
25.Peters, R.T., Low, S.C., Kamphaus, G.D., Dumont, J.A., Amari, J.V., Lu, Q.,
Zarbis-Papastoitsis, G., Reidy, T.J., Merricks, E.P., Nichols, T.C. and Bitonti, A.J., Prolonged
activity of factor IX as a monomeric Fc fusion protein. Blood, 2010; 115(10): 2057-2064.
26.Peyvandi, F., Kaufman, R.J., Seligsohn, U., Salomon, O., BOLTON‐MAGGS, P.H.B.,
Spreafico, M., Menegatti, M., Palla, R., Siboni, S. and Mannucci, P.M., Rare bleeding
disorders. Haemophilia, 2006; 12(s3): 137-142.
27.Rasool, G., Yousaf, S., Akram, A., Mansoor, S., Briddon, R.W. and Saeed, M., G5, a
Phage Single-Stranded DNA-Binding Protein, Fused with a Nuclear Localization Signal,
Attenuates Symptoms and Reduces Begomovirus-Betasatellite Accumulation in
Transgenic Plants. Molecular Biotechnology, 2016; 58(8-9): 595-602.
28.Rech, E.L., Vianna, G.R. and Aragao, F.J., High-efficiency transformation by biolistics of
soybean, common bean and cotton transgenic plants. Nature protocols, 2008; 3(3):
410-418.
29.Sabalza, M., Christou, P. and Capell, T., Recombinant plant-derived pharmaceutical
proteins: current technical and economic bottlenecks. Biotechnology letters, 2014; 36(12):
2367-2379.
30.Shapiro, A.D., Ragni, M.V., Valentino, L.A., Key, N.S., Josephson, N.C., Powell, J.S.,
Cheng, G., Thompson, A.R., Goyal, J., Tubridy, K.L. and Peters, R.T., Recombinant
factor IX-Fc fusion protein (rFIXFc) demonstrates safety and prolonged activity in a
phase 1/2a study in hemophilia B patients. Blood, 2012; 119(3): 666-672.
31.Schwartz, R.A., Klujszo, E., Gascon, P. and McKenna, R., 2007. Factor IX. The
Medscape Journal.
32.Ståhlberg, A., Håkansson, J., Xian, X., Semb, H. and Kubista, M., Properties of the
reverse transcription reaction in mRNA quantification. Clinical chemistry, 2004; 50(3):
509-515.
33.Tang, F., Barbacioru, C., Wang, Y., Nordman, E., Lee, C., Xu, N., Wang, X., Bodeau, J.,
Tuch, B.B., Siddiqui, A. and Lao, K., mRNA-Seq whole-transcriptome analysis of a
34.Verma, D., Moghimi, B., LoDuca, P.A., Singh, H.D., Hoffman, B.E., Herzog, R.W. and
Daniell, H., Oral delivery of bioencapsulated coagulation factor IX prevents inhibitor
formation and fatal anaphylaxis in hemophilia B mice. Proceedings of the National
Academy of Sciences, 2010; 107(15): 71.
35.Westermeier, R., Electrophoresis in practice: a guide to methods and applications of
DNA and protein separations. John Wiley & Sons, 2016.
36.Weyant, R.S., Edmonds, P. and Swaminathan, B., Effect of ionic and nonionic detergents
on the Taq polymerase. Biotechniques, 1990; 9(3): 308-309.
37.Xia, Q., Cheng, L., Zhang, H., Sun, S., Liu, F., Li, H., Yuan, J., Liu, Z. and Diao, Y.,
Identification of vaginal bacteria diversity and it's association with clinically diagnosed
bacterial vaginosis by denaturing gradient gel electrophoresis and correspondence