www.wjpr.net Vol 7, Issue 9, 2018. 735
NOVEL SALICIN PHYTOSOMAL COMPLEX: DEVELOPMENT AND
OPTIMIZATION USING CENTRAL COMPOSITE DESIGN
Parul A. Ittadwar*, Shankar V. Bhojne and Prashant K. Puranik
Department of Pharmaceutical Sciences, Rashtrasant Tukadoji Maharaj Nagpur University,
Mahatma Jyotiba Fuley Education Campus, Nagpur – 440 033 (MS), India.
ABSTRACT
The present study encompasses the formulation of a novel Salicin
phospholipid complex (Phytosome) using Central composite design as
a tool for optimization and its characterization using various
techniques. Salicin is an alcoholic β-glucoside with anti-inflammatory,
analgesic and antipyretic activity obtained from various natural sources
like willow bark, castoreum, populous species etc. But as a
phytochemical it has been reported to show low aqueous solubility,
low absorption, low bioavailability and hence lower activity.
Phytosomes are complexes of phytochemical and phospholipid in a
stoichiometric ratio in a non-polar solvent and are thus, supposed to
enhance the overall properties of the phytochemical. These complexes
have the bioactive phytoconstituent of herb extracts chemically bound
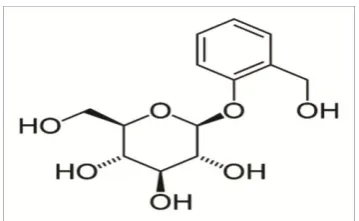
by a lipid. Structurally Salicin possesses five hydroxyl polar groups
which have the ability to bind with the polar group of phospholipid so as to form a
phytosomal complex. Salicin phytosomes were formulated by solvent evaporation method
and optimized using experimental design. The optimized batch showed 4.89 times enhanced
solubility in water (135.73μg/ml) than the drug alone (27.73μg/ml) with complexation rate of
99.64%. The phytosomes were evaluated using FTIR, DSC, SEM and XRD. SEM showed
the surface morphology of complex depicting the conversion of crystalline drug into
amorphous complex. The in vitro permeation in the form of suspension was significantly
higher for the complex (93.43%) than the drug (19.65%) after 7 hours. Hence, Salicin showed
better solubility and permeation in the form of phytosomes which may eventually increase its
absorption, bioavailability and pharmacological activity.
Volume 7, Issue 9, 735-751 Research Article ISSN 2277 – 7105
Article Received on 05 March 2018,
Revised on 26 March 2018, Accepted on 16 April 2018,
DOI: 10.20959/wjpr20189-11974
*Corresponding Author
Parul A. Ittadwar
Department of
Pharmaceutical Sciences,
Rashtrasant Tukadoji
Maharaj Nagpur University,
Mahatma Jyotiba Fuley
Education Campus, Nagpur
www.wjpr.net Vol 7, Issue 9, 2018. 736 KEYWORDS: Salicin, Phytosome, Central composite design, Partition coefficient,
Solubility, Permeation.
INTRODUCTION
Plants consist of a number of secondary metabolites which are predominantly endowed with
health boosting substances. A single plant cell is a huge chemical factory. But the plant
constituents in isolated forms have disadvantages of limited effectiveness. This may be
attributed to the lower solubility, lower absorption and lower bioavailability of these
phytoconstituents which ultimately result in its lower pharmacological activity.[1] These disadvantages of phyconstituents led to the need for development of novel drug delivery
systems taking into account different carriers which can bind to the plant extracts so as to
improve its overall properties. The technique of phytosome or phytolipid complex is one such
novel drug delivery system which involves the binding of a phytoconstituent and
phospholipid in a stoichiometric ratio.[2] Phytosome chemically is a supramolecular adduct which is formed by hydrogen bonding between the polar group of the phytoconstituent and
the polar group of the phospholipid.[3] These phytosomes lead to the increase in overall physicochemical properties and activity of the active phytoconstituent.
The phytoconstituent selected for the present study is Salicin, which is herbal
anti-inflammatory agent. Chemically it is an alcoholic β-glucoside and is found in Willow bark
(Salix) Populus bark and leaves. It is also found in castoreum which has been credited to the
accumulation of salicin from willow trees in the beaver's diet and is transformed to salicylic
acid and has an action very similar to aspirin. Salicin is closely related in chemical make-up
to aspirin. In combination with the herb's powerful anti-inflammatory plant compounds
(called flavonoids), salicin is thought to be responsible for the pain-relieving and
[image:2.595.208.388.628.738.2]anti-inflammatory effects of the herb.[4,5] But it has the disadvantage that it has low solubility and bioavailability in its isolated form.
www.wjpr.net Vol 7, Issue 9, 2018. 737
Salicin has five polar hydroxyl groups (Fig. 1) which have the affinity to bind with the
phospholipid. Salicin–PHOSPHOLIPON 90H complex may be formed due to the interaction
between the polar hydroxyl groups of salicin and polar choline group of phosphatidylcholine.
This may lead to the enhanced solubility and permeability of Salicin which in turn will
enhance its pharmacological activity.
Hence, as Salicin has not been explored as a phytosome and as it possessed the desired
properties, this study aimed to prepare the phospholipid complex of salicin by solvent
evaporation technique, to optimize using quality by design (Central composite design), to
characterize the prepared complexes for their physicochemical properties and to compare the
activity of complex with salicin.
MATERIALS AND METHODS
Materials
SALICIN was purchased from Sigma-Aldrich Inc. (USA). PHOSPHOLIPON 90 H was
obtained as a gratis sample from the company Lipoid AG, Steinhausen, Switzerland. All the
other reagents and solvents used were of analytical grade.
Methods
Preformulation studies
The identification of the drug was carried out by melting point determination, infrared
spectrometry and differential scanning calorimetry. Melting point determination was carried
using Thiele tube method.[6] DSC was carried out to study the thermal behavior of the drug.[7]
The analytical method development was carried out using ultraviolet spectroscopic analysis.
Calibration of salicin was performed in solvents namely ethanol, water and pH 7.2 phosphate
buffer [8]. A standard stock solution of 1000 ppm was prepared and subsequently a solution of 10 ppm was prepared from it to determine the λmax. After that calibration curves were
obtained using a range of solution concentrations. Then determination of validation
parameters- linearity, intraday precision study, interday precision study, robustness,
ruggedness was carried out in accordance with the ICH guidelines.[9]
Formulation of Salicin phytosome
The salicin phospholipid complex was prepared by solvent evaporation method. Briefly
www.wjpr.net Vol 7, Issue 9, 2018. 738
taken in a 100 ml round bottom flask and 30 ml of ethanol was added. The reaction
temperature was controlled between 40-60 0C for a reaction time of 1-3 hours. The resultant clear solution was evaporated to 2-3 ml and excess of the non-solvent, n-hexane was added to
it with continuous stirring. The complex was precipitated, filtered and dried under vacuum to
remove traces of solvents. Resultant complex was stored in an amber colored glass bottle
flushed with nitrogen at room temperature.[10]
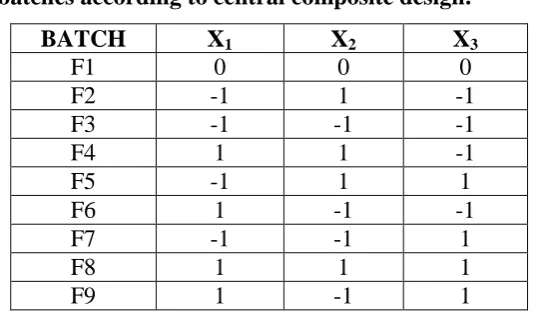
Optimization using QbD concept by Central Composite Design-
Experimental design is a concept of the careful balance between several variables affecting
any experiment. To reduce the number of trials and attain the highest amount of information,
the screening was planned applying a central composite design to systematically study the
joint influence of the effect of independent variables: Salicin – PHOSPHOLIPON 90H ratio
(X1), reaction temperature (X2, ◦C) and the reaction time (X3, h) on the dependent variables
complexation rate (Y1) and partition coefficient (Y2). In this design, 3 factors were evaluated
and experimental trials were performed at all 9 possible combinations. A statistical model
incorporating interactive and polynomial terms was used to evaluate the response employing
the formula equation:
Y = b0 + b1X1 + b2X2 + b3X3 + b11X12+ b22X22+ b33X32+ b12X1X2+b23X2X3 + b13X1X3
Where Y was the dependent variable, b0 was the arithmetic mean response of the 9 runs, and
bi was the estimated coefficient for the factor Xi.
The main effects (X1 and X2) represented the average result of changing one factor at a time
from its low to high value. The interaction terms (X1X2, X2X3, and X1X3) showed how the
response changed when 3 factors were simultaneously changed. The polynomial terms (X12,
X22 and X32) were included to investigate non-linearity.[10]
The level values of three factors and composition of central composite design batches 1-9
www.wjpr.net Vol 7, Issue 9, 2018. 739 Table 1: General batches according to central composite design.
BATCH X1 X2 X3
F1 0 0 0
F2 -1 1 -1
F3 -1 -1 -1
F4 1 1 -1
F5 -1 1 1
F6 1 -1 -1
F7 -1 -1 1
F8 1 1 1
F9 1 -1 1
Factors: X1-Salicin-PHOSPHOLIPON 90H ratio; X2-Reaction temperature; X3-Reaction
time
Responses: Y1-Complexation rate; Y2-Partition coefficient
Table 2: Dependent and independent variables in central composite design for
optimization.
Types of variable Variable Optimization levels used
Low Medium High
Independent
X1 (Salicin : PHOSPHOLIPON 90H) 1:0.5 1:1.75 1:3
X2(Temperature 0C) 40 50 60
X3(Time hours) 1 2 3
Dependent Y1(Complexation rate) % Maximize
Y2(Partition coefficient) Minimize
Characterization of Salicin phytosome
Determination of complexation rate
Amount of complex equivalent to 10 mg of salicin was dispersed in 5 ml of chloroform. Both
the complex and PHOSPHOLIPON 90H were easily dissolved in chloroform, but free salicin
remained practically insoluble in chloroform. The non-complexed salicin was separated,
dissolved in ethanol and volume was made to 10 ml. It was assayed using
UV-spectrophotometer (V- 630 Jasco 2000 series, Japan) at 268nm. The free drug concentration
was calculated from standard curves. This was performed for all the 9 batches of complex.
The complexation rate of salicin was determined by the following formula:
Complexation rate (%) = (m2/m1) × 100 = [(m1-m3)/m1] ×100.
Where m1 is the total content of salicin added, m2 is the content of salicin present as a
www.wjpr.net Vol 7, Issue 9, 2018. 740 Determination of solubility by partition coefficient method
Complex equivalent to 10 mg of salicin was weighed and taken in a beaker. To this 10 ml of
distilled water was added and it was stirred well for 20 minutes on a magnetic stirrer. In a 60
ml separating funnel, 10 ml of n-octanol was added and the dispersion of complex in water
was added to the funnel. The funnel was uniformly agitated for 2 hours. It was then kept
aside for 30 minutes. When two distinct layers were formed, they were separated and the
solution was diluted and assayed using UV-Spectroscopy by recording absorbance in
triplicate. Similar procedure was followed for the drug alone. Concentration in both the
phases was calculated using calibration equation and the partition coefficient was calculated
for the plain drug and for all the 9 batches by following formula:[11] Partition coefficient =Co/Cw
Where Co – concentration in oil phase, Cw – concentration in water phase.
Determination of drug content in the complex
Complex equivalent to 10 mg of salicin of the optimized batch was dissolved in 100 ml of
ethanol to form a solution of concentration 100 μg/ml approximately. Then again 2 ml
solution was taken using a micropipette in a 10 ml volumetric flask and volume was made up
to 10 ml with ethanol to obtain a solution of concentration 20 μg/ml and it was evaluated
using UV Spectrophotometer at 268 nm. The blank was prepared by dissolving 10 mg of
phospholipid in 100 ml of ethanol to form 100μg/ml and then subsequently 20μg/ml solution
was prepared by dilution. The drug content was calculated for the optimized batch.[11]
Fourier Transform Infra-Red [FT-IR] Spectroscopy
The interaction between salicin and PHOSPHOLIPON 90H was studied by obtaining the
FT-IR spectra using the Shimadzu- IRAFFINITY-1 Fourier transform infrared
spectrophotometer. The FT-IR spectra of salicin, PHOSPHOLIPON 90H, complex and
physical mixture were obtained. The sample was triturated and mixed with potassium
bromide in the ratio 1:100. The mixture was then introduced in the sample holder of the
FT-IR instrument and scanned to obtain the graph in the range of 4500-500cm-1 .Then the spectrum of the complex was compared to that of plain drug, phospholipid and their physical
mixture.[12]
Differential Scanning Calorimetry
It was done with the help of a differential scanning calorimeter (R.C Patel Institute of
www.wjpr.net Vol 7, Issue 9, 2018. 741
cells were heated at the speed of 5 °C/min from 0 to 300 °C under a nitrogen atmosphere. The
phase transition onset temperatures of salicin, PHOSPHOLIPON 90H, complex and the
physical mixture were determined and compared.[12]
Scanning Electron Microscopy
SEM imaging of complex and drug was performed by a scanning electron microscope (JEOL
model JSM 6390LV- Sophisticated analytical instruments facility, STIC, Cochin) using
electron beam for surface imaging.[12]
X-ray Diffraction study
The crystalline behavior of salicin, phospholipid and complex was evaluated with X-ray
diffractometry. Diffraction patterns were obtained on Brisker AXS D8 Advance
(Sophisticated Analytical Instruments Facility, STIC. Cochin, India.) The X-ray generator
was operated at 40 kV tube voltages and 35mA tube current. The scanning angle ranged from
3 to 60 0 in the step scan mode with step time of 39.8 seconds.[12]
In vitro permeation study of complex and salicin in suspension form
The in vitro permeation study was performed using dialysis membrane 60 having diameter
15.9 mm. It was treated 24 hours prior by heating it with sodium bicarbonate solution in
water for 10 minutes and then again heating it in distilled water for 10 minutes. After 24
hours the membrane was mounted on the Franz diffusion cell. The receptor compartment was
filled with pH 7.2 phosphate buffer. The diffusion cell was maintained at 37±0.5 0C with constant stirring on a magnetic stirrer. Then suspension of salicin complex and plain salicin
was prepared. It was evenly spread on the membrane in donor compartment. Then 1 ml
sample of receptor medium was withdrawn at pre-determined time intervals and an
equivalent volume of fresh buffer was added in. All samples were filtered, suitably diluted
and analyzed by UV spectrophotometer. The permeation of the complex was compared to
that of the plain drug.[13,14]
Stability study
A short term chemical stability of the salicin complex was examined for three months at 30±2
0
C at 65% ± 5% relative humidity. The complex samples were analyzed at an interval of 30
www.wjpr.net Vol 7, Issue 9, 2018. 742 RESULTS AND DISCUSSION
Preformulation studies
The melting point range by Thiele tube method was found to be 205-209°C. The FT-IR
spectrum of salicin showed similar peaks as that of standard spectrum values as shown in Fig.
4. The DSC results showed an endothermic peak at 200.97°C as shown in Fig. 5, which
complied with the reported range.
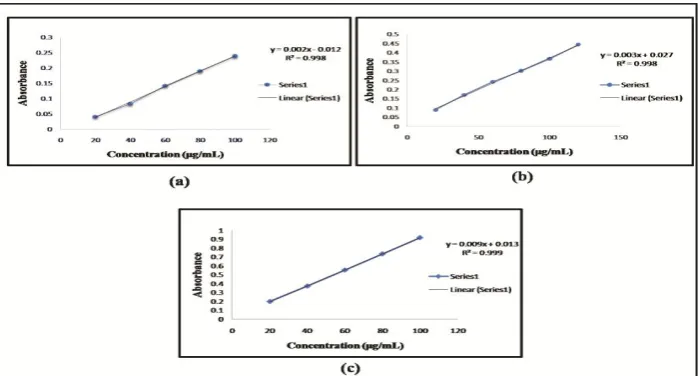
The λmax of salicin was found to be 268nm. The calibration curve of salicin in ethanol, water
and pH 7.2 phosphate buffer along with its regression equation and correlation coefficient is
shown in Fig. 5. The validation parameters evaluated were as per the ICH guidelines and the
linearity range was found to be 20-100μg/ml.
Fig. 2: Calibration curves of salicin in ethanol (a), water (b) and 7.2 pH phosphate
buffer (c).
Formulation & optimization of Salicin- phytolipid complex by QbD concept using
central composite design
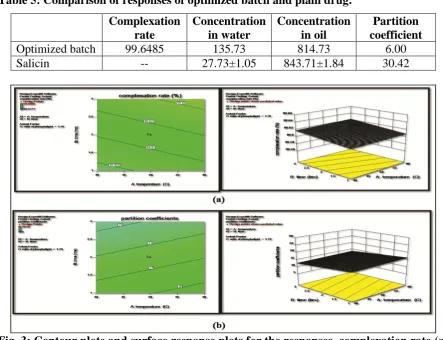
According to central composite design 9 batches were formulated and batch F8 was found to
be the optimized batch on the basis of the responses- complexation rate and partition
coefficient. The optimized batch showed better solubility in water than the drug alone. The
results are summarized in tables 3, 4 and 5. Only the statistically significant values were
included. The contour plots and 3D surface response curves were obtained as shown in Fig. 3.
They suggest that Salicin: PHOSPHOLIPON 90H ratio and temperature had positive
relationship and time had an inverse relationship on complexation rate. On the other hand,
temperature and time had a positive relationship and Salicin: PHOSPHOLIPON 90H ratio
[image:8.595.124.474.305.493.2]www.wjpr.net Vol 7, Issue 9, 2018. 743 Table 3: Optimization using central composite design.
Batch X1 X2 X3
Complexation rate(%) Concentration in water Concentration in oil Partition coefficients
K=Co/Cw
F1 1:1.75 50 2 99.6147±0.23 53.19±2.0.4 832.95±1.44 15.65 F2 1:0.5 60 1 99.5804±0.29 45.17±1.43 1214.96±1.83 26.89 F3 1:0.5 40 1 99.5772±0.18 49.58±1.87 700.16±1.48 14.12 F4 1:3 60 1 99.6331±0.27 124.29±1.44 1132.96±1.77 9.1 F5 1:0.5 60 3 99.5926±0.28 67.52±1.55 976.96±1.68 14.46 F6 1:3 40 1 99.6265±0.32 115.35±1.68 1190.96±1.98 10.32 F7 1:0.5 40 3 99.5919±0.21 34.72±1.98 732.27±1.65 21.04
F8 1:3 60 3 99.6485±0.28 135.73±1.61 814.73±1.58 6.00
F9 1:3 40 3 99.6401±0.36 117.24±1.29 918.96±1.23 7.39 Data is presented as mean value ± SD (n=3)
Table 4: Experimental levels and evaluation of optimized batch.
Salicin: Phospholipon 90H
Temprature in 0C
Time in hours
Complexation rate (Y1)
Partition coefficient (Y2)
1:3 60 3 99.6485±0.28 6.00
Table 5: Comparison of responses of optimized batch and plain drug.
Complexation rate Concentration in water Concentration in oil Partition coefficient
Optimized batch 99.6485 135.73 814.73 6.00
Salicin -- 27.73±1.05 843.71±1.84 30.42
Fig. 3: Contour plots and surface response plots for the responses, complexation rate (a)
www.wjpr.net Vol 7, Issue 9, 2018. 744 Characterization of Salicin phytosome
Determination of complexation rate
After evaluation of the highest complexation rate of 99.6485%, batch F8 was found to be the
optimized batch. This may be attributed to the fact that phosphatidylcholine had a good
affinity towards the drug salicin.
Determination of solubility by partition coefficient method
The solubility of all the 9 batches was summarized in table. The solubility of salicin and that
of the optimized batch F8 in water phase were 27.73μg/ml and 135.73μg/ml respectively and
the partition coefficient values were 30.42 and 6.00 respectively. This suggested that the
solubility of salicin was increased almost 4.89 times in the form of phytosomal complex.
Determination of drug content in the complex
The drug content of Salicin in the form of phytolipid complex for the optimized batch F8 was
found to be 94.24%. The high value of drug content in the complex indicated the formulation
of a chemically stable complex.
Fourier Transform Infra-Red [FT-IR] Spectroscopy
A sharp peak at 3328.75cm-1 was obtained in the FT-IR spectrum of salicin for OH group. The spectrum showed aromatic C – H stretch at 2953.04 cm-1, aromatic C=C stretch at 1491.61 cm-1 and C-O-C stretch at 1117.78 cm-1. The FT-IR spectrum of PHOSPHOLIPON 90H showed the characteristic C – H stretching band of long fatty acid chain at 2918.3 and
2854.96cm-1,carbonyl stretching band at 1728.22cm-1 in the fatty acid ester, P=O stretching band at 1236.37 cm-1, P–O–C stretching band at 1093.65 cm-1, and N+(CH3)3 stretching at
966.34 cm-1. The FT-IR spectrum of the salicin phytosomal complex showed significant changes in aromatic C – H stretching from 2953.04 cm-1 to 2916.05 cm-1. Also the P=O absorption band of PHOSPHOLIPON 90H was found to shift to a lower wave number [16].
www.wjpr.net Vol 7, Issue 9, 2018. 745 Fig. 4: FTIR spectra of Salicin (a), PHOSPHOLIPON 90H (b), physical mixture (c) &
Salicin phytosomal complex (d).
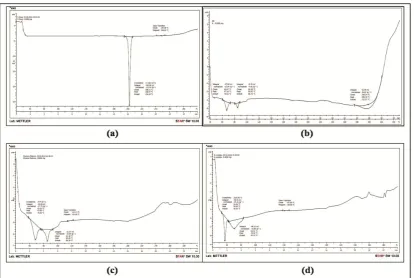
Differential Scanning Calorimetry
Salicin showed endothermic peak ranging from 200.11 to 204.10 0C. PHOSPHOLIPON 90H showed two major peaks at 84.83 0C and peak at 67.16 0C. The first peak was sharp and it appeared due to the phase transition. The second peak was mild, which may be due to the
movement of phospholipid polar head group. The physical mixture of salicin and
PHOSPHOLIPON 90H showed two sharp peaks, one peak ranging from 62.03 0C to 73.02
0
C and second peak ranging from 81.40 0C to 88.39 0C. The thermogram of the complex showed two peaks. The first sharp peak ranged from 54.94 0C to 59.55 0C and second peak from 62.41 0C to 82.72 0C which differed from the peak of salicin and PHOSPHOLIPON 90 H. It was evident that the original peak of salicin and PHOSPHOLIPON 90H disappeared
from the thermogram of the complex due to shifting in the peak towards the lower
[image:11.595.104.493.69.330.2]www.wjpr.net Vol 7, Issue 9, 2018. 746 Fig. 5: DSC graphs of Salicin (a), PHOSPHOLIPON 90H (b), physical mixture (c) &
Salicin phytolipid complex (d).
Scanning Electron Microscopy
The scanning electron micrographs of salicin and complex depicted in the Fig. 6 showed their
surface morphology. The change from crystalline nature of salicin to amorphous complex
form was evident which proved the formation of complex. This also gave the evidence for
[image:12.595.92.507.69.347.2]enhancement of solubility of salicin in the form of phytosome.
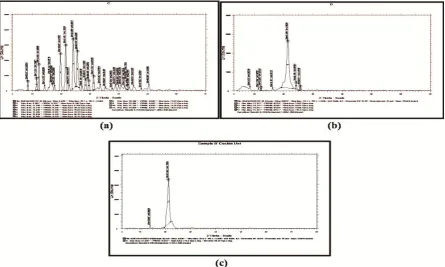
[image:12.595.76.523.528.697.2]www.wjpr.net Vol 7, Issue 9, 2018. 747 X-ray Diffraction study
Salicin exhibited many intense sharp diffraction peaks of crystallinity at a diffraction angle of
24.058 0, 21.4810, 25.4750, and 19.6450 and indicated that the drug was present as a crystalline material. The phospholipid showed a single intense peak at 2θ value of 21.242.
The disappearance of salicin peaks confirmed the formation of complex of salicin as shown
in Fig. 7. It can be concluded that salicin phytolipid complex had an amorphous form which
led to the enhancement of solubility.
Fig. 7: X-ray diffractograms of Salicin (a), PHOSPHOLIPON 90H (b) & Salicin
phytosomal complex (c).
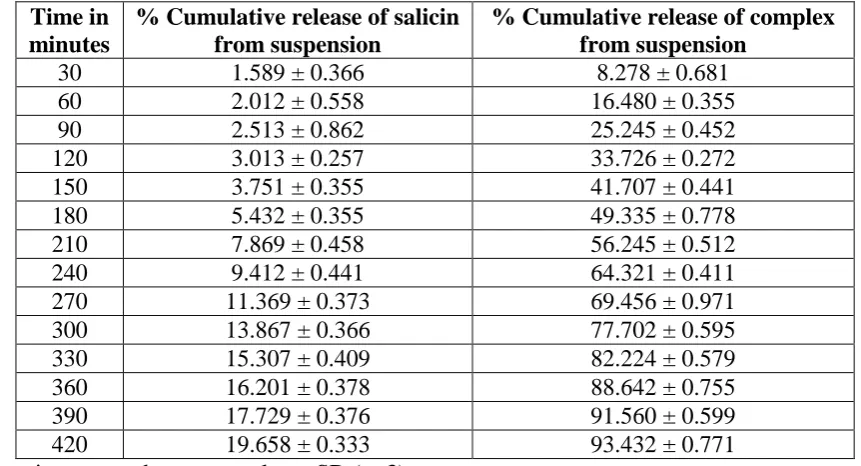
In vitro permeation study of complex and salicin in suspension form
The in vitro permeation of the complex and salicin in suspension was studied over a period of
7 hours as shown in table 6. The % cumulative release was calculated and the permeation was
found to be higher for complex than salicin alone in the form of suspension as shown in the
Fig. 8. Model fitting for in vitro permeation profile was performed using Zero order, First
order, Higuchi and Korsmeyer-Peppas model and on the basis of the highest correlation
coefficient it was found that the best fit was shown by Zero-order model. The value of the
permeation coefficient (n) for complex and salicin alone was found to be 0.5<n<1
[image:13.595.76.522.230.497.2]www.wjpr.net Vol 7, Issue 9, 2018. 748 Table 6: Comparative % cumulative release of salicin and complex from suspension.
Time in minutes
% Cumulative release of salicin from suspension
% Cumulative release of complex from suspension
30 1.589 ± 0.366 8.278 ± 0.681
60 2.012 ± 0.558 16.480 ± 0.355
90 2.513 ± 0.862 25.245 ± 0.452
120 3.013 ± 0.257 33.726 ± 0.272
150 3.751 ± 0.355 41.707 ± 0.441
180 5.432 ± 0.355 49.335 ± 0.778
210 7.869 ± 0.458 56.245 ± 0.512
240 9.412 ± 0.441 64.321 ± 0.411
270 11.369 ± 0.373 69.456 ± 0.971
300 13.867 ± 0.366 77.702 ± 0.595
330 15.307 ± 0.409 82.224 ± 0.579
360 16.201 ± 0.378 88.642 ± 0.755
390 17.729 ± 0.376 91.560 ± 0.599
420 19.658 ± 0.333 93.432 ± 0.771
[image:14.595.81.512.95.358.2]Data is presented as mean value ± SD (n=3)
Fig. 8: In vitro permeation through suspension.
Stability study
The stability study at 30°C ± 2°C at 65% ± 5% RH indicated that the optimized batch did not
show any physical changes during the study period. The results were as shown in table 7 for a
period of 3 months.
Table 7: Stability study of salicin phytolipid complex for 3 months.
Formulation Storage conditions
(Months) Time interval
In vitro release after 12 h (%)
Salicin- Phospholipon 90H complex (Batch F8)
30 ± 2 °C and 65 ± 5 % RH
0 86.68±0.24
1 87.12±0.39
2 89.87±0.97
3 89.37±0.54
[image:14.595.154.447.357.502.2]www.wjpr.net Vol 7, Issue 9, 2018. 749 CONCLUSION
Salicin is an effective herbal drug possessing anti-inflammatory, analgesic and antipyretic
activity. During the literature survey it was found that salicin was an effective drug for the
formulation of phospholipid delivery system because of its structural suitability. It possesses
five polar hydroxyl groups which are suitable for complexation to the polar group of
PHOSPHOLIPON 90H. Salicin has not been reported for the formulation of phytosomal
complex and hence an attempt was made to formulate this novel Salicin phytosomal complex.
Salicin was successfully complexed with PHOSPHOLIPON 90H to form a novel phytosomal
delivery system. The preformulation study confirmed the drug salicin by FTIR, DSC and
melting point determination. Analytical method development and determination of various
validation parameters confirmed stability and method reliability of the drug. The
complexation was carried out by solvent evaporation method using central composite design
applying three factors, salicin: PHOSPHOLIPON 90H ratio, time and temperature and the
batch was optimized by evaluating two responses, complexation rate and partition coefficient.
The optimized batch showed increased solubility in water (135.73μg/ml) which was
approximately 4.89 times that of the drug alone (27.73μg/ml) with complexation rate of
99.64%. The optimized batch (F8) was then evaluated for the drug content (94.24%). The
phytosomes were characterized using FTIR, DSC, SEM and XRD. SEM showed the surface
morphology of complex depicting the conversion of crystalline drug into amorphous complex
which may also be attributed to the increased solubility of the complex. The in vitro
permeation in the form of suspension was significantly higher for the complex (93.43%) than
the drug (19.65%) after 7 hours of study. The stability study depicted no significant changes
over the period of study. Hence, it can be concluded that the anti-inflammatory
phytoconstituent, Salicin showed a significant enhancement of its overall physicochemical
properties in the form of phytosomal complex which led to its improved solubility and
permeation. This in turn may lead to enhancement of its bioavailability and ultimately its
pharmacological activity.
ACKNOWLEDGEMENT
The authors are thankful to Rashtrasant Tukadoji Maharaj Nagpur University, Nagpur for
providing financial assistance. The authors are also thankful to all the manufacturers and
suppliers for providing the drug and excipients for the study. We would also like to thank the
www.wjpr.net Vol 7, Issue 9, 2018. 750 REFERENCES
1. Khan J, Alexander A, Ajazuddin S, Saraf S, Recent advances and future prospects of
phyto-phospholipid complexation technique for improving pharmacokinetic profile of
plant actives. J. Control. Release, 2013; 168: 50-60.
2. Jadhav AI, Wadhave AA, Arsul VA, Sawarkar SH. Phytosomes: A novel approach in
herbal drug delivery system. International Journal of Pharmaceutics and Drug Analysis,
2014; 2(5): 478-486.
3. Patel J, Patel R, Khamboja K, Patel N. An overview of phytosomes as an advanced herbal
drug delivery system. Asian J. Pharm, 2009; 4(6): 363-371.
4. Salicin, Pubchem - Open Chemistry database
https://pubchem.ncbi.nlm.nih.gov/compound/salicin.
5. Mukherjee PK, Maiti K, Mukherjee K, Gantait A, Saha BP. Curcumin–phospholipid
complex: Preparation therapeutic evaluation and pharmacokinetic study in rats. Int. J.
Pharm, 2007; 330: 155–163.
6. Furniss, BS, Hannaford AJ, Smith PWG, Tatchell AR. Vogel textbook of practical
organic chemistry. 5th ed., Pearson education, 2008; 236-240.
7. Semalty A, Semalty M, Singh D, Rawat MS. Development and characterization of
aspirin-phospholipid complex for improved drug delivery. International Journal of
Pharmaceutical Science and Nanotechnology, 2010; 3(2): 940-947.
8. Malik A, Kushnoor A, Saini V, Singhal S, Kumar S, Yadav Y. Analytical method
development of neutraceutical. Int. J. Pharm, 2012; 3(1): 67-73.
9. Singh S, Mishra A, Verma A, Ghosh AK, Mishra AK. A simple ultraviolet
spectrophotometric method for the determination of etoricoxib in dosage formulation. J
Adv Pharm Technol Res, 2012; 5(4): 237-240.
10.Tan Q, Liu S, Chem X, Wu M, Wang H, Yin H, He D, Xiong H, Zhang J. Design and
evaluation of a novel evodiamine – phospholipid complex for improved oral
bioavailability. AAPS Pharm Sci Tech, 2012; 13(2): 534-547.
11.Yue PF, Yuan H, Li X, Yang M, Zhu W. Process optimization, characterization and
evaluation in vivo of oxymatrine – phospholipid complex. Int. J. Pharm, 2010; 387:
139-46.
12.Semalty A, Semalty M, Singh D. Preparation and characterization of phospholipid
complexes of naringenin for effective drug delivery. J Incl Phenom Macrocycl Chem,
www.wjpr.net Vol 7, Issue 9, 2018. 751
13.Bhattacharyya S, Majhi S, Mukherjee PK, Saha BP. Chlorogenic acid–phospholipid
complex improve protection against UVA induced oxidative stress. J. Photochem.
Photobiol B, 2014; 130: 293–298.
14.Rawat M. S, Singh D, Semalty A, Semalty M. Emodin – phospholipid complex- A
potential of herbal drug in the novel drug delivery system. J Therm Anal Calorim
Springer Sci, 2012; 108: 289-98.
15.Saharan VA, Agarwal A, Kharb V. Process optimisation, characterization and evaluation
of resveratrol – phospholipid complexes using Box-Behnken statistical design. Int Curr
Pharm J, 2014; 3: 301-8.
16.Skoog D, West D. Principles of instrumental analysis Saunders Golden Sunburst Series.
2nd edition, 1992; 221-54.
17.Alhmoud HA. The uses of matrices in drug delivery: The effect of polymers on the drug