Prediction Method of Crack Sensitivity during DC Casting
of Al-Mn and Al-Mg Alloys
*1Makoto Morishita
1;2;*2, Mitsuhiro Abe
1, Kenji Tokuda
1and Makoto Yoshida
21
Material & Process Research Section, Aluminum Sheets & Coil Research Department, Moka Plant, Kobe Steel Ltd., Moka 321-4367, Japan
2The Kagami Memorial Laboratory for Materials Science and Technology,
Waseda University, Tokyo 169-0051, Japan
Because it has been difficult to predict crack sensitivity depending on alloy composition during aluminum direct chill casting (DC casting), a new prediction method based on the relationship between the calculated solid fraction and temperature was developed for Al-Mn and Al-Mg series aluminum alloys. In this work, two crack indexes are suggested. The first index is brittle temperature range (BTR). The second index is based on the strain rate difference in the mushy region. These indexes are quantitatively calculated by using thermodynamic software such as Thermo-calc. This method is verified by DC casting of A3000 and A5000 series aluminum alloys. It can be utilized in the alloy design stages to control the crack sensitivity before casting. [doi:10.2320/matertrans.L-M2010823]
(Received March 19, 2010; Accepted October 19, 2010; Published January 13, 2011)
Keywords: direct chill (DC) casting, solidification crack, alloy composition, solid fraction
1. Introduction
The solidification cracks observed in the aluminum direct chill casting (DC casting) process are extremely difficult to recover in the subsequent roll and heat-treatment processes. In general, to improve mechanical or physical properties, conventional aluminum alloys contain various elements such as Fe, Si, Mn, Mg, Cu, Zn, and others. Some of these elements tend to induce large solidification temperature ranges up to 150 K by a small amount of addition, which tends to increase the crack sensitivity. To prevent cracks, the casting rate is often suppressed to a lower rate. Grain refiners, such as Al-Ti-B alloys, are also used.1–3) The addition of grain refiners degrades the recycling ability, however. The development of a prediction method for the crack sensitivity has been desired as a function of both the amount and kind of alloy elements.
According to the previous reports,4,5) the wider solid-ification temperature range causes higher crack sensitivity of the alloys. However, we found that the solidification temperature range was not sufficient to estimate the crack sensitivity, at least for A3000 and A5000 series aluminum alloys. Thermal stress analysis during DC casting has also been used to predict the formation of cracks.6,7) The mechanical properties of semi-solid aluminum alloys have been measured for the thermal stress analysis as well.8,9) However, a simple and available prediction method for daily production has not been established.
This paper suggests two material indexes for estimating the surface crack sensitivity. Then, verification was carried out for A3000 and A5000 series aluminum alloys.
2. Experimental Method for Crack Sensitivity Assess-ment
For verification of crack sensitivity, 10 kinds of A3000 and A5000 series aluminum alloys shown in Table 1 were used. Solidification cracks can be avoided by grain refining. Because the objective of this paper is to clarify the effect of alloying elements on the crack sensitivity, grain refiners such as Ti-B and the elements inducing peritectic reaction with aluminum such as Zr and Cr, were not added.
[image:1.595.305.549.373.538.2]A vertical DC casting machine with a rectangular opening of 400 mm in width and 150 mm in thickness without taper was used. A5052 aluminum alloy was chosen for the mold and bottom block. The length from the molten metal level to the mold exit was 65 mm. A float-type metal level controller was applied and no molten metal distributor such as glass cloth was used. Rapeseed oil was used for lubricating the mold.
Table 1 Chemical compositions of aluminum alloys used for this work.
alloy Si (mass%)
Fe (mass%)
Cu (mass%)
Mn (mass%)
Mg (mass%)
a 0.10 0.20 0.50 0.23 4.80
b 0.01 0.01 0.11 0.43 4.75
c 0.01 0.01 0.13 0.35 4.65
d 0.30 0.43 0.25 1.06 1.35
e 0.10 0.40 0.40 1.00 1.10
f 0.10 0.40 0.60 1.00 1.10
g 0.10 0.40 1.00 1.30 0.80
h 0.10 0.40 1.00 0.60 0.40
i 0.10 0.40 3.00 0.40 0.40
j 0.85 0.01 0.70 1.60 0.10
*1This Paper was Originally Published in Japanese in J. JILM59(2009)
417–423.
*2Graduate Student, Waseda University
Table 2 shows the main casting conditions. The amount of cooling water was set at 100l/min. The casting temperature was set at9835K. As soon as the molten metal reached the target level, casting tests were carried out at different rates of 60, 80 and 100 mm/min. A visual check and a dye penetrant were used for determination of the cracks.
3. Result of Solidification Crack Test
[image:2.595.306.548.79.244.2]3.1 Assessment results of a solidification crack
Table 3 shows whether solidification cracks occurred or not for each alloy. The cracks were more likely to be found as the casting rate increased. Internal cracks were not found in the sliced section of the casting. Thus, all cracks were identified as surface cracks.
The solidification temperature range (TL-TS) under the equilibrium calculated by the thermodynamic software Thermo-Calc (Al database Ver. 5) is also listed in Table 3. It is found that a wider solidification temperature range was not necessarily more susceptible to cracking, which suggests that it is difficult to clarify the crack sensitivity using the solidification temperature range only.
3.2 Crack initiation point
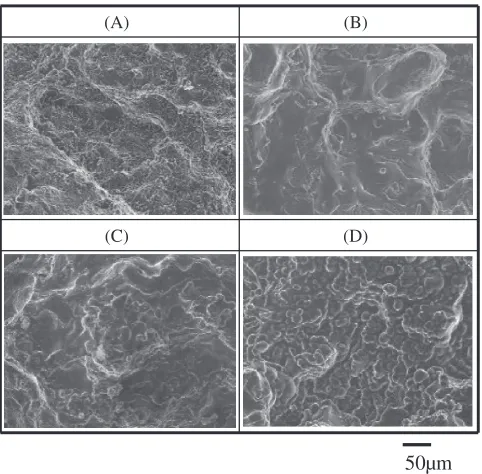
Figure 1 shows an example of the artificially fractured surface including solidification crack. The reference symbols x, y andz denote the width, thickness and depth (casting) directions, respectively. The crack propagated from the surface to the thickness center position and also propagated along the longitudinal direction to the end of the casting. To identify the crack initiation point, positions (A) through (D) of the fractured surface of Fig. 1 were observed by SEM.
As shown in Fig. 2, position (A) had a fractured surface in the solid phase in which no liquid film existed. It means that cracking occurred below the solidus temperature. On the other hand, in positions (B) and (C), the fractured surface was covered with a liquid film. Therefore, fracture occurred at a temperature higher than the solidus temperature. In position (D), fine dendrites were clearly observed. Thus, it could be judged that the position (D) fractured at a temperature still higher than those of the positions (B) and (C).
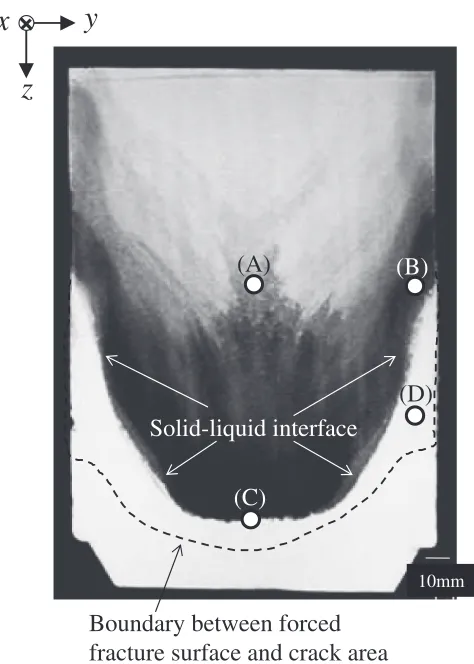
Figure 3 shows the observation of the solid-liquid inter-face after Al-10 mass%Zn molten metal was poured as a tracer during casting. Reference symbols (A) through (D) correspond to the SEM observation positions in Fig. 1. The positions (B) and (C) are located near the solid/liquid boundary. On the other hand, position (D) is located below the boundary.
Based on the results, therefore, position (D), near the surface of the ingot, should be identified as the crack initiation point.
Table 2 DC mold and casting conditions.
Ingot size (thicknesswidth) 150mm400mm
Cast temperature 9835K
Amount of cooling water 100l/min
Casting rate 60, 80, 100 mm/min
[image:2.595.46.293.85.156.2] [image:2.595.44.291.203.372.2]Metal head from mold end 65 mm
Table 3 Crack results by DC casting experiment and calculated solid-ification range.
alloy Casting rate (mm/min) Solidification
60 80 100 range (K)
a 74.9
b 54.9
c 54.2
d 28.1
e 29.5
f 34.7
g 41.2
h 35.2
i 74.4
j 38.4
: no crack,: crack
(B)
(D)
(C) (A)
Observation position fractured surface
10mm
ingot
z
y
x
z
y
x
Boundary between forced fracture surface and crack area
Fig. 1 Fractured surface of DC ingot.
(A) (B)
(C) (D)
50µm
[image:2.595.307.548.286.523.2]4. Discussion of the Crack Generation Mode and Crack Sensitivity Assessment Indexes
4.1 Setting of the solid fraction region where solid-ification crack occurs
At the solid-liquid coexistence region, a crack occurs due to the strain caused by the shrinkage of the solid phase portion. When a large amount of the liquid phase exists, the solid phase is scattered in the molten metal (Region I). If the solid phases fracture, the cracks are replenished with the melt and no solidification crack occurs. On the other hand, in the case that a sufficient amount of solid phase exists, once the solid phases fracture due to the shrinkage strain of the solid phase, no melt can enter the crack, and the solidification crack remains (Region II). The boundary between these two conditions can be expressed by the ZDT (zero ductility temperature). The values of ZDT have been reported by many researchers.4,10,11)The values of solid fraction corre-sponding to the ZDTs reported are located around 0.75. Therefore, in this paper, the solid fraction of 0.75 was set as the boundary between Region I and II. It is assumed that solidification crack occurs at the solid fraction greater than 0.75.
According to the high temperature mechanical character-istics, which were studied in the past, the fracture strain increases excessively when the solid fraction exceeds about 0.95.12)Thus, in this paper, it is assumed that in the region of
the solid fraction exceeding 0.95, alloys were ductile, and no cracking occurred (Region III). It is concluded that the origin of solidification crack has to be formed in Region II.
Incidentally, the relationship between the solid fraction and temperature was calculated by the thermodynamic software Thermo-calc (Al database ver. 5). As the micro-segregation became prominent in Region II, the Scheil-Gulliver module (model of no diffusion in the solid and complete mixing in the liquid) was used.
4.2 Estimation of the amount of strain and strain rate in the solid phase from the relationship between the temperature and solid fraction
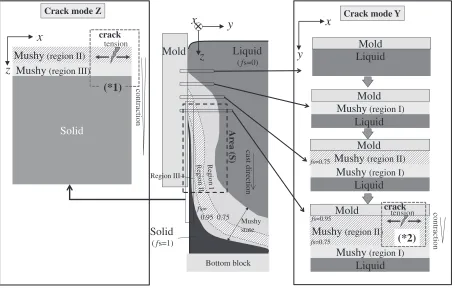
As shown in the above-mentioned position (D), the solidification crack is generated from the solid-liquid coex-istence zone near the ingot surface. Then the authors suggest that the following two crack modes.
(1) Crack mode due to strain differences in the Z-direction (casting direction)
As shown in the ‘‘crack mode Z’’ (1) of Fig. 4, in the
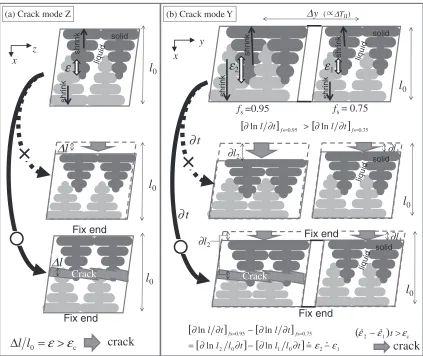
vicinity of the surface of the ingot, the amount of shrinkage in thexdirection must be different between the solid region and mushy region (Region II). Thus, tensile strain should occur in Region II. When the strain reaches the critical strain "c, cracking will occur. This crack mode is designated as ‘‘crack mode Z’’. The greater strain will be more susceptive for crack formation.
(2) Crack mode due to strain rate differences in the Y-direction (thickness Y-direction)
As shown in ‘‘crack mode Y’’ in Fig. 4, we suggested another crack mode caused by the difference of the strain rates in theY direction (thickness direction) in the ingot.
This crack mode is explained based on the following steps from (a) through (d).
(a) As can be seen from the calculated curve showing a relation between T and fs in Fig. 5, the curve indicates monotone decreasing and drops steeply with increase in solid fraction fs, if distribution coefficient k<1.
(b) In the steady state of heat extraction,fs=tshould be assumed as a constant value.
(c) From (a) and (b) above, T=t ð¼ ðT=fsÞ ðfs=tÞÞbecomes more negative with increasing fs because 0>T=tjfs¼0:75>T=tjfs¼0:95.
There-fore, the shrink rate of a dendrite skeleton becomes larger at higher solid fraction. It means that the shrink rate at fs¼0:75is larger than the rate at fs¼0:95. (d) Difference in this shrink rate (strain rate), shown in
Fig. 4(2), causes tensile strain.
(e) When the tensile strain reaches the critical strain, the cracking will occur.
This crack mode is designated as ‘‘crack mode Y’’. Each strain defined ‘‘crack mode Z’’ or ‘‘crack mode Y’’ was quantitatively examined by using a thermodynamic database.
4.2.1 Estimation method of strain"in ‘‘crack mode Z’’ and its crack index
The shrinkage of Region II is constrained by Region III and the solid phase (Fig. 4(1)). Thus, the tensile strain formed at Region II should be written as eq. (1).
(B)
(D)
(C)
(A)
10mm
z
y
x
Boundary between forced
fracture surface and crack area
Solid-liquid interface
[image:3.595.51.288.72.404.2]l=l0¼T ð1Þ
wherel,, andTdenote the length (m) around shrinkage, the linear expansion coefficient (1/K), and the temperature (K), respectively. The subscript 0 indicates the length before shrinkage. During solidification the linear expansion coef-ficient can be expressed by eq. (2). The subscripts S and L indicate the solid phase and liquid phase, respectively. The first term and the second term on the right side of eq. (2) indicate the linear expansion coefficients of the solid phase and the liquid phase, respectively.
¼SfSþLð1fSÞ ð2Þ Because the shape and size of the liquid phase depend on the clearance of the skeletal structure formed in the solid phase in Region II, the apparent liquid phase shrinkage must be constrained by the solid phase shrinkage. According to this assumption, L should be equal to S, and the linear expansion coefficient can be expressed by eq. (3).
S ð3Þ
Consequently, the strain½l=l0IIof Region II expressed by eq. (3) can be rewritten by eq. (4).
½l=l0II¼STII ð4Þ
TIIdenotes the difference between temperatures (T1and
T2) at the solid fractions of 0.75 and 0.95, respectively. This
equation indicates that the strain is proportional toTII. This TIIcan be estimated with Thermo-Calc (Fig. 5). Therefore, TII was designated as one of the quantitative indexes that indicates crack sensitivity. As schematically shown in Fig. 6(a), it is assumed that cracking is less likely to occur whenTII(the brittle temperature range) is small.
4.2.2 Estimation method of strain rate"in ‘‘crack mode Y’’ and its crack index
The local strain @l=l in Region II can be expressed by eq. (5) using the linear expansion coefficient of the solid phases.
@l
l ¼@lnl¼S@T ð5Þ In the area (S) in Fig. 4, the solidification shell grows perpendicular to the mold. This area is around the position
Liquid
(fs=0)
Mold
Solid
(fs=1)
cast direction
Mushy state
Mushy
(region I)Liquid
Liquid
Mushy (region II)
Mushy (region I)
Liquid
fs= 0.95 0.75 Region III
Mushy (region II)
Mushy (region I)
Liquid
fs=0.75
fs=0.95
Mold
Mold
Mold
Mold
crackfs=0.75
contraction
Bottom block
Mushy (region II)
Mushy (region III)
Solid
tension crack
contraction
Crack mode Z Crack mode Y
z
y
x
z
x
y
x
(*1)
tension
(*2)
Ar
ea (S)
Fig. 4 Scheme of crack generation model.
Solid fraction fs (b) Parameter of the
strain rate difference
∆RII/∆TII(=(R1-R2)/∆TII) (a) Brittle temperature range
Region II
Region III Region
I
T
emperature
T
/K
R1
R2
∆TII T1
T2
0.95 0.75 0
Fig. 5 Temperature-solid fraction curve calculated of ‘‘alloy g’’ and crack sensitivity indexes calculated by relationship between solid fraction and temperature. (a) Brittle temperature range, TII. (b) Parameter of the
[image:4.595.72.527.73.370.2] [image:4.595.63.271.402.585.2](D) in Fig. 3. Thus, it is assumed that the heat transfer from the liquid phase to the solid phase is perpendicular to the mold. There is no change in heat fluxes in the thickness direction. The heat fluxes can be expressed by temperature changes of the solid and the liquid phase, and the latent heat by phase changes, as given by eq. (6).13)q,CCPandLdenote the heat fluxes (W/m2), average specific heat (J/kgK) and solidification latent heat (J/kg) of the solid and liquid phases, respectively. The parameters m, A, and t mean the total, including solid and liquid phases, mass (kg), heat transfer cross-sectional area (m2), and time (s), respectively.
q¼mCP
A @T @t t þmL A @fS
@t t
¼const. for theydirection ð6Þ
Equation (6) can be expanded to the following equation:
@t¼ m
qAðCP@TþL@fSÞ ð7Þ By dividing eq. (7) by eq. (5), we have
@t
@lnl¼ m
SqA
CPþL @fS
@T
ð8Þ
The left-hand side of eq. (8) is a reciprocal of the strain rate. This strain rate is expressed by a reciprocal of the temperature change to the unit change in solid fraction,
@[email protected] the right side is not greatly varied by alloys or temperatures. The specific heatCPis the physical properties, which only vary by less than 1% for Al-Mn and Al-Mg conventional alloys. Therefore, the reciprocal of the left side of eq. (8) increases as@T=@fS, as shown in eq. (9).
@lnl @t /
SqA
mL @T
@fS
ð9Þ
Equation (9) indicates that when @T=@fs becomes large, @lnl=@t, which is equivalent to the strain rate, becomes large. Because @T=@fs is estimated from the computations of Thermo-calc using eq. (9), the quantitative value of@lnl=@t was obtained.
As shown in Fig. 5, a large difference will be found in the temperature gradient for solid fractions between 0.75 and 0.95, which are the ends of Region II.
R1
@T
@fS
fS¼0:75
<0; R2
@T
@fS
fS¼0:95
<0;
jR1j<jR2j ð10Þ
As shown in eq. (10), by settingR1 (K) andR2 (K), we can
obtain the quantitative value of the strain rate difference of the target alloy. The crack sensitivity in crack mode Y must be proportional to R1R2. However, when the positions
between solid fractions 0.75 and 0.95 are separated distantly, the crack sensitivity should become lower. This distancey
crack
solid
shrink
shrink
ε
(a) Crack mode Zl
0∆
l
Fix end Fix end x z Crack c 0=
ε
>
ε
∆
l
l
l
0∆
l
fs=0.95
shrink
shrink
(b) Crack mode Y
ε
2l
0l
0∂l1 ∂l2
∂
t
fs= 0.75 solid shrink shrink solid
ε
1 x y∆
y ( ∆TII)[
[
[
2 0[
1 0 2 1 s=0.75 s=0.95ln ln ln ln ε ε − = ∂ ∂ − ∂ ∂ = ∂ ∂ − ∂ ∂ t l l t l l t l t
l f f
crack
[
∂lnl ∂t fs=0.95 >[
∂lnl ∂t fs=0.75l
0∂l1 ∂l2
Fix end solid Crack
∂
t
Fix endl
0(
ε2−ε1 t>εc]
]
]
]
]
)
]
[image:5.595.86.509.71.427.2](m) in the y-direction is proportional to the temperature differenceTII. Therefore, the crack sensitivity is expressed by eq. (11),
R1R2
y /
R1R2
TII
RII=TII ð11Þ
[image:6.595.313.540.71.267.2]This equation means when RII=TII is large, the crack sensitivity becomes large, schematically shown in Fig. 6(b). Based on this,RII=TII is used as another index to show the crack sensitivity. Hereinafter, we call this parameter the strain rate difference.
Figure 7 schematically shows the crack sensitivity of crack mode Y as viewed from the relationship between the solid fraction and temperatures. In the cases of (X) and (Z) in which the gradients at the both ends of Region II are same, crack sensitivity should be low. In the case of (Y), cracking is likely to occur due to large difference in the gradients.
4.2.3 Relation between the solidification crack and two crack indexes
When the strainl=l0expressed by the brittle temperature
rangeTIIis large, cracking is likely to occur in crack mode Z. When the difference of the strain ratelnl=texpressed by the parameter of the strain rate difference RII=TII is large, cracking in crack mode Y is likely to occur. Consequently, as both indexes calculated by alloy composi-tion increase, cracking is more likely to be generated.
4.2.4 Verification of crack assessment results
Figure 8 shows the results of crack sensitivity assessment by crack sensitivity indexes. Thexandyaxes areTIIand RII=TIIrespectively. The computed value of both indexes of each alloy is plotted in this figure. In addition, the casting rates at which cracking occurs are shown by in order of difficulty to crack. The L-letter boundary lines in Fig. 8 are the crack boundary by various casting rates (60, 80 and 100 mm/min).
The highest upper boundary indicates that alloys with large values in bothTIIandRII=TIIgenerate cracking even in low-speed casting of 60 mm/min. Consequently, as a method for identifying the DC solidification crack sensitivity, the indexesTIIandRII=TIIcan be used sufficiently.
5. Technique for Assessing Effect of Alloying Elements on Crack
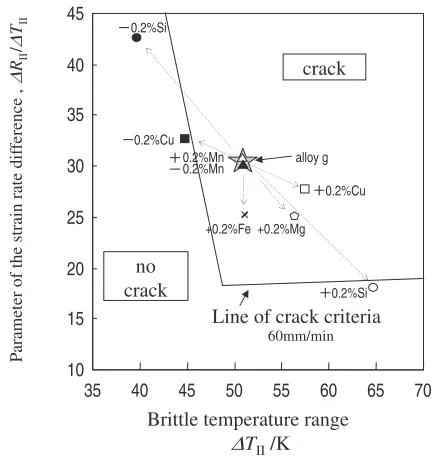
The effects of the addition of alloy element (Si, Fe, Cu, Mn, and Mg) on the crack sensitivity of alloy g were estimated on the basis of the graph in Fig. 8. Figure 9 is an enlarged view of the vicinity of alloy g. It indicates that the prediction results with each element concentration increased and decreased by 0.2 mass%. The L-letter line in the figure shows the crack boundary line of 60 mm/min. The figure indicates that the addition of various kinds of elements varies the crack sensitivity. Si brings the crack sensitivity to the ‘‘no crack’’ region by both addition and reduction, which indicates that Si is effective to suppress the cracking. When Mg or Fe is added, RII=TII decreases, and the crack sensitivity slightly approaches the difficult-to-crack region. Region II Region III Region I 0.75 0 T emperature T /K (X) (Y) (Z)
∆RII/∆TII: (Y)>>(X)(Z)
0.95
Solid fraction fs
∆RII=R1-R2 R1=[∂T/∂fs]fs=0.75
R2=[∂T/∂fs]fs=0.95
Fig. 7 Comparison of ‘‘Parameters of the strain rate difference
RII=TII’’.
80mm/min 60mm/min
100mm/min
Line of crack criteria crack b d j e f g h i c a 0 5 10 15 20 25 30 35 10 no crack 40 45 a-j: alloy × ×
Brittle temperature range ∆TII/K
P
arameter of the stra
in rate dif
ference ,
∆
RII
/∆
TII mark
× 100 no crack crack crack crack 80 no crack no crack crack crack 60 no crack no crack no crack crack Casting rate (mm/min)
30 50 70 90 110 130 150
Fig. 8 Crack sensitivity assessment of each alloy by crack sensitivity indexes. alloy g +0.2%Mg +0.2%Fe 10 15 20 25 30 35 40 45 35 crack no crack 60mm/min
Line of crack criteria
Brittle temperature range
∆TII/K
P
arameter of the strain rate dif
ference , ∆ RII / ∆ TII
40 45 50 55 60 65 70
0.2%Si 0.2%Cu 0.2%Mn 0.2%Mn 0.2%Cu 0.2%Si
[image:6.595.62.279.73.257.2] [image:6.595.317.533.317.546.2]Furthermore, the addition of Cu or Mn scarcely causes any changes in crack sensitivity.
Therefore, the present technique will quantitatively predict the effects of alloying elements by the use of the two crack sensitivity indexes. This method can be utilized in the alloy design stages to control the crack sensitivity before casting.
6. Conclusions
In this work, two available indexes are suggested to control the crack sensitivity for aluminum DC casting in the alloy design stage.
(1) The solid-liquid coexisting zone should be separated into the three regions:
hRegion IiNo crack region.
Healing by liquid is available under fs¼0:75.
hRegion IIiHigh crack sensitivity region.
In this work, Region II is defined between fs¼0:75 and fs¼0:95.
hRegion IIIiNo crack region.
This region is in the high ductility area overfs¼0:95. (2) The first index for the solidification crack is TII because the strain formed in Region II is proportional to TII. This index is written as½l=l0II¼STII. (3) The second one is RII=TII because the strain rate
difference in Region II is proportional to this index. This index is written as @lnl=@t/@T=@fS and
ð½@T=@fSfS¼0:75 ½@T=@fSfS¼0:95Þ=TIIRII=TII. (4) The tendency of the solidification crack is successfully
estimated by thermo dynamical calculation of these indexes. The availability of this method was verified by A3000 and A5000 aluminum alloy DC casting.
REFERENCES
1) M. G. Chu: Mat. Sci. and Eng. A179(1994) 669–675.
2) M. Chikuda, Y. Miyagi and M. Hino: Kobe Steel Engineering Reports,
22, 4 (1972) pp. 104–109.
3) C. D. Mayes, D. G. McCartney and G. J. Tatlock: Light Metals1992
(1992) 813–819.
4) H. Nagaumi, P. Suvanchai, T. Okane and T. Umeda: Mater. Trans.47
(2006) 2918–2924.
5) J. M. Drezet and M. Rappaz: Modeling of Casting, Welding and Advanced Solidification Process VIII (1998) pp. 883–890.
6) J. M. Drezet and M. Rappaz: Light Metals1997(1997) 1071–1080. 7) J. M. Drezet and M. Rappaz: Metall. Trans. A30A(1999) 449–455. 8) T. Watanabe, R. Kimura, T. Nakazawa, H. Chiba, S. Tanaka, T. Ueki,
T. Toriyama and M. Yoshida: J. JILM58(2008) 395–405.
9) T. Watanabe, R. Kimura, T. Nakazawa, H. Chiba, S. Tanaka, T. Ueki, T. Toriyama and M. Yoshida: J. JILM58(2008) 464–472.
10) T. Isobe, M. Kubota and S. Kitaoka: IMONO50(1978) 425–427. 11) H. Mizukami, Y. Shirai and A. Yamanaka: ISIJ Int.46(2006) 1040–
1046.
12) H. Mizukami, S. Hiraki, M. Kawamoto and T. Watanabe: Tetsu-to-Hagane´84(1998) 763–769.