The In
fl
uence of CoNiCrAlY Addition on the High Temperature Corrosion
Behavior of CrSi
2Alloy in an Air
Na
2SO
4
NaCl Gas Atmosphere
Toto Sudiro
1,+1, Tomonori Sano
1,+2, Shoji Kyo
2, Osamu Ishibashi
3,
Masaharu Nakamori
4and Kazuya Kurokawa
51Graduate School of Engineering, Hokkaido University, Sapporo 060-8628, Japan 2Kansai Electric Co. Inc., Amagasaki 661-0974, Japan
3Osaka Fuji Corporation, Takaishi 592-0001, Japan
4High Temperature Corrosion & Protection Technosearch Co. Ltd., Takasago 676-0082, Japan 5Center for Advanced Research of Energy and Materials, Faculty of Engineering, Hokkaido University, Sapporo 060-8628, Japan
In this study, an attempt has been made to improve the resistance of CrSi2alloy toward high temperature corrosion and promote the formation of a continuous and slow-growing SiO2scale on the alloy surface. For this purpose, spark plasma sintering was used to fabricate the CrSi2alloys containing various amounts of CoNiCrAlY. The sintered alloys were then corroded isothermally in an airNa2SO4NaCl gas atmosphere at three different temperatures of 923 and 1073 K for up to 720 ks and at 1273 K for 72 ks. XRD, SEM and SEM-EDS were utilized to examine the alloy structures and compositions before and after the high temperature corrosion test. The influence of CoNiCrAlY addition on the high temperature corrosion behavior of the CrSi2alloy was clarified. [doi:10.2320/matertrans.MAW201210]
(Received April 25, 2012; Accepted June 5, 2012; Published July 25, 2012)
Keywords: CrSi2CoNiCrAlY, high temperature corrosion, gas atmosphere, sodium sulfate, sodium chloride
1. Introduction
Owing to its high melting point (1750 K), relatively low
density (4.6 g cm¹3) and outstanding resistance to oxidation
in air, chromium disilicide (CrSi2) has become an attractive
material for energy-related high temperature applications.1,2)
The excellent oxidation resistance of this material is ascribed
to the formation of a protective SiO2scale. In our study, CrSi2
has been taken into consideration as a candidate coating material of commercial alloys for use in corrosive boiler atmospheres. However, the previous results indicated that at temperature of 1073 K and in the corrosive atmosphere
containing Na2SO4and NaCl, the CrSi2alloy was susceptible
to severe internal corrosion because they didn’t serve the
formation of a continuous SiO2 layer.3,4) Accordingly, a
considerable amount of additional elements is necessary to improve the corrosion resistance of this alloy.
In further study, we have succeeded in developing a
continuous, dense and protective SiO2 scale on the surface
of CrSi2 alloys under the same atmospheric conditions by
adding varying Ni content.3,4) The establishment of (Cr, Ni)
Si and (Cr, Ni)2Si phases in the CrSi2Ni alloys seems to
have a strong influence in promoting the growth of a
continuous SiO2 scale. As a result, an internal corrosion
(sulfides and chlorides formation) was completely sup-pressed. However, there is still a noticeable concern that
the thickness of a SiO2 scale appears to increase with the
content of Ni in the alloys.3,4) Thus, an attempt to find out
how to develop a slow-growing SiO2 scale has become an
essential feature, especially for long exposure times. To elucidate the above problems, we deal with the addition
of alumina-forming material (CoNiCrAlY)5,6) to the CrSi
2
alloy. We expect that the presence of Ni and Co elements can result in the generation of Ni or Co-silicides phases, which may play a role in promoting the formation of a continuous
SiO2scale, and the presence of Al element can contribute to
the formation of an Al2O3 scale at the SiO2/alloy interface.
Expectingly, this oxide layer has a good effect in suppressing
the growth of a SiO2scale by retarding the inward diffusion
of oxygen.
In the present study, the influence of CoNiCrAlY addition
on the high temperature corrosion behavior of CrSi2
alloy exposed to an airNa2SO4NaCl gas atmosphere is
clarified.
2. Experimental Procedures
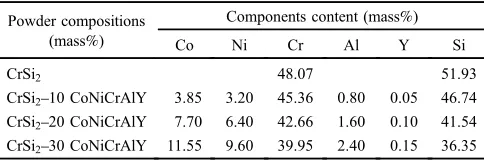
The nominal compositions of respective elements of
CrSi2CoNiCrAlY powders (in mass%) used in this study
are shown in Table 1. The CrSi2CoNiCrAlY alloys were
prepared by applying the same procedures and technique as
that for fabrication of the CrSi2Ni alloys.3,4) The powders
were fully sintered for 1.982.88 ks in a temperature range of
11231273 K.
Cut specimens with average dimensions of length 11.4 mm, width 5.8 mm and thickness 1.5 mm were ground
[image:1.595.306.548.706.786.2]to 1 µm diamond pastefinish and then cleaned ultrasonically
Table 1 Nominal compositions of respective elements of CrSi2 CoNiCrAlY powders.
Powder compositions (mass%)
Components content (mass%) Co Ni Cr Al Y Si
CrSi2 48.07 51.93
CrSi210 CoNiCrAlY 3.85 3.20 45.36 0.80 0.05 46.74 CrSi220 CoNiCrAlY 7.70 6.40 42.66 1.60 0.10 41.54 CrSi230 CoNiCrAlY 11.55 9.60 39.95 2.40 0.15 36.35
+1Graduate Student, Hokkaido University
in an ethanol solution for 0.9 ks. The experimental set-up for the high temperature corrosion test is similar to the one that has been already reported schematically in our previous
study.7) The test specimens were put in a lidded alumina
crucible containing a salt mixture of Na2SO4+25.7 mass%
NaCl and then corroded isothermally in a muffle furnace for up to 720 ks at elevated temperatures of 923 and 1073 K and for 72 ks at 1273 K. The salt mixture used in this study
is near to the eutectic composition of Na2SO4 and NaCl
which has a melting point of 901 K.8)Accordingly, the test
specimen would be exposed to an air containing salt
vapor of a quasi-eutectic melt of Na2SO4 and NaCl. After
completion of the corrosion test, the specimens were then removed from a muffle furnace and cooled to room temperature.
To measure the thickness loss of alloy substrate and observe the depth of an internal attack zone, the corroded alloys were fractured in liquid nitrogen. For elemental mapping analysis, the some specimens were mounted in the epoxy resin, sectioned and polished down to 1 µm diamond
paste finish. XRD, SEM and SEM-EDS analysis were
utilized to examine the structure and composition of the alloys before and after the high temperature corrosion test. Finally, based on the corrosion kinetic data and structures of
the oxide scales formed on the alloy surface, the influence
of CoNiCrAlY addition on the high temperature corrosion
behavior of CrSi2alloy is discussed.
3. Results and Discussion
3.1 Structures and compositions of sintered alloy
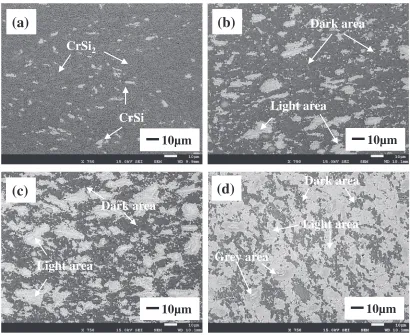
The microstructures of CrSi2CoNiCrAlY alloys before the
high temperature corrosion test fabricated by spark plasma
sintering are shown in Fig. 1. In the CrSi2 alloy, small
precipitations of CrSi phase are dispersed in the alloy matrix.
On the other hand, in the CrSi2 alloys with various
CoNiCrAlY content, the alloys comprise two major regions:
the dark area composed primarily of CrSi2phase and the light
area composed of CrSi, Cr3Si and CoNi silicides phases.
As can be seen from Figs. 1(b), 1(c) and 1(d), the volume fraction of light area increases with increase in CoNiCrAlY content.
The results of EDS semi-quantitative analysis also indicate that the Al content in the light areas increases with increase in
CoNiCrAlY content. For instance, in the CrSi2 alloys with
30 mass% CoNiCrAlY content, it is around 24% by molar
amount. Furthermore, the localized grey area in this alloy is
confirmed as Cr2Si.
3.2 High temperature corrosion behavior of CrSi2 CoNiCrAlY alloys
3.2.1 High temperature corrosion at 923 K
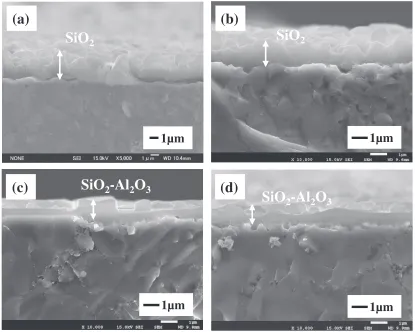
Figure 2 shows the kinetic curves of corrosion of CrSi2
CoNiCrAlY alloys exposed to an airNa2SO4NaCl gas
atmosphere at 923 K for up to 720 ks. Figure 3 shows the
(a)
(b)
(c)
(d)
CrSi
2CrSi
Grey area
Light area
Dark area
10µm
10µm
10µm
10µm
Dark area
Light area
Dark area
Light area
[image:2.595.93.503.68.403.2]fractured cross-sectional SEI micrographs of CrSi2 alloys
with 0, 10, 20 and 30 mass%CoNiCrAlY content after 720 ks
exposure.
The kinetic results reveal that the CrSi2 alloy exhibits
somewhat higher consumed thickness of alloy compared with
the CoNiCrAlY-added CrSi2alloys. Moreover, the corrosion
kinetics have a tendency to decrease with increase in CoNiCrAlY content in the alloys. As can be seen in Fig. 2,
in the CrSi2 alloys with 20 and 30 mass% CoNiCrAlY
content, a slight increase in the consumed thickness of alloy is observed after 72 ks exposure.
The metallographic observation indicates that the struc-tures of the oxide scale depend on the CoNiCrAlY content.
The CrSi2 alloys with 0 and 10 mass% CoNiCrAlY content
form mostly a SiO2scale. However, according to the results
of X-ray diffraction analysis, there is a difference in the
crystal structure of a SiO2 scale on the both alloys. The
CoNiCrAlY-free alloy forms mainly trydimite-SiO2while the
CrSi2alloy with 10 mass%CoNiCrAlY content forms mainly
cristobalite-SiO2. Accordingly, a high consumed thickness
of the CrSi2 alloy may be caused by the fact that oxygen
can diffuse inward easily through trydimite-SiO2than that of
cristobalite-SiO2. On the other hand, the CrSi2alloys with 20
and 30 mass% CoNiCrAlY content form the oxide scales
composing of SiO2and Al2O3.
At this temperature, a continuous, compact and protective
oxide scales are formed on the surface of CrSi2CoNiCrAlY
alloys. Consequently, these four alloys exhibit a high resistance against internal corrosion and oxidation.
3.2.2 High temperature corrosion at 1073 K
Figure 4 shows the kinetic curves of corrosion of CrSi2
CoNiCrAlY alloys exposed to an airNa2SO4NaCl gas
atmosphere for up to 720 ks at 1073 K. The fractured
cross-sectional SEI micrographs of CrSi2alloys with 0, 10, 20 and
30 mass% CoNiCrAlY content after corroded for 720 ks are
shown in Fig. 5.
As can be seen, the CoNiCrAlY-free alloy suffers the highest consumed thickness of alloy compared with the other three alloys. A significant difference in the consumed 750
600 450
300 150
0 0 2 4 6 8 10 12
Consumed Thickness
of
Alloy
,
d
/
µ
m
Corrosion Time, t/ks CrSi
2 CrSi
2-10CoNiCrAlY
CrSi
2-20CoNiCrAlY
CrSi
2-30CoNiCrAlY
Fig. 2 Kinetic curves of corrosion of CrSi2CoNiCrAlY alloys corroded for up to 720 ks at 923 K in an airNa2SO4NaCl gas atmosphere.
1µm
1µm
SiO
2SiO
2SiO
2-Al
2O
3(a)
(b)
(c)
(d)
SiO
2-Al
2O
31µm
1µm
[image:3.595.67.272.70.229.2] [image:3.595.91.506.430.762.2]thickness of alloy at 1073 K is attributed to the formation of
severe internal products beneath a SiO2 scale. As explained
previously,3)the CrSi2alloy doesn’t form a continuous SiO2
scale at this temperature. As a result, the aggressive elements of the salts can easily diffuse inwardly and react with the alloy components to form the internal products of sulfide and chloride.
On the contrary, the corrosion resistance of CrSi2alloy is
improved by the addition of CoNiCrAlY because they can
promote the formation of more uniform a SiO2 scale on
the CrSi210 mass% CoNiCrAlY alloy and the oxide scale
consisting of SiO2, Al2SiO5 and Al2O3on the CrSi220 and
30 mass%CoNiCrAlY alloys. Accordingly, a high protection
to the inward diffusion of oxygen and aggressive elements of the salt is provided for these alloys. Additionally, the results
also clearly demonstrate that the addition of 20 and 30 mass%
CoNiCrAlY leads to decrease in the consumed thickness of
CrSi2CoNiCrAlY alloys. The formation of Al2SiO5 scale
on these alloys is resulted from the reaction of SiO2 and
Al2O3scales.9)
3.2.3 High temperature corrosion at 1273 K
The consumed thickness of CrSi2alloys with 0, 10, 20 and
30 mass% CoNiCrAlY content exposed to an airNa2SO4
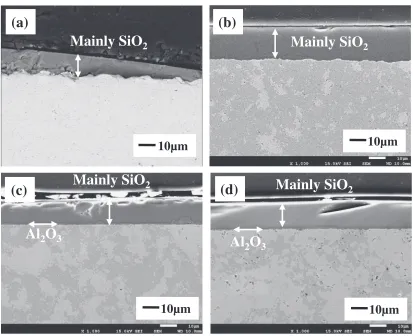
NaCl gas atmosphere for 72 ks is shown in Fig. 6. The cross-750
600 450
300 150
0 0 2 4 6 8 10 12
Consumed Thickness
of
Alloy
,
d
/
µ
m
Corrosion Time, t/ks
CrSi2
CrSi2-10CoNiCrAlY
CrSi2-20CoNiCrAlY
CrSi2-30CoNiCrAlY
Fig. 4 Kinetic curves of corrosion of CrSi2CoNiCrAlY alloys corroded for up to 720 ks at 1073 K in an airNa2SO4NaCl gas atmosphere.
1µm
1µm
1µm
Internal
corrosion
SiO
2SiO
2SiO
2-Al
2O
3(a)
(b)
(c)
(d)
SiO
2-Al
2O
31µm
Fig. 5 Fractured cross-sectional SEI micrographs of CrSi2alloys with (a) 0, (b) 10, (c) 20 and (d) 30 mass%CoNiCrAlY content corroded for 720 ks at 1073 K in an airNa2SO4NaCl gas atmosphere.
0 0 2 4 6 8 10 12
Consumed Thickness
of
Alloy
,
d
/
µ
m
CoNiCrAlY content (mass%) 30 20
10
[image:4.595.67.271.68.228.2] [image:4.595.334.520.70.216.2] [image:4.595.95.504.272.601.2]sectional micrographs of CrSi2CoNiCrAlY alloys after 72 ks exposure are presented in Fig. 7.
From the graphs, we can see that the consumed thickness
of CrSi2 alloys slightly rises with the addition of 10 mass%
CoNiCrAlY. However, it tends to decrease by the addition of
20 and 30 mass%CoNiCrAlY.
The cross-sectional observation reveals that these four alloys offer a high corrosion resistance attributed to the
formation mainly of a continuous and dense SiO2scale on the
CrSi2 alloys with 0 and 10 mass% CoNiCrAlY content, and
a duplex oxide layer consisting mainly of SiO2 containing
some amount of Al-oxide in the outer layer and Al2O3in the
inner layer on the CrSi2 alloys with 20 and 30 mass%
CoNiCrAlY content.
The results also indicate that after 72 ks exposure, the effect of CoNiCrAlY addition on the corrosion resistance is not clearly seen. Accordingly, by considering the structure of the alloy, the thickness and structure of the oxide scale, we believe that an increase in the thickness of oxide scale on
the CrSi2alloy by the addition of CoNiCrAlY is influenced
strongly by the alloy structure. As aforementioned, the volume fraction of new phases increases with increase in CoNiCrAlY content in the alloy. Their formation appears to
play a key role in enhancing the growth of SiO2scale. On the
other hand, the effect of alumina formation at the SiO2/alloy
interface on the CrSi2 alloys with 20 and 30 mass%
CoNiCrAlY content may become visible in longer exposure time.
The results of EDS elemental maps also indicate that with increase in corrosion temperature, the distribution of sodium
element in the SiO2 scales tends to be more noticeable.
The same reason for this evidence has been described in
our previous study.4)Interestingly, the sodium distribution is
remarkably suppressed in an Al2O3scale. This may be related
to the eutectic temperature of sodium aluminate which is higher than that of sodium silicate and the corrosion
temperature.10)
3.3 Influence of CoNiCrAlY addition
Summarizing the results of this study, the addition of
CoNiCrAlY to the CrSi2 alloy leads to the formation of
new phases as CrSi, Cr3Si and CoNi silicides in the CrSi2
CoNiCrAlY sintered alloys and promote the formation of a
continuous and dense SiO2 scale and oxide scale consisting
of SiO2, Al2SiO5 and Al2O3, depending on the alloy
composition and temperature.
The major reason for why the establishment of new phases can promote the formation of a protective oxide scale may be explained by that the new phases and the phase boundaries in
alloys seem to allow the higher flux of the outward silicon
diffusion. As a result, they can lead to the promotion of the
formation of a continuous and denser SiO2scale on the alloy
surface.
Next, we would like to consider the effect of Al on the formation of a protective scale. As mentioned before, with increase in the CoNiCrAlY content, the Al content in the
Mainly SiO
210µm
Al
2O
3Mainly SiO
2Mainly SiO
2Mainly SiO
2Al
2O
3(a)
(b)
(c)
(d)
10µm
10µm
10µm
[image:5.595.92.505.66.402.2]light areas also tends to increases and its effect on the corrosion resistance tends to be more pronounced in longer exposure times (for instance, after 72 ks exposure at 923 and
1073 K). The CrSi220 and 30 mass% CoNiCrAlY alloys
form not only a protective SiO2 scale but also Al2O3 and
Al2SiO5 scales, as described above. The formation of an
Al2O3 scale on the alloy surface appears to play a role in
suppressing the inward diffusion of oxygen, sulfur and chlorine. Accordingly, the consumed thickness of the alloy
tends to decrease with the addition of 20 and 30 mass%
CoNiCrAlY.
The mechanism of a duplex oxide layer formation on the
surface of CrSi2 alloys with 20 and 30 mass% CoNiCrAlY
content can be shown schematically in Fig. 8 and explained in more detail as follows. Initially, oxygen and aggressive elements of the salts react with the alloy substrate (Fig. 8(a)). Owing to the high content of Si in the alloys, Si is preferentially oxidized (Fig. 8(b)). This results in the
formation of a SiO2 layer on the alloy surface (Fig. 8(c)).
However, it is important to note that the alloy also contains Al element which has a strong affinity for oxygen. For that reason, Al element in the alloy substrate diffuses outwardly
and reacts with SiO2to form mainly Al2O3at the SiO2/alloy
interface (Fig. 8(d)):
2Alþ32SiO2 !Al2O3þ32Si ð1Þ
The released Si is then gradually re-oxidized to form a SiO2
scale. At the oxide interfaces, the reaction between Al2O3and
SiO2seems to take place, resulting in the formation of SiO2
-Al2O3scales (Fig. 8(e)).
4. Summary
The influence of CoNiCrAlY addition on the high
temperature corrosion behavior of CrSi2 alloy was
inves-tigated and clarified in an airNa2SO4NaCl gas atmosphere.
The obtained results can be summarized as follows:
(1) The addition of CoNiCrAlY to the CrSi2 alloy
contributes in the formation of a continuous and dense
oxide scale on the alloy surface. As the result, the attack of aggressive elements of the salts doesn’t occur the underneath alloy.
(2) The establishment of an Al2O3 scale at the SiO2/alloy
interface has beneficial effect in retarding inward diffusion of oxygen and other aggressive elements, leading to suppression of the consumed thickness of alloy in longer exposure time.
(3) Considering the alloy fabrication, microstructure and
corrosion resistance, the CrSi2 alloy with 20 mass%
CoNiCrAlY content offers the highest performance as a candidate coating material.
Acknowledgements
The authors thank the Japan Society for the Promotion
of Science (JSPS) for financial support and also Akira
Yamauchi, Ph.D. for his excellent and valuable technical assistance.
REFERENCES
1) T. S. R. Ch. Murthy, J. K. Sonber, C. Subramanian, R. K. Fotedar, Sunil Kumar, M. R. Gonal and A. K. Suri:Int. J. Refract. Metals Hard Mater.
28(2010) 529540.
2) K. Kurokawa and A. Yamauchi: Solid State Phenomena127(2007) 227232.
3) T. Sudiro, T. Sano, A. Yamauchi, S. Kyo, O. Ishibashi, M. Nakamori and K. Kurokawa:Mater. Sci. Forum696(2011) 272277.
4) T. Sudiro, T. Sano, S. Kyo, O. Ishibashi, M. Nakamori and K. Kurokawa:Defect Diffusion Forum323325(2012) 353358. 5) I. Gurrappa:J. Mater. Sci. Lett.20(2001) 22252229.
6) J. R. Nicholls, N. J. Simms, W. Y. Chan and H. E. Evans:Surf. Coat. Technol.149(2002) 236244.
7) T. Sudiro, T. Sano, S. Kyo, O. Ishibashi, M. Nakamori and K. Kurokawa:Mater. Trans.52(2011) 433438.
8) L. P. Cook, H. F. McMurdie and H. M. Ondik:Phase Diagrams for Ceramists, Volume VII, (The American Ceramic Society, Inc., Westerville, Ohio, 1989) p. 118.
9) R. C. Newton and C. E. Manning:Chem. Geol.249(2008) 250261. 10) E. M. Levin, C. R. Robbins and H. F. McMurdie:Phase Diagrams for Ceramists 1969 Supplement, (The American Ceramic Society, Inc., Columbus, Ohio, 1969) p. 81.
CrSi2-20, 30 CoNiCrAlY Alloys
Air
Al3+ Al3+
(a)
Salt vapor generated from a quasi-eutectic melt of Na2SO4and NaCl
O2 O2 O2 Na2O SO3 Cl2
Al Al
Al Al Al Al
O2- O
2 Na+ S
2-Cl
-(b) (c)
Al
O2- O
2 Na+ S
2-Cl
-(d) (e)
Al Al Al
O2- O
2 Na+ S
2-Cl -SiO2
SiO2–Al2O3
Al2O3 SiO2
Al2O3
[image:6.595.113.488.74.269.2]