Damping Capacity of Fe
17mass
%
Mn High Damping Alloy
with Variant Controlled Microstructure
Yoshimi Watanabe
+, Yuusuke Suga, Hisashi Sato, Hideaki Tsukamoto and Yoichi Nishino
Nagoya Institute of Technology, Nagoya 466-8555, Japan
In our previous study, it is reported that damping capacity as well as hardness of an Fe20 mass%Mn alloy can be improved by the thermo-mechanical training featured by rolling deformation. In this study, the thermo-thermo-mechanical training of an Fe17 mass%Mn alloy is carried out with bending mode, since vibration manner of the internal friction measurement refers to bending mode. An anisotropic damping capacity is observed for samples subjected to bending mode training. Moreover, the trade-off between the damping capacity and hardness can be overcome by thermo-mechanical training. To be concluded, the thermo-mechanical training is useful for enhancement of damping properties and hardness of FeMn alloys. [doi:10.2320/matertrans.ME201305]
(Received November 21, 2012; Accepted April 2, 2013; Published May 17, 2013)
Keywords: damping capacity, ironmanganese alloy, high damping alloy, anisotropy, variant, marteisitic transformation, hardness
1. Introduction
As one of actuator materials, shape memory alloys (SMAs) are well studied. A high damping capacity is considered as one of the important functional properties of SMAs. For example, it is well known that TiNi and CuAlMn SMAs can exhibit high damping capacity.13) Those properties are related to a martensitic transformation.
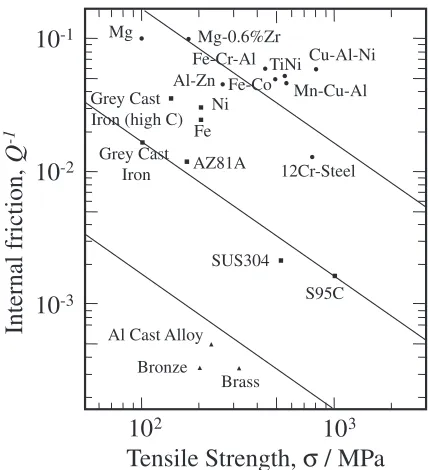
In the meantime, it is well recognized that the increase of damping by traditional methods results in a reduction of the strength of mechanical properties.4) Figure 1 shows an internal friction,Q¹1, vs. tensile strength map, where most of metallic materials are classified into three groups, the high-, intermediate- and low-damping materials.5) Therefore, the trade-off relation between the damping capacity and strength must be overcome.
The FeMn based alloys undergoing martensitic trans-formation from £-austenite (fcc) to ¾-martensite (hcp) are known as low-cost high-damping alloys. It is reported that the damping sources of FeMn alloys were¾-martensite variant boundaries, stacking faults in £-austenite and ¾-martensite and £/¾ interphase boundaries.6) According to our previous studies,7,8) it is found that the damping capacity of an Fe 20 mass%Mn alloy, as well as hardness, can be improved by the training treatments, where the training treatments in the SMA are known as a useful method to improve the shape memory effect (SME) in FeMn alloys.9,10)Since the rolling deformation was adopted as the thermo-mechanical training,7) the deformation mode was different from that in vibration of internal friction measurement.
It has been well known that twelve ¾-martensite variants can be produced according to twelve {111}©112ª shear systems in martensitic transformation of £-austenite to ¾ -martensite.11,12) However, the relative population of the martensite variants is strongly depended on the direction and sense of the external stress.13,14)If the bending mode is adopted for the thermo-mechanical training, it is expected that the favorable ¾-martensite variants for the damping capacity can be introduced since sound and noise are created
by bend mode vibrations in elastic amplitude. It is reported that an Fe17 mass%Mn alloy exhibits the highest damping capacity in FeMn binary system.6)In this study, the effects of the thermo-mechanical training featured by bending mode on microstructure, hardness and damping capacity in an Fe 17 mass%Mn alloy have been studied.
2. Experimental Procedure
The chemical composition of the FeMn alloy used in this study is listed in Table 1. This alloy was prepared by melting in a vacuum furnace. The rod shaped cast ingot of 30 kg with 150 mm diameter was homogenized at 1200°C for 24 h, and then hot forging was carried out at temperature range between 1200 and 900°C. After the hot forging, the bar shaped sample with 100 mm©20 mm©800 mm was air cooled. The starting temperatures of martensitic transforma-tion (Ms) of FeMn binary alloys are shown in Fig. 2.12,15)In
Mg-0.6%Zr Mg
Cu-Al-Ni
Mn-Cu-Al Fe-Cr-Al
Al-Zn Fe-CoTiNi
12Cr-Steel Ni
Fe Grey Cast Iron (high C)
Grey Cast
Iron AZ81A
SUS304
S95C
Al Cast Alloy
Bronze
Brass
Tensile Strength,
σ
/ MPa
10
210
310
-110
-210
-3Internal friction,
Q
-1
Fig. 1 Internal friction vs. tensile strength map.5)
+Corresponding author, E-mail: yoshimi@nitech.ac.jp
[image:1.595.320.534.300.535.2]this figure, dotted line is the chemical composition used in this study. As can be seen,Mstemperature for¾-martensitic transformation of used Fe17 mass%Mn alloy is about 150°C.
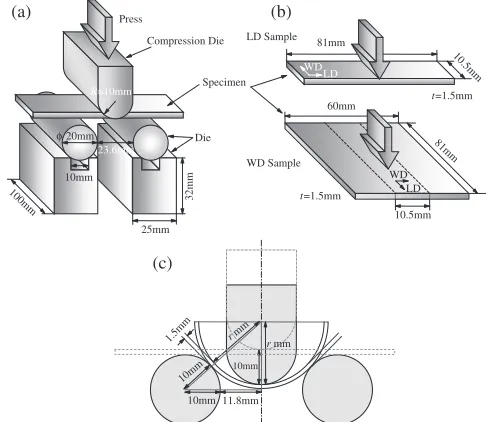
In this study, the effects of thermo-mechanical training on damping capacity are investigated. Figure 3 shows the thermo-mechanical training program. First step of the training is heat treatment. The sample was austenitized at 700°C for 2 h followed by water quenching. Second step is bending at room temperature (R. T.). The bending mode training was adopted, since vibration manner in internal friction measurement is bending, as described later. A couple of deformation tests, bending and flatting deformation, is carried out for one cycle of training, where dies for bending are shown in Fig. 4(a) and die for flatting is metallic block withflat surface. To study the anisotropic damping capacity, two kinds of initial samples are used for thermo-mechanical training. One is LD sample with dimensions of 1.5 mm© 10.5 mm©81.0 mm, and its longitudinal direction is per-pendicular with respect to the compression die. On the other hand, WD sample has larger size (1.5 mm©81.0 mm© 60.0 mm), and its longitudinal direction is parallel with
respect to the compression die, as shown in Fig. 4(b). The deformation tests were carried out on an Instron type testing machine at a cross-head speed of 1 mm/min for bending 0 5 10 15 20 25 30
mass% Mn 800
700 600 500
400 300 200
100 0
γ
α
ε
T
emperature, T
/
°
C
Fig. 2 Ms temperature of martensitic transformation of FeMn binary
alloys depending on Mn concentration.15,12)
flatting bending R.T.
700°C
Deformation
2h 2h
Deformation
flatting bending
1 cycle
6 cycles
Fig. 3 Thermo-mechanical training program used in this study.
25mm
10.5mm t=1.5mm
100mm LD
10m m
11.8mm
10mm
r mm
1.5mm
10mm (c)
32mm
r mm
Fig. 4 (a) Dies for bending used in the thermo-mechanical training. (b) Bending directions of thermo-mechanical training in LD and WD samples. Vibration directions in internal friction measurement of LD and WD samples are parallel and perpendicular to the bending direction in the thermo-mechanical training, respectively.
Tungsten wire
(8mm x 4mm x 0.2mm)
1mm
Iron foil
Driving coil
Detector coil
Noise filter
A/D converter Oscillator
Amplifier
Computer 22.4%
22.4%
80mm 10mm
100%
Fig. 5 The setup for internal friction measurement.8)
10μm
[image:2.595.304.547.72.283.2] [image:2.595.58.282.81.303.2] [image:2.595.64.277.358.479.2] [image:2.595.325.529.363.523.2] [image:2.595.321.534.558.720.2]deformation and 2 mm/min for flatting deformation. Since the maximum stroke of the bending deformation isfixed to be 10 mm, radius of curvature of neutral axis is calculated to be 18 mm, as shown in Fig. 4(c). Then the surface strain of 0.04 can be introduced by this deformation. Bending direction is not changed by training cycle. The training cycling was repeated 2, 4 or 6 times for each sample. After the training, the sample with dimensions of 1.5 mm©10.5 mm© 81.0 mm was cut from WD sample, as shown in Fig. 4(b). As a consequence, vibration direction in internal friction measurement of LD and WD samples is parallel and perpendicular with bending direction in the thermo-mechan-ical training, respectively.
In order to measure damping capacity, internal friction, Q¹1 was measured at R. T. in air atmosphere using a free-decay method of flexural resonant vibration with both free ends, as shown in Fig. 5.8) Since the £-austenite and ¾ -martensite phases in Fe17 mass%Mn alloy show para-magnetism, a small piece of ferromagnetic Fe foils (8 mm© 4 mm©0.2 mm) were attached to both ends of the specimen in order to excite mechanical vibrations efficiently by an electromagnetic force and to sensitively monitor the vibration by an induced current. After a steady-state vibration, the driving signal was turned off and the free-decay curve was recorded by a computer through a high-speed analogue digital converter.8)
IPF
ε
2110 0001
1010
15μm
2110 0001
1010 [001]
(a) (b)
(c)
WD
LD
LD
WD
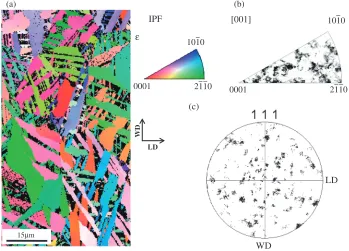
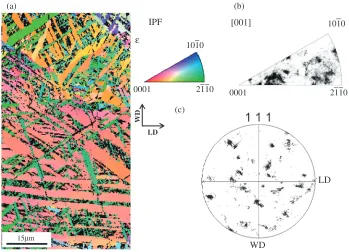
Fig. 8 An inverse polefigure map of¾-martensite (a), an inverse polefigure of¾-martensite (b) and a (111) polefigure of£-austenite (c) in the sample without training treatment. In inverse polefigure in (b), [001] presents the direction perpendicular to the LD and the WD directions.
α
ε
γ
2110 0001
1010 101 111
001
101 111
001
15μm 15μm
Phase α ε γ
0.008 0.824 0.168 Fraction
(a) (b)
[image:3.595.112.484.71.288.2] [image:3.595.124.473.327.578.2]The microstructure was observed using optical microscope and electron backscattered diffraction (EBSD) after mechan-ically and electrmechan-ically polishing. The electro-polishing was carried out using Struers A2 electrolyte at 13°C and 32 V for 9 s in a Struers Electropol device. EBSD measurement was performed with step size of 0.3 µm. For the EBSD measure-ments, crystal orientation of ¾-martensite was analyzed with lattice ratio of c/a=1.613.16) The hardness was measured using a Vickers hardness tester.
3. Results and Discussion
Figure 6 shows a typical microstructure obtained with optical microscopy of the sample without the training treatment. It is apparent that the sample without training contains ¾-martensite phase, since Ms temperature for ¾ -martensitic transformation of used Fe17 mass%Mn alloy is about 150°C, as shown in Fig. 2. It is also found that the ¾-martensite phase has some variants. This is because twelve ¾-martensite variants can be produced according to twelve
{111}£©112ª£ shear systems in £ to ¾ martensitic
trans-formation. Average grain size of prior £-austenite in the specimen without training treatment is 20 µm.
EBSD results of the sample without training treatment are shown in Figs. 7 and 8. Figures 7(a) and 7(b) are an inverse pole figure map and a phase map, respectively. From the phase map, it is seen that this microstructure consists of ¾ -martensite and£-austenite, and¡-martensite phase could not be observed. Volume fractions of¾-martensite and£-austenite phases are 82 and 17 vol%, respectively.
Since the damping sources of the FeMn system are related to ¾-martensite phase,6) a detailed analysis on ¾ -martensite phase is performed. Figures 8(a), 8(b) and 8(c) show an inverse pole figure map, an inverse pole figure of only ¾-martensite phase and (111) pole figure of£-austenite in the sample without training treatment, respectively. In the inverse polefigure in Fig. 8(b), [001] presents the direction perpendicular to the LD and the WD directions. As can be seen from Figs. 8(a) and 8(b), crystal orientation distribution of ¾-martensite in whole region of this sample is random although transformation texture of ¾-martensite is observed in a prior£-austenite grain. This is because that there is no 10 μm
LD
WD
10 μm
LD
WD
(b)
10 μm
LD
WD
(c)
10 μm
LD
WD
10 μm
LD
WD
(e)
10 μm
LD
WD
(f)
[image:4.595.112.488.64.496.2]texture in crystal orientation of prior£-austenite grains in this specimen as shown in Fig. 8(c). This is in agreement with the results obtained with optical microscopy. An average size of¾-martensite measured from Fig. 8(a) is 14.4 µm in length and 2.7 µm in width.
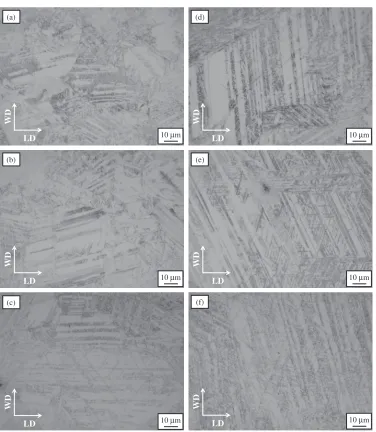
Optical micrographs showing the change in ¾-martensite structure by the thermo-mechanical training are shown in Fig. 9. LD and WD directions in thisfigure are longitudinal and width directions in internal friction measurement, respectively, as defined in Fig. 4(b). In Fig. 9, (a) to (c) are LD samples and (d) to (f ) are WD samples, respectively. Number of cycling is 2 times for (a) and (d), 4 times for (b) and (e), and 6 times for (c) and (f ). Average grain sizes of
prior£-austenite in these treated specimens at 2 times, 4 times and 6 times are 40, 39 and 39 µm, respectively. In case of the LD samples, lots of ¾-martensite are oriented with its longitudinal direction parallel with LD direction. On the other hand, ¾-martensite in the WD samples is oriented with its longitudinal direction perpendicular with LD direction. In this way, the¾-martensite phases have a preferred orientation in the samples with thermo-mechanical training.
Figures 10(a) and 10(b) are an inverse polefigure map and a phase map measured by EBSD, respectively, for the sample subjected to 2 times of thermo-mechanical training. The microstructure consists of¾-martensite,£-austenite and small amount of ¡-martensite. Volume fractions of each phase are
α
ε
γ
2110 0001
1010 101 111
001
101 111
001
WD
LD
15μm
WD
LD
15μm
Phase
α ε γ
0.009 0.846 0.145 Fraction
[image:5.595.124.473.329.581.2](a) (b)
Fig. 10 An inverse polefigure map (a) and a phase map measured (b) by EBSD for sample with thermo-mechanical training. Number of cycling is 2 times.
IPF
ε
2110 0001
1010
15μm
2110 0001
1010 [001]
WD
LD
(a) (b)
(c)
LD
WD
84.6, 14.5 and 0.9 vol%, respectively. Larger amount ¾ -martensite phase is detected as compared with the sample without training. Crystal orientation textures and smaller grain sizes of the ¾-martensite phase are also observed.
Figures 11(a), 11(b) and 11(c) show an inverse polefigure map, an inverse pole figure of only ¾-martensite and a (111) pole figure of£-austenite in the sample with thermo-mechanical treatment, respectively. In Fig. 11(b), [001] is the direction perpendicular to the LD and the WD directions. As well as specimen without thermo-mechanical treatment, prior£-austenite grains have no texture. On the other hand, it is important to note that strong texture is observed for ¾-martensite, as shown in Fig. 11(b). Moreover, an average size of ¾-martensite in this sample is 7.9 µm in length and 0.9 µm in width. The size of ¾-martensite in this specimen with thermo-mechanical treatment is smaller than that of the sample without treatment. Therefore, enhanced and anisotropic damping capacity will be expected for the thermo-mechanical trained samples.
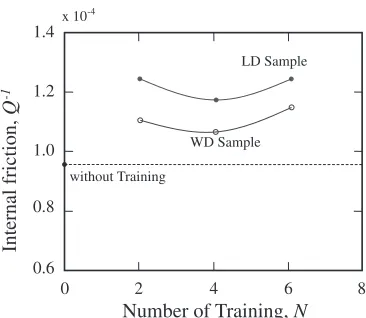
Internal friction,Q¹1, in the trained samples as a function of training cycle is shown in Fig. 12. The data of the sample without training is also shown in thisfigure. It is seen from this figure that enhanced damping capacity is found for the samples with the thermo-mechanical training. It is important to note that an anisotropic damping capacity is observed for the thermo-mechanical trained samples. Namely, a strong training effect was found for LD samples, while a small effect for WD samples. As the deformation of thermo-mechanical training, the same deformation mode for vibration must be chosen if one would like to obtain a better damping capacity of FeMn damping alloy. The increase in internal friction is due to an increase in the number of the favorable damping sources per unit volume, i.e., oriented ¾-martensite variant boundaries, oriented stacking faults and oriented £/¾ interfaces. Therefore, the thermo-mechanical training by bending deformation, in which bending direction parallel with vibration direction in internal friction measurement, increases the relative population of favorable ¾-martensite variant boundaries, favorable stacking faults and favorable £/¾ interfaces for damping capacity.
Figure 13 shows the hardness of the samples with and without training treatment. It may have been noticed that
thermo-mechanical treatment increases the hardness of Fe Mn alloy, and the hardness increases with increasing the number of training cycle. However, there was no significant difference in hardness between LD sample and WD sample. This is because basically the same thermo-mechanical treatment was performed for LD and WD samples.
An anisotropic damping capacity is found for the thermo-mechanical training by bending mode. Usually vibration direction of noise souses is predetermined; our technique provides the better damping material for industrial fields. Since it is reported that the 100%¡-martensitic alloys such as Fe5 mass%Mn and Fe10 mass%Mn alloys showed very low damping capacities,12)existence of¡-martensite must be avoided. The ¡-martensite in high manganese FeMn alloy is induced by relatively large strain. Therefore, during the thermo-mechanical training, the surface strain by the bending deformation must be less than 0.04.
In this study, it is found that the thermo-mechanical treatment increases the hardness of FeMn alloy, as well as damping capacity. Therefore, the trade-off between the damping capacity and hardness can be overcome by the training. It can be concluded that the training treatments are very useful for enhancement of the damping property and hardness of FeMn alloy.
4. Conclusion
In this study, the training effects on microstructure, hardness and internal friction in an Fe17 mass%Mn alloy have been investigated. The thermo-mechanical training featured by bending mode is carried out, since vibration manner in internal friction measurement is also bending mode. The results of the study are summarized as follows.
(1) The¾-martensite phases have a preferred orientation in the specimens with thermo-mechanical training with bending deformation.
(2) An anisotropic damping capacity is observed for the samples subjected to bending mode thermo-mechanical training.
(3) It is found that the trade-off between the damping capacity and hardness can be overcome by the thermo-mechanical training.
(4) The training treatments are useful for enhancement of the damping properties and hardness of FeMn alloy. 0.8
0 2 4 6
Number of Training, N
8 0.6
[image:6.595.78.261.68.227.2]Internal friction,
Fig. 12 Internal friction, Q¹1, in the trained samples as a function of
training cycle. The data of the sample without training is also shown in thisfigure.
200
0 2 4 6
Number of Training, N
8 150
Micro V
[image:6.595.335.519.72.221.2]Acknowledgments
The authors are grateful to Mr. Satoshi Tamaoka for his helpful works in carrying out the experiments. The authors also would like to thank Mr. Kozo Ozaki of the Daido Steel Co. Ltd., for providing the FeMn alloy. The authors sincerely acknowledge the financial support of this study by Ministry of Education, Culture, Sports, Science and Technology, Regional Innovation Cluster Program.
REFERENCES
1) J. Van Humbeeck:J. Alloy. Compd.355(2003) 5864.
2) N. Igata, N. Urahashi, M. Sasaki and Y. Kogo:J. Alloy. Compd.355
(2003) 8589.
3) Y. Sutou, T. Omori, N. Koeda, R. Kainuma and K. Ishida:Mater. Sci. Eng. A438440(2006) 743746.
4) R. Mulyukov, S. Mikhailov, R. Zaripova and D. Salimonenko:Mater.
Res. Bull.31(1996) 639645.
5) H. Mizubayashi, S. Murayama and H. Tanimoto: J. Alloy. Compd.
330332(2002) 389392.
6) S.-H. Baik, J.-C. Kim, D.-W. Han, T.-H. Kim, J.-H. Back and Y.-K. Lee:Mater. Sci. Eng. A438440(2006) 11011105.
7) Y. Watanabe, H. Sato, Y. Nishino and I.-S. Kim:Mater. Sci. Eng. A490
(2008) 138145.
8) Y. Watanabe, H. Sato, Y. Nishino and I.-S. Kim:Mater. Sci. Eng. A
521522(2009) 376379.
9) K. Tsuzaki, M. Ikegami, Y. Tomota and T. Maki:ISIJ Int.30(1990) 666673.
10) Y. Watanabe, Y. Mori and A. Sato:J. Mater. Sci.28(1993) 15091514. 11) Z. Nishiyama, M. E. Fine, M. Meshii and C. M. Wayman:Martensitic
Transformation, (Academic Press, New York, 1978) p. 48. 12) Y.-K. Lee, J.-H. Jun and C.-S. Choi:ISIJ Int.37(1997) 10231030. 13) Y. Higo, F. Lecroisey and T. Mori:Acta Metal.22(1974) 313323. 14) M. Kato and T. Mori:Acta Metal.25(1977) 951956.
15) H. Schumann: Z. Metallkd.58(1967) 207210.