Liquid-Solid Equilibrium and Intermediate Phase Formation
during Solidification in Mg-1.3 at%Zn-1.7 at%Y Alloy
Toshiaki Horiuchi
1, Akemi Ono
1;*1, Kentaro Yoshioka
1;*1, Takero Watanabe
2;*2,
Kenji Ohkubo
3, Seiji Miura
3, Tetsuo Mohri
3and Shigeyuki Tamura
41Department of Mechanical Systems Engineering, Hokkaido Institute of Technology, Sapporo 006-8585, Japan 2Faculty of Engineering, Hokkaido University, Sapporo 060-8628, Japan
3Division of Materials Science and Engineering, Graduate School of Engineering, Hokkaido University, Sapporo 060-8628, Japan
4Science & Engineering Systems Division, Itochu Techno-Solutions Corporation, Tokyo 100-6080, Japan
Mg-Y-Zn alloys have attracted much attention in recent years due to their excellent mechanical properties, which are said to be the effect of the intermediate phase (Xphase) in the Mg solid solution (phase). The formation behavior of theXphase has been reported to be a eutectic type reaction in the Mg-Y-Zn pseudo-binary system. However, the phase diagram of this system still requires clarification. In the present study, the 97.0Mg-1.3Zn-1.7Y (at%) alloy was prepared to clarify the liquidus and solidus in the liquid-solid coexistence region, and the solubility limit in thephase. The chemical compositions of the alloy were analyzed by electron probe X-ray microanalysis after isothermal heat treatment. The results indicate that the Mg-Y-Zn ternary system can be represented as a pseudo-binary system between theandXphases. In addition, the solidus line for thephase has been clarified. The solubility limit for thephase is not much different from that of the previous report, whereas the formation behavior of theXphase is not in the manner of a eutectic reaction, but rather that of a peritectic one.
[doi:10.2320/matertrans.MAW200822]
(Received May 8, 2008; Accepted July 17, 2008; Published September 3, 2008)
Keywords: magnesium alloy, magnesium-yttrium-zinc system, phase diagram, pseudo-binary, liquidus, solidus
1. Introduction
Mg alloys, as the lightest practical metallic material, have
applied in various fields to reduce the weight of products.1)In
the last few years, Mg-Y-Zn alloys have attracted particular attention, because of their excellent strength, ductility, corrosion resistance and heat resistance compared with
conventional Mg alloys.2–4) Although the strengthening
mechanism of Mg-Y-Zn alloys is less well understood, it is considered to be mainly due to solution hardening of Y in the
Mg solid solution (phase) and precipitation hardening by
the intermediate phase (X phase).5) It is certain that the X
phase has distinctive long-period stacking ordered (LPSO) structures, which vary with the alloy composition or heat
treatment,6)and it is considered to have a significant effect on
the mechanical properties of this alloy. As a matter of course, the establishment of a phase diagram is important for efficient alloy development and optimization of manufacturing proc-esses. However, only few attempts have so far been made at
establishing the Mg-Y-Zn ternary phase diagram,7–9)and the
phase diagram of this system still requires clarification.
Padezhnova et al.experimentally investigated the
Mg-Y-Zn ternary system and reported that the composition of theX
phase was 85.9Mg-6.1Zn-7.9Y (at%), and that the Mg-Y-Zn ternary phase diagram could be represented as a
pseudo-binary system on the line between the phase and the X
phase, as shown in Fig. 1.8)The elemental ratio of Zn per Y
for this line is 0.772. Shown in Fig. 2 is the reported
Mg-Y-Zn pseudo-binary phase diagram by Padezhnova et al.The
reported composition of the X phase is also plotted in this
figure. They pointed out that the formation behavior of theX
phase in this system was in the manner of a eutectic reaction. On the other hand, a discrepancy exists between the
com-position of the eutectic point and theXphase, as clearly seen
in Fig. 2, which implies that the formation behavior of the
X phase should be in the manner of a peritectic reaction. In
addition, the solidus line for thephase in the liquid-solid
coexistence region is still unclear in this diagram. Therefore, further investigation is necessary to clarify the formation
behavior of theXphase for control of the microstructure and
for further optimization of manufacturing processes.
Mg
Mg (at.%)
Zn Y
Y (at.%)
Zn (at.%)
10 40 30 20
50 60
70 80
90
90 60
70
80 50 40 30 20 10
X phase Master ingot
X phase (Mg85.9 Zn6.1Y7.9)
10 20 30 40 50 60 70 80 90
Fig. 1 Schematic of the Mg-Y-Zn ternary system. The open and solid symbols indicate the chemical compositions of theXphase reported by Padezhnovaet al.,8)and that of the master ingot in the present study,
respectively. The broken and solid lines indicate the ratios of Zn per Y for theXphase and the master ingot, respectively.
*1Undergraduate Student, Hokkaido Institute of Technology *2Undergraduate Student, Hokkaido University
[image:1.595.315.539.382.584.2]In the present study, the 97.0Mg-1.3Zn-1.7Y (at%) alloy is prepared in order to assure the validity that the Mg-Y-Zn ternary system can be represented as a pseudo-binary system
between theandXphases, and to clarify the liquidus line
and the solidus line for the phase in the liquid-solid
coexistence region. The solubility limit for the phase and
the chemical composition of theXphase in the solid solution
are also investigated. Particular focus is placed on the
formation behavior of theXphase.
2. Experimental Procedures
A master ingot of the 97.0Mg-1.3Zn-1.7Y (at%) alloy was prepared from high-purity raw materials; 99.95% Mg bar, 99.5% Zn sheet and small pieces of 99.99% Y. These metals were melted in a 31 mm diameter graphite crucible using a high-frequency induction furnace under high-purity
argon atmosphere, and the as-cast ingot size was 20 thick
50 wide52 high (mm). The composition of the ingot was
analyzed using an energy dispersive X-ray fluorescence spectrometer (EDXRF; Jeol JSX-3220Z). Samples for examination of the liquid-solid coexistence region were
cut into 20 thick4 square (mm) pieces and were
encap-sulated in lidded 6 mm diameter graphite crucibles, in consideration of the dangers of molten Mg alloy during water-quenching. And again, samples for the examination of the liquid-solid coexistence region were encapsulated in quartz tubes with high-purity argon gas for isothermal heat treatment. Samples for the solid solution were cut
into the size of 20 thick11 wide13 high (mm) pieces
and were encapsulated in quartz tubes with high-purity argon gas.
As is shown in Fig. 2, the eutectic temperature is reported
as 813 K.8)Thus, in the present study, 873 and 833 K were
employed as testing temperatures for the liquid-solid coex-istence region, and 793 K was employed as that for the solid solution. Holding times for isothermal heat treatment to reach thermal equilibria were estimated using Arrhenius and
Einstein equations10)under the condition to attain a diffusion
distance of more than 100mm. These two equations are given
as follows,
D¼D0exp
Q kT
ð1Þ
x¼pffiffiffiffiffiffiffiffi2Dt ð2Þ
where D, k and T represent the diffusion coefficient, the
Boltzmann constant and temperature, respectively.D0andQ
represent materials constants. xandt are diffusion distance
and time, respectively. Employed materials constants,11,12)
estimated diffusion times for 100mmand determined holding
times for isothermal heat treatment are summarized in Table 1. It should be noted that the materials constants for diffusion of La in Mg were employed as substitutes for those of Y in Mg in the present study, as those were unavailable in the literature. Finally, the holding times for isothermal heat treatment were determined as 1.5 h at 873 K, 2.0 h at 833 K and 72 h at 793 K.
Isothermal heat treatment was carried out using a vertical electrical furnace. Samples for the liquid-solid coexistence region were heated up to approximately 973 K and held for 30 min to become completely molten, and were cooled down to the prescribed temperatures (873 K or 833 K) with a cooling rate of 1 K/min, and held for the times described above. Samples for the solid solution were heated up to 793 K and held for 72 h. After isothermal heat treatment, the samples encapsulated in quartz tubes were dropped into water, and the quartz tubes were immediately broken by quenching. The microstructure of each sample was observed using an electron probe microanalyzer (EPMA; Jeol JXA-8200), and the chemical compositions for phases of the samples were analyzed using wave length dispersive X-ray spectroscopy (WDS). Since high accurate estimation of the chemical compositions for the liquid phases is extremely difficult, the following two methods were adopted for determination of the liquidus line; (1) derivation from the chemical composition of the master ingot analyzed by EDXRF, the area fractions of the liquid and solid phases were quantitatively analyzed using EPMA images, and the chemical compositions of the solid phases were analyzed by WDS, (2) derivation from the average values of the chemical compositions of the liquid phases directly analyzed by WDS.
X
Mg85.9 Zn6.1 Y7.9
Liquid+ 80 85 90 95 100 Temperature (K) Liquid 650 700 750 800 850 900 950
Padezhnova et al. Zaselyan et al.
Mg (at.%)
75 Zn / Y = 0.772
+X
α α
α
Fig. 2 Experimental Mg-Y-Zn pseudo-binary phase diagram. The dia-monds and squares indicate the values reported by Padezhnovaet al.8)and
[image:2.595.51.290.74.210.2]Zaselyanet al.,7)respectively. The broken line is an interpolation.
Table 1 Employed materials constants,11;12Þestimated diffusion times for 100mmderived by Arrhenius and Einstein equations,10Þand
determined holding times for isothermal heat treatment at 873, 833, and 793 K.
Temperature, D0/cm2s1 Q/kJmol1 Estimated diffusion Holding time,
T/K time,t/h tH/h
Zn in Mg La in Mg Zn in Mg La in Mg Zn in Mg La in Mg
873 0.49 0.82 1.5
833 0.41 0.022 120 102 1.1 1.6 2.0
[image:2.595.48.549.705.787.2]3. Results and Discussion
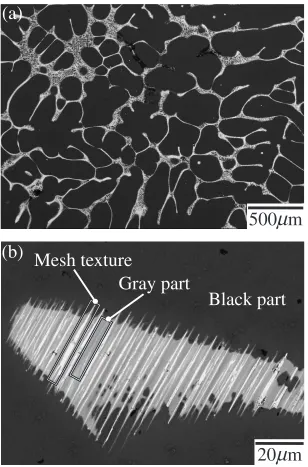
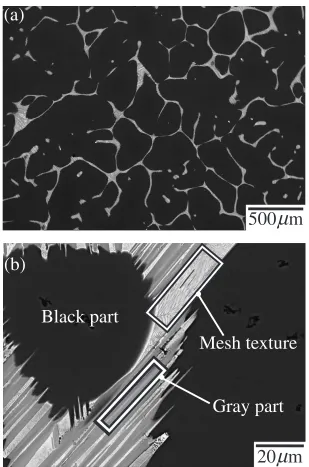
The analyzed chemical composition of the master ingot is 97.1Mg-1.3Zn-1.6Y (at%), which is also plotted in Fig. 1. The actual measurement value of the elemental ratio of Zn per Y is 0.78 in the present study. Backscattered electron images (BEI) observed by EPMA for the samples after isothermal heat treatment at 873 and 833 K are shown in Figs. 3 and 4, respectively. These microstructures are composed of black parts, gray parts and a mesh texture. Small pits occasionally confirmed in the black parts are considered to be formed by solidification contraction during water-quenching. The chemical compositions for these three parts in Figs. 3 and 4 analyzed using WDS are tabulated in Tables 2 and 3, respectively, with a standard deviation of Mg for each part. The intervals of the mesh texture are approximately 200 nm, which is quite fine compared with the
probe diameter of the EPMA, and thus it is extremely difficult to precisely analyze the chemical composition for the mesh texture. It was confirmed that the standard deviations of Mg for a gray part and the mesh texture are much greater than that for a black part, and the gray part and mesh texture have indeterminate shapes in both samples. In addition, the area fraction of the black part in Fig. 3 is smaller than that in Fig. 4. From the analyzed chemical compositions and these observations of the microstructures, it could be concluded
that the black parts are solid () phases, and the gray parts
and the mesh textures are liquid phases in both samples during isothermal heat treatment. The mesh textures are considered to be formed during rapid solidification without sufficient diffusion time.
The chemical compositions for thephases are almost the
same; therefore, the chemical compositions for the liquid
phases are estimated from those of the master ingot and the
500 m
µ
(a)
Black part
Gray part
Mesh texture
(b)
20 m
µ
[image:3.595.145.453.71.538.2]phase and the area fractions of the liquid andphases. Areas
of approximately 8.5 mm2 were analyzed to derive the area
fractions for both samples. The analyzed area fractions of
phases with standard deviations and the derived chemical compositions of Mg for the liquid phases are summarized for both samples in Table 4. The Mg contents in the liquid phases at 873 and 833 K are estimated to be 89.9% and
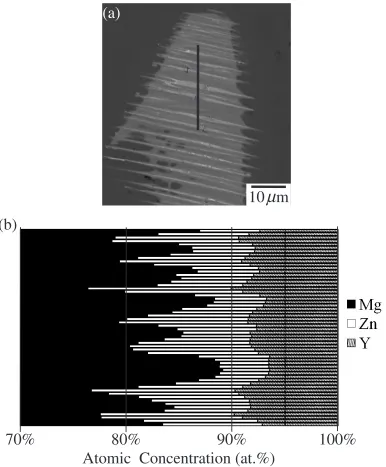
77.6%, respectively. Meanwhile, the chemical compositions for the liquid phases were also estimated by averaging a large number of chemical compositions for the liquid phases directly analyzed by WDS. Figure 5 shows a BEI observed by EPMA around the analyzed position and the results of the linear chemical composition analysis of the sample after isothermal heat treatment at 873 K. It was confirmed that the
500 m
µ
(a)
Mesh texture
Gray part
Black part
(b)
20 m
µ
[image:4.595.143.452.70.537.2]Fig. 4 BEIs observed by EPMA for the sample after isothermal heat treatment at 833 K. (b) Magnified image of (a).
Table 2 Analyzed chemical compositions for the three parts indicated in Fig. 3, with standard deviations of Mg after isothermal heat treatment at 873 K.
Atomic concentration (at.%) Standard deviation Mg Zn Y of Mg (at.%) Black part 98.4 0.7 0.9 0.1
[image:4.595.45.290.610.680.2]Gray part 87.2 6.3 6.5 2.9 Mesh texture 81.2 11.0 7.8 5.0
Table 3 Analyzed chemical compositions for the three parts indicated in Fig. 4, with standard deviations of Mg after isothermal heat treatment at 833 K.
Atomic concentration (at.%) Standard deviation Mg Zn Y of Mg (at.%) Black part 98.9 0.4 0.7 0.1
[image:4.595.307.551.611.681.2]chemical composition for the liquid phase has wide fluctua-tion. The resultant average chemical compositions of Mg for the liquid phases with standard deviations are summarized for both samples in Table 5. The Mg contents in the liquid phases at 873 and 833 K are estimated to be 91.1% and 86.4%, respectively. It should be pointed out that the Mg
contents in the liquid phases derived using the two methods are substantially different, especially at 833 K. This point will be further discussed later in the report.
[image:5.595.108.494.70.537.2]Figure 6 shows a BEI for the sample after isothermal heat treatment at 793 K. It was confirmed that the microstructure is simply composed of black and gray parts, and the area
Table 4 Analyzed area fractions of thephases with standard deviations and the derived chemical compositions of Mg for the liquid phases after isothermal heat treatment at 873 and 833 K.
Temperature,
T/K
Area fraction ofphase
(%)
Standard deviation of area fraction
(%)
Chemical composition of Mg for liquid phase
(at.%) 873 78.9 0.97 89.9 833 92.7 0.59 77.6
10 m
µ
(a)
(b)
Atomic Concentration (at.%)
70%
80%
90%
100%
[image:5.595.306.549.627.689.2]Fig. 5 BEI with the analyzed position represented by the black line (a) and results of the linear chemical composition analysis (b) for the sample after isothermal heat treatment at 873 K.
Table 5 Resultant average chemical compositions of Mg for the liquid phases, with standard deviations of Mg after isothermal heat treatment at 873 and 833 K.
Temperature,
T/K
Chemical composition of Mg for liquid phase
(at.%)
Standard deviation of Mg (at.%)
873 91.1 0.7
[image:5.595.46.291.629.689.2]fraction of black parts is larger than that of gray parts. Chemical compositions for these parts were analyzed by WDS, and are tabulated in Table 6 with a standard deviation of Mg for each part. The standard deviations of Mg for both parts are quite small, indicating that the sample is in a thermodynamic equilibrium. Therefore, it may be concluded
that the black part is the phase, and the gray part is the
X phase.
The resultant liquidus and solidus lines determined by the present study are shown in Fig. 7, including representation of the previously reported Mg-Y-Zn pseudo-binary phase
diagram with the reported values.7,8)The solidus line for the
phase has been clarified first by the present study. The
solubility limit for thephase shows good agreement with
the previous report.7)As for the liquidus line, the estimation
by averaging the chemical compositions for liquid phases directly analyzed by WDS shows good agreement with
the previous report,8) while that derived by the chemical
compositions of the master ingot and the phase, and the
area fractions of the liquid andphases is slightly different
from the previous report,8)especially at 833 K. The chemical
composition of the X phase in the solid solution is also
represented in Fig. 7, showing a higher Mg content compared
with that of the previous report.8) This indicates that the
chemical compositions of the, liquid andXphases obtained
in the present study are generally represented in the pseudo-binary phase diagram, and that the results of the present study
are in good agreement with those by Padezhnova et al.8)
However, it should be noted that in any case, all the results of the present study support that the formation behavior of
the X phase is not in the manner of a eutectic reaction, but
rather that of a peritectic one.
As shown in Fig. 5, although only the average chemical compositions within the EPMA probe diameter were ana-lyzed, on account of the extremely fine intervals of the mesh texture, some analyzed chemical compositions for the liquid
phase indicated even a lower Mg content than that in theX
phase (85.9%) reported by Padezhnova et al.,8) implying
that the formation behavior of theX phase should be in the
manner of a peritectic reaction. Therefore, the mesh texture
5 m
µ
Black part
Gray part
[image:6.595.123.476.73.325.2]Fig. 6 BEI observed by EPMA for the sample after isothermal heat treatment at 793 K.
Table 6 Analyzed chemical compositions for the two parts indicated in Fig. 6, with standard deviations of Mg after isothermal heat treatment at 793 K.
Atomic concentration (at.%) Standard deviation Mg Zn Y of Mg (at.%) Black part 98.5 0.7 0.8 0.1
Gray part 89.7 4.7 5.6 0.6
Liquid+
80 85
90 95
100
Temperature (K)
Liquid
Padezhnova et al. Zaselyan et al.
Mg (at.%)
75 Present study
X
Mg85.9 Zn6.1 Y7.9
α
+X
α α
650 700 750 800 850 900 950
Fig. 7 The Mg-Y-Zn pseudo-binary phase diagram with the reported values.7,8)The open and solid triangles indicate the chemical compositions
[image:6.595.310.548.371.507.2] [image:6.595.47.290.406.462.2]is considered to be formed through multiple solidification processes in the manner of peritectic solidification, and this is one of the reasons for the wide fluctuation of chemical compositions in the liquid phases represented in Fig. 5. The white part in the mesh texture, which has relatively higher atomic weight than the other parts, could represent a much lower Mg content than the analyzed values indicated in
Fig. 5. This could be regarded as aWphase (Mg3Zn3Y2) by
comparison with the previously reported Mg-Y-Zn ternary
phase diagram.9)It is also noted that the white part could be a
nonequilibrium phase in the present alloy composition, because it disappears after isothermal heat treatment at 793 K, as is shown in Fig. 6 and Table 6. However, further investigations are indispensable to clarify the solidification processes over a wide range of alloy compositions in this system. Therefore, this point still remains as a subject for clarification in the future.
The reasons for the different Mg contents in the liquid phases derived by the two methods in the present study may
be as follows. The interface of the primary solidifiedphase
reacts with the liquid phase at the peritectic temperature if the
formation behavior of the X phase is in the manner of a
peritectic reaction. Consequently, the solid-liquid interface in the quenched samples for the liquid-solid coexistence region becomes vague, and the analyzed area fractions of the liquid
andphases have a large margin of error. In addition, the
error in the chemical composition of thephase significantly
affects the derived chemical composition of the liquid phase,
because the area fractions of thephases are much greater
than those of the liquid phases, as shown in Figs. 3 and 4 and Table 4. Accordingly, the resultant chemical compositions estimated for the liquid phases by those of the master ingot
and the phase and the area fractions of the liquid and
phases also include a large margin of error.
The chemical composition of theXphase at 793 K in the
present study shows a higher Mg content compared with the
previous report8)and other reports,9,13)in which the chemical
composition of theXphase is described as Mg12Zn1Y1. The
determined holding time for the isothermal heat treatment at 793 K is sufficient for diffusion, as shown in Table 1. In addition, the resultant chemical compositions analyzed by
WDS indicate nearly constant values for both the andX
phases, as shown in Table 6, and this indicates that the sample at 793 K is in a thermodynamic equilibrium. Itoi
et al.6)investigated the microstructure in the 97Mg-1Zn-2Y (at%) alloy using transmission electron microscopy and suggested that an 18R-type LPSO structure with the composition of 91Mg-3Zn-6Y (at%), which was considered
to be the same structure as the X phase reported by Luo
et al.13) (Mg
12Zn1Y1), was the phase in this alloy at high
temperature. This result is in good agreement with that of the present study. Thus, it can be concluded that the equilibrium
composition of the X phase should be 89.7Mg-4.6Zn-5.6Y
(at%) at 793 K. In order to clarify the phase boundaries of the
Xphase, it is necessary to obtain the equilibrium composition
at another temperature. Isothermal heat treatment at 673 K using the master ingot in the present study is now under way. In terms of practical application, determination of the
liquidus projection and the phase boundaries of theX phase
in a wide range of alloy compositions becomes important, and establishment of isothermal sections in this system, especially in the vicinity of the Mg-rich part, is also necessary for further optimization of manufacturing proc-esses. These points are issues for future research. Never-theless, we claim that the results obtained in the present study are quite helpful in designing advanced Mg-Y-Zn alloys
composed of theandXphases.
4. Summary
The 97.0Mg-1.3Zn-1.7Y (at%) alloy was prepared to clarify the liquidus and solidus in the liquid-solid coexistence
region and the solubility limit in thephase of the Mg-Y-Zn
ternary system. The principal results obtained in the present study are summarized as follows.
(1) The Mg-Y-Zn ternary system can be represented as a
pseudo-binary system between theandX phases, as
was previously reported by Padezhnovaet al.8)
(2) The solidus line for thephase has been clarified for
the first time. The liquidus line and the solubility limit
for thephase are in good agreement with the previous
reports, whereas the formation behavior of theXphase
is not in the manner of a eutectic reaction, but rather that of a peritectic reaction.
(3) The equilibrium composition of theXphase at 793 K is
suggested to be 89.7Mg-4.6Zn-5.6Y (at%), which is in
agreement with the result reported by Itoiet al.6)
REFERENCES
1) I. J. Polmear: Mater. Sci. Technol.42(1994) 1–16.
2) Y. Kawamura, K. Hayashi, A. Inoue and T. Masumoto: Mater. Trans.
42(2001) 1172–1176.
3) A. Inoue, Y. Kawamura, M. Matsushita, K. Hayashi and J. Koike: J. Mater. Res.16(2001) 1894–1900.
4) E. Abe, Y. Kawamura, K. Hayashi and A. Inoue: Acta Mater.50(2002) 3845–3857.
5) C. Sanchez, G. Nussbaum, P. Azavant and H. Octor: Mater. Sci. Eng. A
221(1996) 48–57.
6) T. Itoi, T. Seimiya, Y. Kawamura and M. Hirohashi: Scr. Mater.51
(2004) 107–111.
7) B. N. Zaselyan, P. Y. Sal’dau and S. K. Afanas’yev: Russian Metallurgy6(1968) 130–132.
8) E. M. Padezhnova, E. V. Mel’nik, R. A. Miliyevskiy, T. V. Dobatkina and V. V. Kinzhibalo: Russian Metallurgy4(1982) 185–188. 9) G. Shao, V. Varsani and Z. Fan: Calphad30(2006) 286–295. 10) G. E. Murch and A. S. Nowick: Diffusion in Crystalline Solids,
(Academic Press, Florida, 1984) p. 192.
11) L. A. Gilfalco: Atomic Migration in Crystals, (Kyoritsu-Syuppan, Tokyo, 1980) p. 174 (in Japanese).
12) E. A. Brandes and G. B. Brook: Smithells Metals Reference Book Seventh Edition, (Butterworth-Heinemann, Oxford, 1992) chapter 13, p. 21.