Robust Machine Translation Evaluation with Entailment Features
∗Sebastian Pad´o
Stuttgart University [email protected]
Michel Galley, Dan Jurafsky, Chris Manning
Stanford University
{mgalley,jurafsky,manning}@stanford.edu
Abstract
Existing evaluation metrics for machine translation lack crucialrobustness: their correlations with hu-man quality judgments vary considerably across lan-guages and genres. We believe that the main reason is their inability to properly capturemeaning: A good translation candidatemeansthe same thing as the
reference translation, regardless of formulation. We
propose a metric that evaluates MT output based on a rich set of features motivated bytextual entailment, such as lexical-semantic (in-)compatibility and ar-gument structure overlap. We compare this metric against a combination metric of four state-of-the-art scores (BLEU, NIST, TER, and METEOR) in
two different settings. The combination metric
out-performs the individual scores, but is bested by the
entailment-based metric. Combining the entailment and traditional features yields further improvements.
1 Introduction
Constant evaluation is vital to the progress of
ma-chine translation (MT). Since human evaluation is costly and difficult to do reliably, a major focus of research has been onautomatic measures of MT quality, pioneered by BLEU (Papineni et al., 2002) and NIST (Doddington, 2002). BLEU and NIST measure MT quality by using the strong correla-tion between human judgments and the degree of n-gram overlap between a system hypothesis trans-lation and one or more reference transtrans-lations. The resulting scores are cheap and objective.
However, studies such as Callison-Burch et al. (2006) have identified a number of problems with
BLEU and relatedn-gram-based scores: (1) BLEU-like metrics are unreliable at the level of individual
sentences due to data sparsity; (2) BLEU metrics
can be “gamed” by permuting word order; (3) for some corpora and languages, the correlation to
hu-man ratings is very low even at the system level;
(4) scores are biased towards statistical MT; (5) the
quality gap between MT and human translations is not reflected in equally large BLEU differences.
∗This paper is based on work funded by the Defense Ad-vanced Research Projects Agency through IBM. The content
does not necessarily reflect the views of the U.S. Government, and no official endorsement should be inferred.
This is problematic, but not surprising: The met-rics treatany divergence from the reference as a
negative, while (computational) linguistics has long
dealt with linguistic variation that preserves the meaning, usually calledparaphrase, such as:
(1) HYP: However, this was declared terrorism by observers and witnesses.
REF: Nevertheless, commentators as well as
eyewitnesses are terming it terrorism.
A number of metrics have been designed to account for paraphrase, either by making the matching more
intelligent (TER, Snover et al. (2006)), or by using linguistic evidence, mostly lexical similarity (ME-TEOR, Banerjee and Lavie (2005); MaxSim, Chan
and Ng (2008)), or syntactic overlap (Owczarzak et
al. (2008); Liu and Gildea (2005)). Unfortunately, each metrics tend to concentrate on one particu-lar type of linguistic information, none of which always correlates well with human judgments.
Our paper proposes two strategies. We first ex-plore the combination of traditional scores into a
more robust ensemble metric with linear regression.
Our second, more fundamental, strategy replaces the use of loose surrogates of translation quality with a model that attempts to comprehensively as-sessmeaning equivalence between references and MT hypotheses. We operationalize meaning equiv-alence by bidirectional textual entailment (RTE, Dagan et al. (2005)), and thus predict the qual-ity of MT hypotheses with a rich RTE feature set. The entailment-based model goes beyond existing word-level “semantic” metrics such as METEOR by integrating phrasal and compositional aspects of meaning equivalence, such as multiword para-phrases, (in-)correct argument and modification
relations, and (dis-)allowed phrase reorderings. We
demonstrate that the resulting metric beats both
in-dividual and combined traditional MT metrics. The
complementary features of both metric types can be combined into a joint, superior metric.
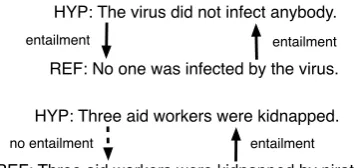
HYP: Three aid workers were kidnapped.
REF: Three aid workers were kidnapped by pirates.
no entailment entailment
HYP: The virus did not infect anybody.
REF: No one was infected by the virus.
[image:2.595.88.266.63.147.2]entailment entailment
Figure 1: Entailment status between an MT system
hypothesis and a reference translation for equiva-lent (top) and non-equivaequiva-lent (bottom) translations.
2 Regression-based MT Quality Prediction
Current MT metrics tend to focus on a single dimen-sion of linguistic information. Since the importance
of these dimensions tends not to be stable across
language pairs, genres, and systems, performance of these metrics varies substantially. A simple
strat-egy to overcome this problem could be to combine the judgments of different metrics. For example, Paul et al. (2007) train binary classifiers on a fea-ture set formed by a number of MT metrics. We follow a similar idea, but use a regularized linear regression to directly predict human ratings.
Feature combination via regression is a super-vised approach that requires labeled data. As we show in Section 5, this data is available, and the resulting model generalizes well from relatively small amounts of training data.
3 Textual Entailment vs. MT Evaluation
Our novel approach to MT evaluation exploits the similarity between MT evaluation and textual en-tailment (TE). TE was introduced by Dagan et al. (2005) as a concept that corresponds more
closely to “common sense” reasoning patterns than
classical, strict logical entailment. Textual entail-ment is defined informally as a relation between two natural language sentences (a premise P and a hypothesis H) that holds if “a human reading P would infer that H is most likely true”. Knowledge
about entailment is beneficial for NLP tasks such as Question Answering (Harabagiu and Hickl, 2006).
The relation between textual entailment and MT
evaluation is shown in Figure 1. Perfect MT output and the reference translation entail each other (top).
Translation problems that impact semantic equiv-alence, e.g., deletion or addition of material, can
break entailment in one or both directions (bottom). On the modelling level, there is common ground
between RTE and MT evaluation: Both have to
distinguish between valid and invalid variation to determine whether two texts convey the same in-formation or not. For example, to recognize the bidirectional entailment in Ex. (1), RTE must ac-count for the following reformulations: synonymy (However/Nevertheless), more general semantic
relatedness (observers/commentators), phrasal
re-placements (and/as well as), and an active/passive alternation that implies structural change (is de-clared/are terming). This leads us to our main
hy-pothesis: RTE features are designed to distinguish
meaning-preserving variation from true divergence and are thusalsogood predictors in MT evaluation.
However, while the original RTE task is asymmet-ric, MT evaluation needs to determine meaning
equivalence, which is a symmetric relation. We do
this by checking for entailment inboth directions (see Figure 1). Operationally, this ensures we detect
translations which either delete or insert material. Clearly, there are also differences between the two tasks. An important one is that RTE assumes
the well-formedness of the two sentences. This is
not generally true in MT, and could lead to de-graded linguistic analyses. However, entailment relations are more sensitive to the contribution of
individual words (MacCartney and Manning, 2008). In Example 2, the modal modifiers break the
entail-ment between two otherwise identical sentences:
(2) HYP: Peter iscertainly from Lincolnshire. REF: Peter ispossiblyfrom Lincolnshire.
This means that the prediction of TE hinges on correct semantic analysis and is sensitive to
mis-analyses. In contrast, human MT judgments behave robustly. Translations that involve individual errors,
like (2), are judged lower than perfect ones, but usually not crucially so, since most aspects are
still rendered correctly. We thus expect even noisy RTE features to be predictive for translation quality.
This allows us to use an off-the-shelf RTE system to obtain features, and to combine them using a regression model as described in Section 2.
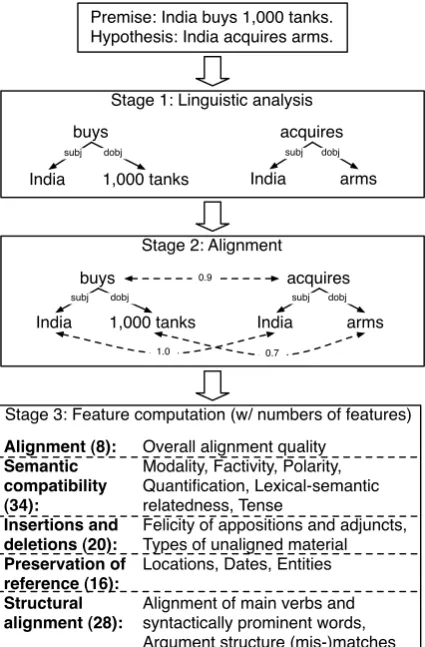
3.1 The Stanford Entailment Recognizer
The Stanford Entailment Recognizer (MacCartney
et al., 2006) is a stochastic model that computes match and mismatch features for each premise-hypothesis pair. The three stages of the system are shown in Figure 2. The system first uses a robust broad-coverage PCFG parser and a
deter-ministic constituent-dependency converter to
Stage 3: Feature computation (w/ numbers of features) Premise: India buys 1,000 tanks.
Hypothesis: India acquires arms.
Stage 1: Linguistic analysis
India buys
1,000 tanks
subj dobj
India acquires
arms
subj dobj
Stage 2: Alignment
India buys
1,000 tanks
subj dobj
India acquires
arms
subj dobj 0.9
1.0 0.7
Alignment (8): Semantic compatibility (34):
Insertions and deletions (20): Preservation of reference (16): Structural alignment (28):
Overall alignment quality Modality, Factivity, Polarity, Quantification, Lexical-semantic relatedness, Tense
Felicity of appositions and adjuncts, Types of unaligned material Locations, Dates, Entities
[image:3.595.76.289.63.387.2]Alignment of main verbs and syntactically prominent words, Argument structure (mis-)matches
Figure 2: The Stanford Entailment Recognizer
the hypothesis. The results are typed dependency graphs that contain a node for each word and la-beled edges representing the grammatical relations between words. Named entities are identified, and
contiguous collocations grouped. Next, it identifies
the highest-scoring alignment from each node in
the hypothesis graph to a single node in the premise
graph, or to null. It uses a locally decomposable scoring function: The score of an alignment is the sum of the local word and edge alignment scores. The computation of these scores make extensive use of about ten lexical similarity resources,
in-cluding WordNet, InfoMap, and Dekang Lin’s
the-saurus. Since the search space is exponential in the hypothesis length, the system uses stochastic
(rather than exhaustive) search based on Gibbs
sam-pling (see de Marneffe et al. (2007)).
Entailment features. In the third stage, the sys-tem produces roughly 100 features for each aligned premise-hypothesis pair. A small number of them
are real-valued (mostly quality scores), but most
are binary implementations of small linguistic
the-ories whose activation indicates syntactic and
se-mantic (mis-)matches of different types. Figure 2 groups the features into five classes. Alignment features measure the overall quality of the align-ment as given by the lexical resources.Semantic compatibility features check to what extent the aligned material has the same meaning and
pre-serves semantic dimensions such as modality and
factivity, taking a limited amount of context into account.Insertion/deletionfeatures explicitly
ad-dress material that remains unaligned and assess its
felicity.Referencefeatures ascertain that the two sentences actually refer to the same events and
par-ticipants. Finally,structural features add structural
considerations by ensuring that argument structure is preserved in the translation. See MacCartney et al. (2006) for details on the features, and Sections 5 and 6 for examples of feature firings.
Efficiency considerations. The use of deep lin-guistic analysis makes our entailment-based
met-ric considerably more heavyweight than traditional MT metrics. The average total runtime per sentence pair is 5 seconds on an AMD 2.6GHz Opteron core – efficient enough to perform regular evaluations on development and test sets. We are currently
investi-gating caching and optimizations that will enable the use of our metric for MT parameter tuning in a Minimum Error Rate Training setup (Och, 2003).
4 Experimental Evaluation
4.1 Experiments
Traditionally, human ratings for MT quality have been collected in the form ofabsolute scoreson a five- or seven-point Likert scale, but low
reliabil-ity numbers for this type of annotation have raised
concerns (Callison-Burch et al., 2008). An alter-native that has been adopted by the yearly WMT
evaluation shared tasks since 2008 is the collection
ofpairwise preference judgments between pairs of
MT hypotheses which can be elicited (somewhat)
more reliably. We demonstrate that our approach works well for both types of annotation and differ-ent corpora. Experimdiffer-ent 1 models absolute scores on Asian newswire, and Experiment 2 pairwise preferences on European speech and news data.
4.2 Evaluation
We evaluate the output of our models both on the
sentence and on the system level. At the sentence
level, we can correlate predictions in Experiment 1
a non-parametric rank correlation coefficient
appro-priate for non-normally distributed data. In
Experi-ment 2, the predictions cannot be pooled between sentences. Instead of correlation, we compute
“con-sistency” (i.e., accuracy) with human preferences. System-level predictions are computed in both
experiments from sentence-level predictions, as the
ratio of sentences for which each system provided the best translation (Callison-Burch et al., 2008). We extend this procedure slightly because
real-valued predictions cannot predict ties, while human
raters decide for a significant portion of sentences (as much as 80% in absolute score annotation) to “tie” two systems for first place. To simulate this behavior, we compute “tie-aware” predictions as the percentage of sentences where the system’s hy-pothesis was assigned a scorebetter or at mostε
worse than the best system.ε is set to match the
frequency of ties in the training data.
Finally, the predictions are again correlated with human judgments using Spearman’sρ. “Tie
aware-ness” makes a considerable practical difference, improving correlation figures by 5–10 points.1
4.3 Baseline Metrics
We consider four baselines. They are small regres-sion models as described in Section 2 over com-ponent scores of four widely used MT metrics. To alleviate possible nonlinearity, we add all features
in linear and log space. Each baselines carries the
name of the underlying metric plus the suffix-R.2
BLEUR includes the following 18 sentence-level
scores: BLEU-n and n-gram precision scores (1≤n≤4); BLEU brevity penalty (BP); BLEU score divided by BP. To counteract BLEU’s
brittle-ness at the sentence level, we also smooth BLEU-n andn-gram precision as in Lin and Och (2004).
NISTR consists of 16 features. NIST-n scores (1≤n≤10) and information-weighted n-gram precision scores (1≤n≤4); NIST brevity penalty (BP); and NIST score divided by BP.
1Due to space constraints, we only show results for “tie-aware” predictions. See Pad´o et al. (2009) for a discussion.
2The regression models can simulate the behaviour of each component by setting the weights appropriately, but are strictly more powerful. A possible danger is that the parameters over-fit on the training set. We therefore verified that the three non-trivial “baseline” regression models indeed confer a bene-fit over the default component combination scores: BLEU-1 (which outperformed BLEU-4 in the MetricsMATR 2008 eval-uation), NIST-4, and TER (with all costs set to 1). We found higher robustness and improved correlations for the regression models. An exception is BLEU-1 and NIST-4 on Expt. 1 (Ar, Ch), which perform 0.5–1 point better at the sentence level.
TERR includes 50 features. We start with the
standard TER score and the number of each of the four edit operations. Since the default uniform cost
does not always correlate well with human
judg-ment, we duplicate these features for 9 non-uniform
edit costs. We find it effective to set insertion cost close to 0, as a way of enabling surface variation, and indeed the new TERp metric uses a similarly low default insertion cost (Snover et al., 2009).
METEORR consists of METEOR v0.7.
4.4 Combination Metrics
The following three regression models implement the methods discussed in Sections 2 and 3.
MTR combines the 85 features of the four base-line models. It uses no entailment features.
RTER uses the 70 entailment features described
in Section 3.1, but no MTR features.
MT+RTER uses all MTR and RTER features,
combining matching and entailment evidence.3
5 Expt. 1: Predicting Absolute Scores
Data. Our first experiment evaluates the models
we have proposed on a corpus with traditional an-notation on a seven-point scale, namely the NIST
OpenMT 2008 corpus.4The corpus contains
trans-lations of newswire text into English from three
source languages (Arabic (Ar), Chinese (Ch), Urdu
(Ur)). Each language consists of 1500–2800 sen-tence pairs produced by 7–15 MT systems.
We use a “round robin” scheme. We optimize the weights of our regression models on two lan-guages and then predict the human scores on the third language. This gauges performance of our models when training and test data come from the same genre, but from different languages, which we believe to be a setup of practical interest. For
each test set, we set the system-level tie parameter ε so that the relative frequency of ties was equal
to the training set (65–80%). Hypotheses generally
had to receive scores within0.3−0.5points to tie.
Results. Table 1 shows the results. We first con-centrate on the upper half (sentence-level results). The predictions of all models correlate highly
sig-nificantly with human judgments, but we still see robustness issues for the individual MT metrics.
3Software for RTER and MT+RTER is available from
Evaluation Data Metrics
train test BLEUR METEORR NISTR TERR MTR RTER MT+RTER
Sentence-level
Ar+Ch Ur 49.9 49.1 49.5 50.1 50.1 54.5 55.6
Ar+Ur Ch 53.9 61.1 53.1 50.3 57.3 58.0 62.7
Ch+Ur Ar 52.5 60.1 50.4 54.5 55.2 59.9 61.1
System-level
[image:5.595.88.506.64.144.2]Ar+Ch Ur 73.9 68.4 50.0 90.0∗ 92.7∗ 77.4∗ 81.0∗ Ar+Ur Ch 38.5 44.3 40.0 59.0∗ 51.8∗ 47.7 57.3∗ Ch+Ur Ar 59.7∗ 86.3∗ 61.9∗ 42.1 48.1 59.7∗ 61.7∗
Table 1: Expt. 1: Spearman’sρ for correlation between human absolute scores and model predictions on
NIST OpenMT 2008. Sentence level: All correlations are highly significant. System level:∗: p<0.05.
METEORR achieves the best correlation for
Chi-nese and Arabic, but fails for Urdu, apparently the most difficult language. TERR shows the best result
for Urdu, but does worse than METEORR for Ara-bic and even worse than BLEUR for Chinese. The
MTR combination metric alleviates this problem to
some extent by improving the “worst-case”
perfor-mance on Urdu to the level of the best individual
metric. The entailment-based RTER system
outper-forms MTR on each language. It particularly
im-proves on MTR’s correlation on Urdu. Even though
METEORR still does somewhat better than MTR
and RTER, we consider this an important confirma-tion for the usefulness of entailment features in MT
evaluation, and for their robustness.5
In addition, the combined model MT+RTER is best for all three languages, outperforming METE -ORR for each language pair. It performs
consid-erably better than either MTR or RTER. This is a second result: the types of evidence provided by MTR and RTER appear to becomplementary and can be combined into a superior model.
On the system level (bottom half of Table 1), there is high variance due to the small number of
predictions per language, and many predictions are
not significantly correlated with human judgments.
BLEUR, METEORR, and NISTR significantly pre-dict one language each (all Arabic); TERR, MTR, and RTER predict two languages. MT+RTER is
the only model that shows significance for all three
languages. This result supports the conclusions we have drawn from the sentence-level analysis.
Further analysis. We decided to conduct a
thor-ough analysis of the Urdu dataset, the most difficult source language for all metrics. We start with a
fea-5These results are substantially better than the performance our metric showed in the MetricsMATR 2008 challenge. Be-yond general enhancement of our model, we attribute the less good MetricsMATR 2008 results to an infelicitous choice of training data for the submission, coupled with the large amount of ASR output in the test data, whose disfluencies represent an additional layer of problems for deep approaches.
20 40 60 80 100
0.42
0.46
0.50
0.54
% Training data MT08 Ar+Ch Spearman's rho on MT 08 Ur ●
● ●
●
● ● ● ● ●
● ● ●
● ● ● ● ● ●
● ●
Metrics Mt−RteR RteR MtR MetR
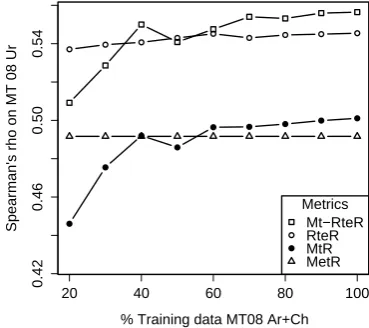
Figure 3: Experiment 1: Learning curve (Urdu).
ture ablation study. Removing any feature group
from RTER results in drops in correlation of at least
three points. The largest drops occur for the struc-tural (δ =−11) and insertion/deletion (δ =−8)
features. Thus, all feature groups appear to con-tribute to the good correlation of RTER. However,
there are big differences in the generality of the
feature groups: in isolation, the insertion/deletion
features achieve almost no correlation, and need to be complemented by more robust features.
Next, we analyze the role of training data. Fig-ure 3 shows Urdu average correlations for models trained on increasing subsets of the training data (10% increments, 10 random draws per step; Ar
and Ch show similar patterns.) METEORR does not improve, which is to be expected given the model
definition. RTER has a rather flat learning curve
that climbs to within 2 points of the final correla-tion value for 20% of the training set (about 400 sentence pairs). Apparently, entailment features do
not require a large training set, presumably because most features of RTER are binary. The remaining
two models, MTR and MT+RTER, show clearer
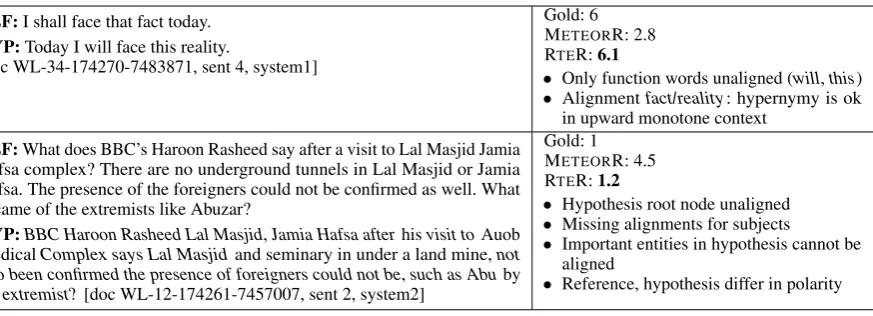
[image:5.595.316.501.207.371.2]REF:I shall face that fact today. HYP:Today I will face this reality.
[doc WL-34-174270-7483871, sent 4, system1]
Gold: 6 METEORR: 2.8 RTER:6.1
• Only function words unaligned (will, this) • Alignmentfact/reality: hypernymy is ok
in upward monotone context
REF:What does BBC’s Haroon Rasheed say after a visit to Lal Masjid Jamia Hafsa complex? There are no underground tunnels in Lal Masjid or Jamia
Hafsa. The presence of the foreigners could not be confirmed as well. What
became of the extremists like Abuzar?
HYP:BBC Haroon Rasheed Lal Masjid, Jamia Hafsa afterhisvisit toAuob
MedicalComplex says Lal Masjid and seminary in under a land mine,not also been confirmed the presence of foreigners could not be, such as Abuby theextremist?[doc WL-12-174261-7457007, sent 2, system2]
Gold: 1 METEORR: 4.5 RTER:1.2
• Hypothesis root node unaligned • Missing alignments for subjects
• Important entities in hypothesis cannot be
aligned
[image:6.595.85.522.60.218.2]• Reference, hypothesis differ in polarity
Table 2: Expt. 1: Reference translations and MT output (Urdu). Scores are out of 7 (higher is better).
Finally, we provide a qualitative comparison of RTER’s performance against the best baseline met-ric, METEORR. Since the computation of RTER
takes considerably more resources than METEORR, it is interesting to compare the predictions of RTER
against METEORR. Table 2 shows two classes of examples with apparent improvements.
The first example (top) shows a good translation
that is erroneously assigned a low score by ME -TEORR because (a) it cannot alignfact andreality
(METEORR aligns only synonyms) and (b) it
pun-ishes the change of word order through its “penalty”
term. RTER correctly assigns a high score. The
features show that this prediction results from two
semantic judgments. The first is that the lack of alignments for two function words is unproblem-atic; the second is that the alignment betweenfact
and reality, which is established on the basis of WordNet similarity, is indeed licensed in the cur-rent context. More generally, we find that RTER
is able to account for more valid variation in good translations because (a) it judges the validity of alignments dependent on context; (b) it incorpo-rates more semantic similarities; and (c) it weighs mismatches according to the word’s status.
The second example (bottom) shows a very bad
translation that is scored highly by METEORR,
since almost all of the reference words appear either
literally or as synonyms in the hypothesis (marked
in italics). In combination with METEORR’s con-centration on recall, this is sufficient to yield a
moderately high score. In the case of RTER, a num-ber of mismatch features have fired. They indicate
problems with the structural well-formedness of the MT output as well as semantic incompatibil-ity between hypothesis and reference (argument structure and reference mismatches).
6 Expt. 2: Predicting Pairwise Preferences
In this experiment, we predict human pairwise
pref-erence judgments (cf. Section 4). We reuse the linear regression framework from Section 2 and predict pairwise preferences by predicting two ab-solute scores (as before) and comparing them.6
Data. This experiment uses the 2006–2008 cor-pora of the Workshop on Statistical Machine
Translation (WMT).7It consists of data from
EU-ROPARL (Koehn, 2005) and various news
com-mentaries, with five source languages (French, Ger-man, Spanish, Czech, and Hungarian). As training
set, we use the portions of WMT 2006 and 2007 that are annotated with absolute scores on a five-point scale (around 14,000 sentences produced by 40 systems). The test set is formed by the WMT 2008 relative rank annotation task. As in Experi-ment 1, we setεso that the incidence of ties in the
training and test set is equal (60%).
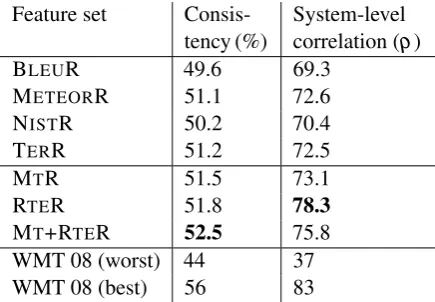
Results. Table 4 shows the results. The left result
column shows consistency, i.e., the accuracy on human pairwise preference judgments.8 The pat-tern of results matches our observations in Expt. 1: Among individual metrics, METEORR and TERR
do better than BLEUR and NISTR. MTR and RTER
outperform individual metrics. The best result by a wide margin, 52.5%, is shown by MT+RTER.
6We also experimented with a logistic regression model that predicts binary preferences directly. Its performance is comparable; see Pad´o et al. (2009) for details.
7Available fromhttp://www.statmt.org/.
8The random baseline is not 50%, but, according to our
experiments, 39.8%. This has two reasons: (1) the judgments
Segment MTR RTER MT+RTER Gold REF: Scottish NHS boards need to improve criminal records checks for
employees outside Europe, a watchdog has said.
HYP: The Scottish health ministry should improve the controls on extra-community employees to check whether they have criminal precedents,
said the monitoring committee. [1357, lium-systran]
Rank: 3 Rank:1 Rank: 2 Rank: 1
REF: Arguments, bullying and fights between the pupils have extended
to the relations between their parents.
HYP: Disputes, chicane and fights between the pupils transposed in relations between the parents. [686, rbmt4]
[image:7.595.74.525.61.184.2]Rank:5 Rank: 2 Rank: 4 Rank: 5
Table 3: Expt. 2: Reference translations and MT output (French). Ranks are out of five (smaller is better).
Feature set
Consis-tency (%)
System-level correlation (ρ)
BLEUR 49.6 69.3
METEORR 51.1 72.6
NISTR 50.2 70.4
TERR 51.2 72.5
MTR 51.5 73.1
RTER 51.8 78.3
MT+RTER 52.5 75.8
WMT 08 (worst) 44 37
WMT 08 (best) 56 83
Table 4: Expt. 2: Prediction of pairwise preferences
on the WMT 2008 dataset.
The right column shows Spearman’sρ for the
correlation between human judgments and tie-aware system-level predictions. All metrics predict
system scores highly significantly, partly due to the larger number of systems compared (87 systems).
Again, we see better results for METEORR and
TERR than for BLEUR and NISTR, and the
indi-vidual metrics do worse than the combination
mod-els. Among the latter, the order is: MTR (worst),
MT+RTER, and RTER (best at 78.3).
WMT 2009. We submitted the Expt. 2 RTER metric to the WMT 2009 shared MT evaluation task (Pad´o et al., 2009). The results provide fur-ther validation for our results and our general
ap-proach. At the system level, RTER made third place (avg. correlationρ=0.79), trailing the two top
met-rics closely (ρ=0.80,ρ=0.83) and making the
best predictions for Hungarian. It also obtained the second-best consistency score (53%, best: 54%).
Metric comparison. The pairwise preference
an-notation of WMT 2008 gives us the opportunity to compare the MTR and RTER models by comput-ing consistency separately on the “top” (highest-ranked) and “bottom” (lowest-(highest-ranked) hypotheses
for each reference. RTER performs about 1.5
per-cent better on the top than on the bottom hypothe-ses. The MTR model shows the inverse behavior, performing 2 percent worse on the top hypothe-ses. This matches well with our intuitions: We see some noise-induced degradation for the entailment features, but not much. In contrast, surface-based
features are better at detecting bad translations than
[image:7.595.72.290.221.372.2]at discriminating among good ones.
Table 3 further illustrates the difference between the top models on two example sentences. In the top
example, RTER makes a more accurate prediction
than MTR. The human rater’s favorite translation deviates considerably from the reference in
lexi-cal choice, syntactic structure, and word order, for which it is punished by MTR (rank 3/5). In contrast,
RTER determines correctly that the propositional content of the reference is almost completely pre-served (rank 1). In the bottom example, RTER’s
prediction is less accurate. This sentence was rated as bad by the judge, presumably due to the inap-propriate main verb translation. Together with the subject mismatch, MTR correctly predicts a low
score (rank 5/5). RTER’s attention to semantic
over-lap leads to an incorrect high score (rank 2/5).
Feature Weights. Finally, we make two
observa-tions about feature weights in the RTER model.
First, the model has learned high weights not only for the overall alignment score (which
be-haves most similarly to traditional metrics), but also
for a number of binary syntacto-semantic match and mismatch features. This confirms that these features systematically confer the benefit we have
shown anecdotally in Table 2. Features with a con-sistently negative effect include dropping adjuncts,
Con-versely, higher scores result from factors such as high alignment score, matching embeddings under factive verbs, and matches between appositions.
Second, good MT evaluation feature weights are not good weights for RTE. Some differences,
par-ticularly for structural features, are caused by the
low grammaticality of MT data. For example, the
feature that fires for mismatches between
depen-dents of predicates is unreliable on the WMT data.
Other differences do reflect more fundamental
dif-ferences between the two tasks (cf. Section 3). For
example, RTE puts high weights onto quantifier
and polarity features, both of which have the poten-tial of influencing entailment decisions, but are (at
least currently) unimportant for MT evaluation.
7 Related Work
Researchers have exploited various resources to en-able the matching between words orn-grams that
are semantically close but not identical. Banerjee and Lavie (2005) and Chan and Ng (2008) use WordNet, and Zhou et al. (2006) and Kauchak and Barzilay (2006) exploit large collections of automatically-extracted paraphrases. These ap-proaches reduce the risk that a good translation is rated poorly due to lexical deviation, but do not
address the problem that a translation may contain
many long matches while lacking coherence and
grammaticality (cf. the bottom example in Table 2).
Thus, incorporation of syntactic knowledge has
been the focus of another line of research. Amigo´
et al. (2006) use the degree of overlap between the
dependency trees of reference and hypothesis as a predictor of translation quality. Similar ideas have been applied by Owczarzak et al. (2008) to LFG parses, and by Liu and Gildea (2005) to features
derived from phrase-structure tress. This approach
has also been successful for the related task of summarization evaluation (Hovy et al., 2006).
The most comparable work to ours is Gimenez´ and M´arquez (2008). Our results agree on the
cru-cial point that the use of a wide range of linguistic
knowledge in MT evaluation is desirable and im-portant. However, Gimenez and M´ arquez advocate´ the use of a bottom-up development process that builds on a set of “heterogeneous”, independent metrics each of which measures overlap with re-spect to one linguistic level. In contrast, our aim is to provide a “top-down”, integrated motivation for the features we integrate through the textual entailment recognition paradigm.
8 Conclusion and Outlook
In this paper, we have explored a strategy for the evaluation of MT output that aims at
comprehen-sively assessing themeaning equivalencebetween
reference and hypothesis. To do so, we exploit the common ground between MT evaluation and the Recognition of Textual Entailment (RTE), both of which have to distinguish valid from invalid lin-guistic variation. Conceputalizing MT evaluation as an entailment problem motivates the use of a
rich feature set that covers, unlike almost all earlier metrics, a wide range of linguistic levels, including
lexical, syntactic, and compositional phenomena. We have used an off-the-shelf RTE system to compute these features, and demonstrated that a regression model over these features can outper-form an ensemble of traditional MT metrics in two experiments on different datasets. Even though the features build on deep linguistic analysis, they are robust enough to be used in a real-world setting, at least on written text. A limited amount of training data is sufficient, and the weights generalize well. Our data analysis has confirmed that each of the feature groups contributes to the overall success of the RTE metric, and that its gains come from its better success at abstracting away from valid vari-ation (such as word order or lexical substitution), while still detecting major semantic divergences.
We have also clarified the relationship between MT evaluation and textual entailment: The majority of phenomena (but not all) that are relevant for RTE
are also informative for MT evaluation.
The focus of this study was on the use of an
ex-isting RTE infrastructure for MT evaluation. Future work will have to assess the effectiveness of individ-ual features and investigate ways to customize RTE
systems for the MT evaluation task. An interesting aspect that we could not follow up on in this paper is that entailment features are linguistically
inter-pretable (cf. Fig. 2) and may find use in uncovering
systematic shortcomings of MT systems.
A limitation of our current metric is that it is language-dependent and relies on NLP tools in the target language that are still unavailable for
many languages, such as reliable parsers. To some
extent, of course, this problem holds as well for state-of-the-art MT systems. Nevertheless, it must
be an important focus of future research to develop
References
Enrique Amig´o, Jes´us Gim´enez, Julio Gonzalo, and Llu´ıs M`arquez. 2006. MT Evaluation: Human-like vs. human acceptable. InProceedings of COL-ING/ACL 2006, pages 17–24, Sydney, Australia.
Satanjeev Banerjee and Alon Lavie. 2005. METEOR: An automatic metric for MT evaluation with im-proved correlation with human judgments. In Pro-ceedings of the ACL Workshop on Intrinsic and Ex-trinsic Evaluation Measures, pages 65–72, Ann Ar-bor, MI.
Chris Callison-Burch, Miles Osborne, and Philipp Koehn. 2006. Re-evaluating the role of BLEU in machine translation research. In Proceedings of EACL, pages 249–256, Trento, Italy.
Chris Callison-Burch, Cameron Fordyce, Philipp Koehn, Christof Monz, and Josh Schroeder. 2008. Further meta-evaluation of machine translation. In
Proceedings of the ACL Workshop on Statistical Ma-chine Translation, pages 70–106, Columbus, OH.
Yee Seng Chan and Hwee Tou Ng. 2008. MAXSIM: A maximum similarity metric for machine translation evaluation. InProceedings of ACL-08: HLT, pages 55–62, Columbus, Ohio, June.
Ido Dagan, Oren Glickman, and Bernardo Magnini. 2005. The PASCAL recognising textual entailment challenge. In Proceedings of the PASCAL Chal-lenges Workshop on Recognising Textual Entailment, Southampton, UK.
Marie-Catherine de Marneffe, Trond Grenager, Bill MacCartney, Daniel Cer, Daniel Ramage, Chlo´e Kiddon, and Christopher D. Manning. 2007. Align-ing semantic graphs for textual inference and ma-chine reading. InProceedings of the AAAI Spring Symposium, Stanford, CA.
George Doddington. 2002. Automatic evaluation of machine translation quality using n-gram cooccur-rence statistics. InProceedings of HLT, pages 128– 132, San Diego, CA.
Jes´us Gim´enez and Llu´ıs M´arquez. 2008. Het-erogeneous automatic MT evaluation through non-parametric metric combinations. InProceedings of IJCNLP, pages 319–326, Hyderabad, India.
Sanda Harabagiu and Andrew Hickl. 2006. Methods for using textual entailment in open-domain ques-tion answering. InProceedings of ACL, pages 905– 912, Sydney, Australia.
Eduard Hovy, Chin-Yew Lin, Liang Zhou, and Junichi Fukumoto. 2006. Automated summarization evalu-ation with basic elements. InProceedings of LREC, Genoa, Italy.
David Kauchak and Regina Barzilay. 2006. Paraphras-ing for automatic evaluation. InProceedings of HLT-NAACL, pages 455–462.
Phillip Koehn. 2005. Europarl: A parallel corpus for statistical machine translation. InProceedings of the MT Summit X, Phuket, Thailand.
Chin-Yew Lin and Franz Josef Och. 2004. ORANGE: a method for evaluating automatic evaluation met-rics for machine translation. InProceedings of COL-ING, pages 501–507, Geneva, Switzerland.
Ding Liu and Daniel Gildea. 2005. Syntactic features for evaluation of machine translation. In Proceed-ings of the ACL Workshop on Intrinsic and Extrinsic Evaluation Measures, pages 25–32, Ann Arbor, MI.
Bill MacCartney and Christopher D. Manning. 2008. Modeling semantic containment and exclusion in natural language inference. InProceedings of COL-ING, pages 521–528, Manchester, UK.
Bill MacCartney, Trond Grenager, Marie-Catherine de Marneffe, Daniel Cer, and Christopher D. Man-ning. 2006. Learning to recognize features of valid textual entailments. InProceedings of NAACL, pages 41–48, New York City, NY.
Franz Josef Och. 2003. Minimum error rate training in statistical machine translation. InProceedings of ACL, pages 160–167, Sapporo, Japan.
Karolina Owczarzak, Josef van Genabith, and Andy Way. 2008. Evaluating machine translation with LFG dependencies. Machine Translation, 21(2):95– 119.
Sebastian Pad´o, Michel Galley, Dan Jurafsky, and Christopher D. Manning. 2009. Textual entailment features for machine translation evaluation. In Pro-ceedings of the EACL Workshop on Statistical Ma-chine Translation, pages 37–41, Athens, Greece.
Kishore Papineni, Salim Roukos, Todd Ward, and Wei-Jing Zhu. 2002. BLEU: a method for automatic evaluation of machine translation. In Proceedings of ACL, pages 311–318, Philadelphia, PA.
Michael Paul, Andrew Finch, and Eiichiro Sumita. 2007. Reducing human assessment of machine translation quality to binary classifiers. In Proceed-ings of TMI, pages 154–162, Sk¨ovde, Sweden.
Matthew Snover, Bonnie Dorr, Richard Schwartz, Lin-nea Micciulla, and John Makhoul. 2006. A study of translation edit rate with targeted human annota-tion. InProceedings of AMTA, pages 223–231, Cam-bridge, MA.
Matthew Snover, Nitin Madnani, Bonnie J. Dorr, and Richard Schwartz. 2009. Fluency, adequacy, or HTER? Exploring different human judgments with a tunable MT metric. In Proceedings of the EACL Workshop on Statistical Machine Translation, pages 259–268, Athens, Greece.