Munich Personal RePEc Archive
A Suicidal Kuznets Curve?
Antonakakis, Nikolaos and Collins, Alan
University of Portsmouth, Webster Vienna Private University
6 May 2016
Online at
https://mpra.ub.uni-muenchen.de/71108/
A Suicidal Kuznets Curve?
Nikolaos Antonakakis
∗
1,2
and Alan Collins
2
1
University of Portsmouth, Economics and Finance Group, Portsmouth Business School, Portland
Street, Portsmouth, PO1 3DE, United Kingdom
2
Webster Vienna University, Department of Business and Management, Praterstrasse 23, 1020, Vienna,
Austria
May 6, 2016
Abstract
In 1955 Simon Kuznets hypothesized an inverted
U
-shaped relationship between economic
growth and income inequality. Environmental and obesity variants substitute pollution and
body mass metrics for income inequality. Graphical depictions of both feature widely in
economic literature. In this study, we investigate the existence (or lack thereof) of a suicidal
Kuznets curve. Controlling for several country-specific socioeconomic suicide determinants
among 73 countries over the period 1990–2010, we find evidence of an
N
-shaped suicidal
Kuznets curve between per capita income and suicide rates of the male population of 25–
34, 34–54 and 55–74 age groups and the female population of the 55–74 age group. The
turning points of per capita income for the male population of 25–34, 34–54 and 55–74 age
groups are $7,727 and $46,306, $5,266 and $22,726, and $3,459 and $53,260, respectively,
while for the female population of the 55–74 age groups are $4,022 and $43,351. On average
and across both genders, as per capita income increases, suicide rates for those aged 25–34
and 35–54 follow an increasing trend and peak when per capita income reaches $7,304 and
$6,498, respectively, then follow a declining trend until $60,819 and $25,129, respectively,
and increase thereafter again. These results remain robust to a battery of robustness checks.
Keywords: Suicide, GDP growth, Kuznets curve, Unemployment, Fertility, Life expectancy
JEL codes: C33, E32, I15, I31, J13
∗
Corresponding author: e-mail: [email protected], tel: +44 (0)23 9284 4261, fax: +44 (0)23
1
Introduction
Worldwide increases in suicide rates, has generated mounting public concern over mental health
issues and has sparked efforts to understand more clearly the underlying reasons for this
phe-nomenon. According to the World Health Organization, WHO (2015): “
(i) over 800,000 people
die due to suicide every year; (ii) for every suicide there are many more people who attempt
sui-cide every year; (iii) a prior suisui-cide attempt is the single most important risk factor for suisui-cide
in the general population; (iv) suicide is the second leading cause of death among the 15-29 age
group; and (v) 75% of global suicides occur in low-and middle-income countries.
”
The mental health effects of variations in socioeconomic factors have received increasing
attention from sociologists, as well as economists in the last couple of centuries. One
partic-ular aspect, the linkage of suicide mortality to unemployment, has prompted much discussion
in recent decades (e.g. Kposowa, 2003; Preti, 2003; Kuroki, 2010; Chen et al., 2010, 2012;
An-tonakakis and Collins, 2014, 2015; Huijts et al., 2015, among others) and a sizeable literature
on the link between several socioeconomic indicators, such as income and/or economic growth
(Hamermesh and Soss, 1974; Jungeilges and Kirchgassner, 2002; Viren, 2005), divorce rates
(Lester, 1996; Chuang and Huang, 1997; Brainerd, 2001; Kunce and Anderson, 2002; Neumayer,
2003a,b; Andr´es, 2005; Chuang and Huang, 2007; Koo and Cox, 2008; Yamamura, 2010), fertility
rates (Chuang and Huang, 1997, 2007; Neumayer, 2003a,b) and alcohol consumption (Brainerd,
2001; Neumayer, 2003a,b), among others (for survey on the various socioeconomic determinants
of suicides, see Chen et al., 2012).
Despite the breadth and depth of the existing studies, no study to our best knowledge
examines in a systematic fashion the suicide-income (growth) relationship.
From a theoretical perspective, an individual decides to commit suicide when the discounted
expected life time utility remaining to him falls below some threshold (Hamermesh and Soss,
1974). According to this theoretical contribution, the higher future expected income is, the
higher is the expected lifetime utility. Thus, living is relatively more attractive than committing
suicide, and a higher income should lower suicide rates. Conversely, Lester (1996) and Unnithan
et al. (1994) state that economic development increases suicide rates. This could be attributed to
the fact that higher income levels could increase independence (the opposite of social integration)
and might lead to higher suicide mortality. Given that during economic recessions, individuals’
future expected income and as a consequence their consumption level decreases, individuals
to a decline in suicide mortality (e.g. Henry and Short, 1954). By contrast, Ginsberg (1966),
argues that economic prosperity increases suicide rates. Further, Durkheim (1897) postulates
that suicide rates tend to increase both in times of economic expansion and contraction.
Empirical work also offers mixed evidence. In particular, while several studies find that
suicide rates have a positive association with income (e.g. Vir´en, 1999; Jungeilges and
Kirch-gassner, 2002), there are many others suggesting the opposite effect (e.g. Chuang and Huang,
1997; Brainerd, 2001; Neumayer, 2003a; Andr´es, 2005; Chuang and Huang, 2007; Minoiu and
Andres, 2008; Altinanahtar and Halicioglu, 2009; Andr´es and Halicioglu, 2010; Andr´es et al.,
2011; Okada and Samreth, 2013). Yet, others have found an insignificant effect of income on
suicide (Ruhm, 2000; Cuellar and Markowitz, 2007). Last but not least, the significant
nega-tive relationship between income and suicide rates seems to be stronger for males than that for
females (Qin et al., 2010).
Thus both the existing economic and sociological theories present contested viewpoints, and
they do not permit a firm determination as to whether the level of income (i.e. economic
development) may have a positive or negative effect on suicide. Since the suicide toll and
suicide-caused economic loss of any country over time may reflect its suicide vulnerability and
resilience to economic change, in-depth scrutiny of the changes in suicide mortality in relation
to economic development level can shed some light on the effectiveness of a nation’s suicide
prevention management and serve as a reference for future policy initiatives.
Against this backdrop, we aim to fill this apparent gap in the literature by examining whether
suicide mortality differs with respect to the level of economic development among countries. Put
differently, we investigate the existence (or lack thereof) of a ‘suicidal Kuznets curve’ (SKC) by
adopting the rationale from the originally hypothesized Kuznets relationship (Kuznets, 1955).
He hypothesized that income inequality first rises and then falls as economic development
pro-ceeds. The concept has been applied to environmental studies hypothesizing that the relationship
between per capita income and the use of natural resources and/or the emission of wastes, such
as the well-known environmental Kuznets curve (EKC), has an inverted
U
-shape. According
to Stern (2004, p.1419), “
the EKC is a hypothesized relationship between various indicators of
environmental degradation and income per capita. Specifically, in the early stages of economic
growth degradation and pollution increase, but beyond some level of income per capita, which will
vary for different indicators, the trend reverses, so that at high income levels economic growth
leads to environmental improvement. This implies that the environmental impact indicator is an
2005, for useful surveys on the environmental Kuznets curve hypothesis). Recently, the Kuznets
curve has been expanded to an ‘obesity Kuznets curve’, showing that as development occurs,
calorie intake and obesity rates first increase; then decrease because personal health becomes
a more valued asset and people decrease their obesity levels (see Akee et al., 2010; Grecu and
Rotthoff, 2015).
The results of our empirical analysis on an international annual panel dataset of 73
coun-tries over the period 1990-2010 reveals several empirical regularities. First, we find evidence of
an
N
-shaped suicidal Kuznets curve between per capita income and suicide rates of the male
population of the 25-34, 34-54 and 55–74 age groups and the female population of the 55-74 age
group. Second, the turning points of per capita income for the male population of the 25-34,
34-54 and 55–74 age groups are $7,727 and $46,306, $5,266 and $22,726, and $3,459 and $53,260,
respectively, while for the female population of the 55-74 age group are $4,022 and $43,351.
Third, average and across all ages and genders, as per capita income increases, suicides follow
an increasing trend and peak when per capita income reaches $2,250, then follow a declining
trend until $8,424, and increase thereafter again. These results remain robust to a battery of
robustness checks.
The turning points of per capita income for the male population of the 25-34 and 34-54
age groups are $2,416 and $30,283, and $1,534 and $19,532, respectively, while for the female
population of the 15-24 and 35-54 age groups are $1,500 and $13,049, and $1,905 and $24,479,
respectively. On average and across all ages and genders, as per capita income increases, suicides
follow an increasing trend and peak when per capita income reaches $2,250, then follow a
declining trend until $8,424, and increase thereafter again. The extensive cross-country evidence
presented in this study confirm the presence of an empirically founded
N
-shaped suicide Kuznets
curve. The results are consistent with an explanation founded on a changing pattern of net
negative and positive mental health spillover effects associated with income growth or economic
development. We provide some strong intuitive conjecture to help account for this phenomenon.
The remainder of this paper is organised as follows. Section 2, outlines the theoretical and
empirical model, and describes the data used. Section 3 presents the empirical results and
2
Data and Methodology
2.1
Data
We collect annual observations of gender- and age-specific suicide data (with suicides defined as
number of deaths by suicide and self-inflicted injury/intentional self-harm, ICD-7 codes E963,
E970-E979, ICD-8 and ICD-9 codes E950-E959, ICD-10 codes X60-X84) and population data
from the World Health Organization (WHO) Mortality Database. Missing values of suicide and
population are supplemented (whenever available) with data from the Official National Statistics
of each country and United Nations Statistics, respectively. After a careful inspection of the
series we end up with panel dataset of 73 countries over the period 1990 to 2010. The choice of
the specific countries and periods is purely based on data availability.
We then convert the number of suicides to suicide rates per 100,000 inhabitants (by diving
suicides by population and multiplying the resulting number by 100,000), broken down by age
and gender in each of the 73 countries. Further, following the previous literature (e.g. Chen
et al., 2012), we additionally control for the potential socioeconomic determinants of suicide
rates across countries. Specifically, we consider the following determinants: 1) real per capita
GDP (in purchasing power parity, PPP, terms), 2) GDP growth defined as the first logarithmic
difference of real per capita GDP, 3) unemployment rates broken down by gender, 4) fertility
rates defined as births per woman, 5) urban population as a % of total population, and 6) life
expectancy at birth defined as the number of years a newborn infant would live if prevailing
patterns of mortality at the time of its birth were to stay the same throughout its life. Each
of these series were retrieved from World Development Indicators (WDI) database maintained
by the World Bank. For further data description and discussion, please refer to the Online
Appendix.
2.2
Empirical Methodology
We estimate variants of the following (extended) Suicidal Kuznets curve model:
S
ijkt
=
α
0
+
α
1
S
ijkt
−
1
+
β
1
Y
it
+
β
2
Y
2
it
+
β
3
Y
it
3
+
β
4
E
it
+
β
5
D
it
+
γ
i
+
δ
t
+
ε
it
(1)
where
S
ijkt
is the suicide rate in country
i
(where
i
= 1, 2, ..., 63), population
j
(where
j
= overall, male, female), age group
k
(where
k
= all, 15-24, 25-34, 35-54, 55-74, 75+ years)
and time
t
(where
t
= 1990,...,2010);
α
0
is a constant;
S
ijkt
−
1
is the first lag of
S
ijkt
and is
in the series;
Y
it
,
Y
it
2
and
Y
it
3
denote the logarithm of real per capita GDP (at purchasing power
parity, PPP, rates; 2011 US$) in level, square and cubic terms, respectively;
E
it
is a vector of
economic characteristics affecting suicide rates, such as the growth rate of real GDP,
Growth
it
,
and the unemployment rate,
U nemp
ijt
;
D
it
is a vector of demographic and social characteristics
affecting suicide rates, such as fertility rate,
F ert
it
, life expectancy,
Lif exp
ijt
and the share of
urban population,
U rban
it
.
γ
1i
are country fixed–effects controlling for time–invariant country
characteristics, and
δ
t
are time fixed–effects, controlling for any time–varying differences in the
dependent variable common to all countries, such as the global financial crisis.
ε
it
is the error
term.
However, the inclusion of the lagged dependent variable,
S
ijkt
gives rise to ‘dynamic panel
bias’ (Nickell, 1981), and any potential endogeneity of the right hand side variables, may give
rise to inconsistent estimates under the fixed effects (FE) estimator. To overcome these issues,
we employ the system generalised method of moments (System–GMM) estimator developed
by Arellano and Bover (1995), and Blundell and Bond (1998). The System–GMM approach
involves joint estimation of the suicide rates equation in levels and first differences, using first
differences as instruments in the level equation and lagged levels as instruments in the first
difference equation. Moreover, we use the two–step rather than the one–step approach, as the
former is asymptotically more efficient than the latter (Windmeijer, 2005), and is also robust to
substantial heteroskedasticity and autocorrelation within panels (Roodman, 2009).
The inclusion of the logarithm of per capita GDP in level,
Y
t
, square,
Y
t
2
, and cubic,
Y
t
3
,
terms in model (1) serves as our primary focus in the examination of the potential relationship
between suicide rates and economic development, which we name the ‘Suicidal Kuznets curve’
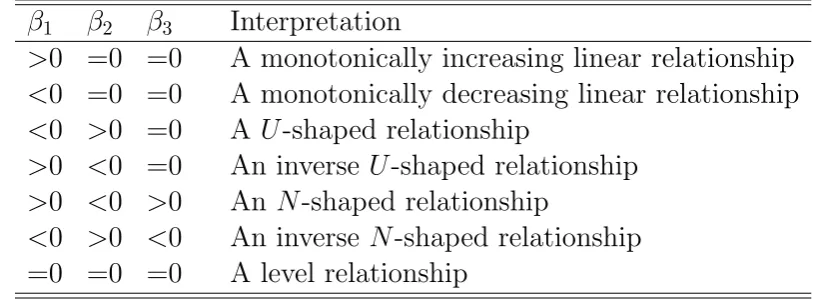
(SKC). The existence (or lack thereof) and shape of a Suicidal Kuznets curve depends on the
significance and signs of the coefficients
β
1
,
β
2
and
β
3
from model (1). The various potential
implied relationships between suicide mortality and economic development are summarized in
Table 1. For instance, according to Table 1, an inverse
U
-shaped relationship corresponds to the
case where
β
1
is significantly positive,
β
2
significantly negative and
β
3
insignificantly different
from zero, while an
N
-shaped relationship exists when
β
1
and
β
3
are significantly positive and
β
2
significantly negative. The former case (inverse
U
-shaped curve), exists when suicide mortality
first increases with increasing income per capita, but after a certain point in increasing income
per capita, suicide mortality tends to decline. The latter case (N
-shaped curve), exists when
suicide mortality shows a positive, negative and positive relationship, respectively with income
after a certain level. This is how the first peak is formed. Along with further increase in income
per capita, suicide mortality tends to rise again, which provides a trough in the
N
-shaped
Suicidal Kuznets curve.
[Insert Table 1 around here]
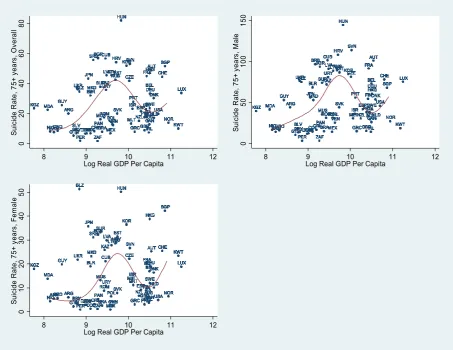
As a first step in our endeavour to examine the existence (or lack thereof) of a Suicidal
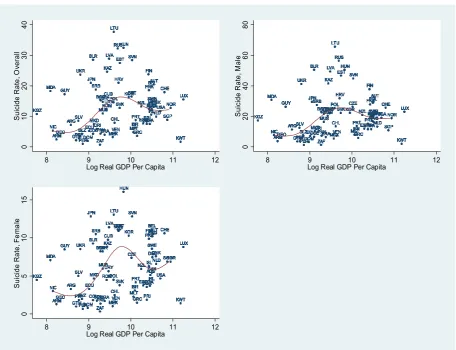
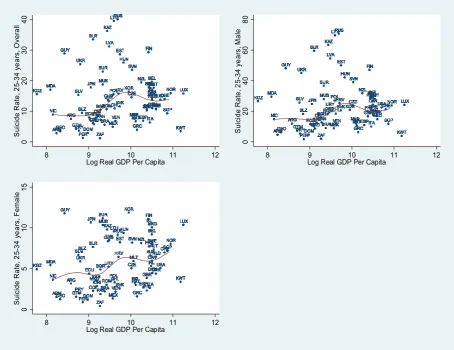
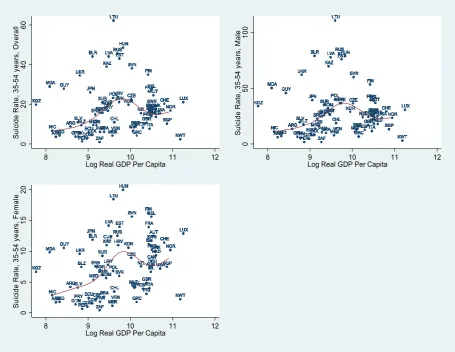
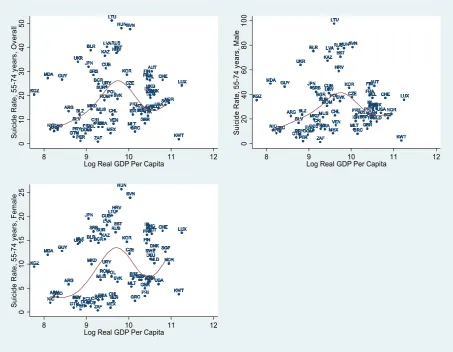
Kuznets curve, we plot average suicide rates and average logged per capita GDP across genders
and age groups in Figures 1-6. A visual inspection of these scatter plots, which also include
the median splines, reveals some interesting patterns. In particular, countries with low per
capita income (e.g. Nicaragua, Armenia, Georgia, Paraguay and Croatia) are associated with
low suicide rates. Then countries with per capita GDP at the sample mean of per capita GDP
distribution exhibit the highest suicide rates (e.g. Lithuania, Russia, Hungary, Latvia, Estonia
and Bulgaria). Countries with per capita GDP above the sample mean of the distribution
experience low suicide rates (such as Malta, Portugal, Greece, Spain, Puerto Rico and Israel).
Finally, countries at the highest quantiles of the per capita GDP distribution (such as Finland,
Norway, Denmark, Sweden, Iceland, Switzerland, Luxembourg, the United States and Austria)
experience higher suicide rates compared to those in the previous group, but higher to those in
the sample mean of the distribution. Thus, this visual inspection of the scatter plots points to
the direction of either an inverted
U
-shaped or an
N-shaped Suicidal Kuznets curve. Yet, only
a formal empirical analysis can convincingly reveal the real pattern (provided it exists) of the
Suicidal Kuznets curve.
[Insert Figures 1-6 around here]
Thus, in the next section we present the results of our empirical analysis based on model (1)
in an attempt to unravel the specific shape of the potential Suicidal Kuznets curve.
3
Estimation Results
3.1
Baseline Results
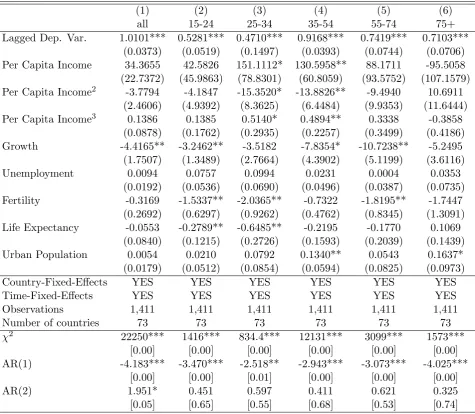
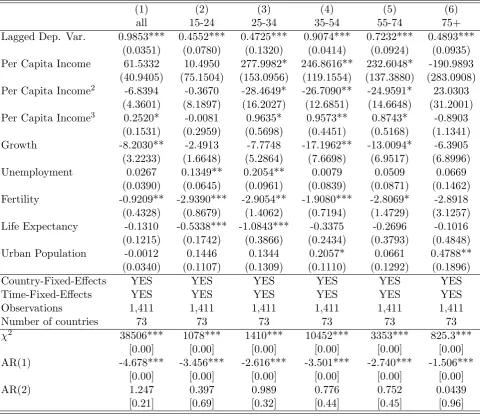
The main results of our empirical analysis based on the two–step System–GMM estimator of
model (1) for overall, male and female population, across the various age groups, are reported
of interest, i.e. income per capita, in Tables 2, 3 and 4, and then discuss the results of the
remaining explanatory variables.
[Insert Tables 2-4 around here]
According to these results, there is evidence of gender– and age–specificity in the relationship
between suicide rates and economic development. Focusing on the overall population results
reported in Table 2, we observe that the coefficients of per capita income, its square and and
its cubic counterparts are positive, negative and positive, respectively, across all ages in Table
2. Yet, they are only significant for the 25–34 (at the 10% level) and 35–54 (at the 5% level)
age groups, under columns (3) and (4) of Table 2, respectively. This provides evidence of
the existence of an
N
-shaped Suicidal Kuznets curve only for the aforementioned age groups.
Further, the validity of our instruments is strongly supported, as the autocorrelation tests of
order 1 and 2 in the first-differenced residuals of the GMM approach point to first–order but
not second–order autocorrelation, as one would expect.
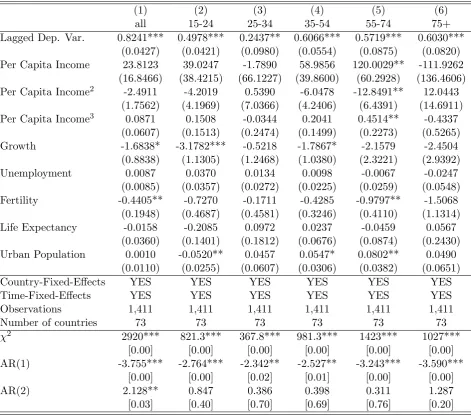
A similar pattern is observed for the male population results reported in Table 3. Specifically,
there is evidence of the existence of an
N
-shaped Suicidal Kuznets curve for males in the 25–34
(at the 10% level), 35–54 (at the 5% level) and 55–74 (at the 10% level) age groups, under
columns (3), (4) and (5) of Table 3, respectively. Again, the results of the autocorrelation tests
reported in the lower panel of Table 3 provide strong support to the validity of our instruments.
Turning to the female population results reported in Table 4, an
N
-shaped Suicidal Kuznets
curve is identified for females in the 55–74 age group under column (5) of Table 4. Last but not
least, our system GMM model is correctly specified, as the results of the autocorrelation tests
provide strong support to the validity of our instruments.
The
N
-shaped Suicidal Kuznets curves identified empirically here are in line with the
corre-sponding scatter plots presented in Figures 3-5 above. For instance, the median spline for the
female population of the 55–74 age group, which is reported in Figure 5, indicates much stronger
evidence of an
N-shaped Suicidal Kuznets curve compared to that of the male or overall
popu-lation in the same age group. That is, our empirical results suggest that a significant
N
-shaped
Suicidal Kuznets curve exists only for the female population of the 55–74 age group.
The results for the remaining predictors of suicide mortality accounted for are correctly signed
(i.e. in line with the existing literature) and significant in many instances. Yet, there is also
evidence of gender– and age– heterogeneity in the responses of suicides rates to those predictors.
the male population in the 15–24 and 25–34 age groups, while the female population across all
ages is insulated to changes in unemployment as the unemployment coefficient is insignificant.
This result is in line with Brainerd (2001) who finds that male suicide rates are highly sensitive
to the state of the macroeconomy, while female suicide rates are insensitive to the state of
the macroeconomy. Moreover, these results indicate that the aforementioned
unemployment-stricken male population groups, i.e., the highly productive and well skilled parts of the labour
force, have a higher probability to commit suicide if they become unemployed compared to
the (female) population in any other age group (see e.g. Antonakakis and Collins, 2014, 2015).
Economic growth is significantly associated with lower suicide mortality of the male population
in the 35–54 and 55–74 age groups, and the female population in the 15–24 age group and, to a
lower extent, in the 35–54 age group. These results again point to the direction that males are
more heavily affected by the state of the macroeconomy compared to females (see e.g. Brainerd,
2001; Antonakakis and Collins, 2014, 2015).
Fertility is a significant predictor of lower suicide mortality in the male population of ages
between 15 and 74, and in the female population in the 55–74 age group. This result is very
much in line with the existing literature. For instance, Durkheim (1897) and Andr´es (2005)
make the case for fertility rate to be viewed as an indicator of social integration, suggesting high
fertility rates are related to lower suicidality. The absence of children is thus associated by them
with greater fluidity in family integration and social ties. Moreover, higher life expectancy is
related with lower suicide mortality in the male population of ages between 15 and 34. Higher
life expectancy is indicative of good nutrition, greater well-being/health investment and effective
healthcare, all of which can be intuitively argued to lower suicide risk.
Finally, countries with high ratio of urban to total population are positively associated with
suicide mortality in the middle-aged and elderly population. In particular, in males of 35–54
and 75+ age groups and females of ages between 35 and 54. That urban living is associated with
higher suicide rates has been a reported feature in many countries except China (Qin, 2005).
That said, specific studies exploring the effects of urbanicity on suicide may neglect to adjust
risk estimates for possible confounding factors such as marital status, income, and psychiatric
illness. These are different in rural and urban areas and strongly influence suicide rates (Qin,
2005). By contrast, urban population is a negative predictor of suicidality in young females
(i.e. in the 15–24 age group). For young females such urban settings potentially afford greater
opportunities for independent living (even in more patriarchal societies) and greater economic
Having found evidence of an
N-shaped Suicidal Kuznets curve in the aforementioned age
groups and genders, we go one step further by calculating the turning points, i.e. the peak and
trough of per capita income associated with the
N-shaped curve as follows
φ
1
=
−
β
ˆ
2
−
q
ˆ
β
2
2
−
3 ˆ
β
1
β
ˆ
3
3 ˆ
β
3
(2)
and
φ
2
=
−
β
ˆ
2
+
q
ˆ
β
2
2
−
3 ˆ
β
1
β
ˆ
3
3 ˆ
β
3
(3)
where ˆ
β
i
, with
i
=1,2 and 3, correspond to the coefficients of log of per capita income, its square
and its cubic counterparts, respectively obtained from model (1).
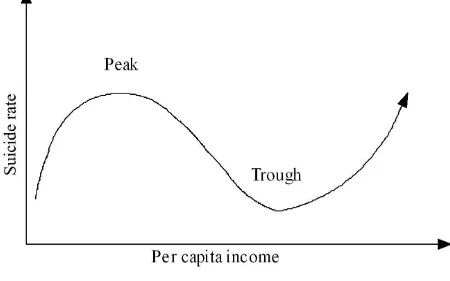
A graphical representation of an
N
-shaped Suicidal Kuznets curve in the context of suicide
mortality is given in Figure 7. As discussed, the
N
-shaped curve indicates that suicide mortality
first increases with income per capita, but decreases after a certain level. This is how a peak is
formed. Along with further increase in income per capita, suicide mortality tends to rise again,
which provides a trough in the
N
-shaped Suicidal Kuznets curve.
[Insert Figure 7 around here]
The specific results of the peaks and troughs, i.e. the turning points of per capita income, of
suicide mortality, which are calculated only when each of the
β
i
, where
i
=1,2 and 3, coefficients
are significant at least at the 10% level of significance in Tables 2-4, are presented in Table
5. According to these results, the turning points of per capita income for the male population
of 25–34, 34–54 and 55–74 age groups are $7,727 and $6,306, $5,266 and $22,726, and $3,459
and $53,260, respectively, while for the female population of 55–74 age groups are $4,022 and
$43,351. On average and across both genders, as per capita income increases, suicide rates of
25–34 and 35–54 follow an increasing trend and peak when per capita income reaches $7,304 and
$6,498, respectively, then follow a declining trend until $60,819 and $25,129, respectively, and
increase thereafter again. These empirical results confirm an
N
-shaped suicidal Kuznets curve.
It appears that the race to increase income over time to escape poverty has negative mental
health spillover effects. Yet once poverty has been eradicated then for middle income countries,
further income rises are seemingly associated with positive mental health spillover effects. For
high income group countries, further income increases seem to be associated again with negative
of factors (compared to the low income countries) that account for these negative mental health
spillover effects. In the second upswing they may be more likely, for example, to be triggered by
work-life balance concerns, arduous commuting, peer group pressures and status anxieties that
echo elements of Duesenberry’s (1949) relative income hypothesis.
[Insert Table 5 around here]
Summing up, our results point to a significant finding in terms of ‘money’ and
wellbe-ing/happiness. Conventional wisdom suggest that money does not buy happiness. We, however,
find once poverty and the problems of very low income living have been addressed then money
does buy happiness (some insulation from mental health issues and suicide) up to a certain
point. Exceeding that point is where problems seem to begin.
Finally, the aforementioned results are very robust to various robustness checks presented in
the Online Appendix.
4
Conclusions
In this study, we investigated the existence (or lack thereof) of a suicidal Kuznets curve.
Con-trolling for several country-specific socioeconomic suicide determinants among 73 countries over
the period 1990-2010 we found evidence of an
N
-shaped suicidal Kuznets curve between per
capita income and suicide rates of the male population of 25-34, 34-54 and 55–74 age groups
and the female population of the 55-74 age group. The turning points of per capita income
for the male population of 25-34, 34-54 and 55–74 age groups are $7,727 and $46,306, $5,266
and $22,726, and $3,459 and $53,260, respectively, while for the female population of the 55-74
age group are $4,022 and $43,351. On average and across both genders, as per capita income
increases, suicide rates of 25–34 and 35–54 follow an increasing trend and peak when per capita
income reaches $7,304 and $6,498, respectively, then follow a declining trend until $60,819 and
$25,129, respectively, and increase thereafter again. These results remain robust to a battery of
robustness checks.
We provide some simple intuitive conjecture for this
N
-shaped relationship in terms of a
changing pattern of net negative and positive mental health spillovers at different income levels.
Specifically, we contend that striving to escape very low income and poverty is associated with
negative mental health spillover effects (specifically higher suicide rates). Once achieved, further
effects (lower suicide rates). Beyond this point (for high income countries), further income rises
are then associated with net negative mental health spillover effects as households confront
rela-tive income disparity concerns (Duesenberry, 1949), seemingly stark work-life balance concerns,
long commuting journeys and other phenomena associated with high pressured living in mature
industrialized economies.
The bulk of studies exploring the impact of economic growth (per capita income) on suicide
rates posit a simple inverse relationship after controlling for other socio-demographic factors.
While in no way claiming to completely reconcile the conflicting findings from some seemingly
dissenting studies that have also explored this relationship (Unnithan et al., 1994; Lester, 1996),
this study does at least go some way to help account for a degree of plurality in findings. It
does so with respect to an
N
-shaped relationship for 73 countries at different stages of economic
development. Potentially an even more global picture with a greater number of countries and
explicit treatment of in-country income inequality across all of them might help in providing
more nuanced identification of specific groupings of countries, such that they could more readily
benchmark the effectiveness of their national anti-suicide strategies with useful comparators. In
some cases (with the support of supra-national bodies such as the WHO) they may also more
readily be able to exploit the scope for pooling or sharing public health resources, including
specific community outreach communication materials targeted at particular age cohorts and
demographic groups.
The results may serve as evidence to prompt some countries in the face of declining suicide
rates to guard against complacency if increased economic prosperity is anticipated. Given the
N
-shaped form of the relationship there is a case for resisting very significant diminution of resources
devoted to encouraging mental health wellbeing and addressing suicidal behaviour. Replicatory
work on this sample and a wider sample of countries, however, remains warranted to affirm
the robustness of our findings but subsequent work might also explore more fully the
micro-foundations of this suicide-economic growth relationship, possibly enriched by household panel
data elements. Additionally it might also be possible to identify suicidal Kuznets curve properties
in some countries through regional variations in suicide rates and economic development. In
which case there is merit in regional development and planning becoming more fully aligned in
References
Akee, R. K. Q., Simeonova, E., Copeland, W., Angold, A., Costello, J. E., 2010.
Does More
Money Make You Fat? The Effects of Quasi-Experimental Income Transfers on Adolescent
and Young Adult Obesity
. IZA Discussion Papers 5135, Institute for the Study of Labor (IZA).
Altinanahtar, A., Halicioglu, F., 2009. A Dynamic Econometric Model of Suicides in Turkey.
Journal of Behavioral and Experimental Economics
38 (6), 903–907.
Andr´es, A. R., 2005. Income Inequality, Unemployment, and Suicide: A Panel Data Analysis of
15 European Countries.
Applied Economics
37 (4), 439–451.
Andr´es, A. R., Halicioglu, F., 2010. Determinants of Suicides in Denmark: Evidence from Time
Series Data.
Health Policy
98 (2-3), 263–269.
Andr´es, A. R., Halicioglu, F., Yamamura, E., 2011. Socio-economic Determinants of Suicide in
Japan.
Journal of Behavioral and Experimental Economics
40 (6), 723–731.
Antonakakis, N., Collins, A., 2014. The Impact of Fiscal Austerity on Suicide: On the Empirics
of a Modern Greek Tragedy.
Social Science & Medicine
112, 39–50.
Antonakakis, N., Collins, A., 2015. The Impact of Fiscal Austerity on Suicide Mortality:
Evi-dence Across the Eurozone ’Periphery’.
Social Science & Medicine
145, 63–78.
Arellano, M., Bover, O., 1995. Another Look at the Instrumental Variable Estimation of
Error-Components Models.
Journal of Econometrics
68 (1), 29–51.
Blundell, R., Bond, S., 1998. Initial Conditions and Moment Restrictions in Dynamic Panel
Data Models.
Journal of Econometrics
87 (1), 115–143.
Brainerd, E., 2001. Economic Reform and Mortality in the Former Soviet Union: A Study of
the Suicide Epidemic in the 1990s.
European Economic Review
45 (4–6), 1007–1019.
Chen, J., Choi, Y. J., Mori, K., Sawada, Y., Sugano, S., 2012. Socio-Economic Studies On
Suicide: A Survey.
Journal of Economic Surveys
26 (2), 271–306.
Chen, Y.-Y., Yip, P. S., Lee, C., Fan, H.-F., Fu, K.-W., 2010. Economic Fluctuations and Suicide:
Chuang, H.-L., Huang, W.-C., 1997. Economic and Social Correlates of Regional Suicide Rates:
A Pooled Cross-section and Time-series Analysis.
Journal of Behavioral and Experimental
Economics
26 (3), 277–289.
Chuang, H.-L., Huang, W.-C., 2007. A Re-Examination of the Suicide Rates in Taiwan.
Social
Indicators Research
83 (3), 465–485.
Cuellar, A. E., Markowitz, S., 2007. Medicaid Policy Changes in Mental Health Care and their
Effect on Mental Health Outcomes.
Health Economics, Policy and Law
2 (01), 23–49.
Dinda, S., 2004. Environmental Kuznets Curve Hypothesis: A Survey.
Ecological Economics
49 (4), 431–455.
Duesenberry, J. S., 1949.
Income, Saving and the Theory of Consumer Behaviour
. Cambridge,
MA: Harvard University Press.
Durkheim, E., 1897.
Le Suicide: ´
Etude de Sociologie
. Alcan, Paris. (Spaulding, J.A., Simpson,
G (Trans.), 1951. Suicide: A Study of Sociology). Free Press, New York.
Ginsberg, R. B., 1966. Anomie and aspiration.
Dissertation Abstracts
27A, 3945–3946.
Grecu, A. M., Rotthoff, K. W., 2015. Economic Growth and Obesity: Findings of an Obesity
Kuznets Curve.
Applied Economics Letters
22 (7), 539–543.
Hamermesh, D. S., Soss, N. M., 1974. An Economic Theory of Suicide.
Journal of Political
Economy
82 (1), 83–98.
Henry, A. F., Short, J. F., 1954.
Suicide and Homicide
. Free Press, New York.
Huijts, T., Reeves, A., McKee, M., Stuckler, D., 2015. The Impacts of Job Loss and Job
Re-covery on Self-rated Health: Testing the Mediating Role of Financial Strain and Income.
The
European Journal of Public Health
25 (5), 801–806.
Jungeilges, J., Kirchgassner, G., 2002. Economic Welfare, Civil Liberty, and Suicide: An
Em-pirical Investigation.
Journal of Socio-Economics
31 (3), 215–231.
Koo, J., Cox, W. M., 2008. An Economic Interpretation Of Suicide Cycles In Japan.
Contem-porary Economic Policy
26 (1), 162–174.
Kposowa, A. J., 2003. Research on Unemployment and Suicide.
Journal of Epidemiology and
Kunce, M., Anderson, A. L., 2002. The Impact of Socioeconomic Factors on State Suicide Rates:
A Methodological Note.
Urban Studies
39 (1), 155–162.
Kuroki, M., 2010. Suicide and Unemployment in Japan: Evidence from Municipal Level Suicide
Rates and Age-specific Suicide Rates.
Journal of Socio–Economics
39 (6), 683–691.
Kuznets, S., 1955. Economic Growth and Income Inequality.
American Economic Review
45,
1–28.
Lester, D., 1996.
Patterns of Suicide and Homicide in the World
. Nova Science Publishers, New
York.
Minoiu, C., Andres, A. R., 2008. The Effect of Public Spending on Suicide: Evidence from U.S.
State Data.
Journal of Socio–Economics
37 (1), 237–261.
Nahman, A., Antrobus, G., 2005. The Environmental Kuznets Curve: A Literature Survey.
South African Journal of Economics
73 (1), 105–120.
Neumayer, E., 2003a. Are Socioeconomic Factors Valid Determinants of Suicide? Controlling for
National Cultures of Suicide with Fixed-Effects Estimation.
Cross-Cultural Research
37 (3),
307–329.
Neumayer, E., 2003b. Socioeconomic Factors and Suicide Rates at Large-unit Aggregate Levels:
A Comment.
Urban Studies
40 (13), 2769–2776.
Nickell, S. J., 1981. Biases in Dynamic Models with Fixed Effects.
Econometrica
49 (6), 1417–
1426.
Okada, K., Samreth, S., 2013. A study on the Socio-economic Determinants of Suicide:
Evi-dence from 13 European OECD Countries.
Journal of Behavioral and Experimental Economics
45 (C), 78–85.
Preti, A., 2003. Unemployment and Suicide.
Journal of Epidemiology and Community Health
57 (8), 557–558.
Qin, P., 2005. Suicide Risk in Relation to Level of Urbanicity A Population-based Linkage Study.
Qin, P., Agerbo, E., Mortensen, P., 2010. Suicide Risk in Relation to Socioeconomic,
Demo-graphic, Psychiatric, and Familial Factors: A National Register Based Study of all Suicides
in Denmark.
American Journal of Psychiatry
160, 765–772.
Roodman, D., 2009. How to Do xtabond2: An Introduction to Difference and System GMM in
Stata.
Stata Journal
9 (1), 86–136.
Ruhm, C. J., 2000. Are Recessions Good for Your Health?
The Quarterly Journal of Economics
115 (2), 617–650.
Stern, D. I., 2004. The Rise and Fall of the Environmental Kuznets Curve.
World Development
32 (8), 1419–1439.
Unnithan, N. P., Huff-Corzine, L., Corzine, J., Whitt, H. P., 1994.
The Currents of Lethal
Violence: An Integrated Model of Suicide and Homicide
). State University of New York Press,
Albany.
Vir´en, M., 1999. Testing the “Natural Rate of Suicide” Hypothesis.
International Journal of
Social Economics
26 (12), 1428–1440.
Viren, M., 2005. Suicide and Business Cycles: New Empirical Evidence.
Applied Economics
Letters
12 (14), 887–891.
WHO, 2015. Suicide: Fact Sheet Number 398, World Health Organization.
URL
http://www.who.int/mediacentre/factsheets/fs398/en/
Windmeijer, F., 2005. A Finite Sample Correction for the Variance of Linear Efficient Two-step
GMM Estimators.
Journal of Econometrics
126 (1), 25–51.
Yamamura, E., 2010. The Different Impacts of Socio-economic Factors on Suicide between Males
Figure 1: Scatter plot between suicide rates (per 100,000 inhabitants) of all ages and log of real
GDP per capita (1990-2010 averages)
ARG ARG ARG ARG ARG ARG ARG ARG ARG ARG ARG ARG ARG ARG ARG ARG ARG ARG ARG ARG ARG ARG ARG ARG ARG ARG ARG ARG ARM ARM ARM ARM ARM ARM ARM ARM ARM ARM ARM ARM ARM ARM ARM ARM ARM ARM ARM ARM ARM ARM ARM ARM ARM ARM ARM ARM AUS AUS AUS AUS AUS AUS AUS AUS AUS AUS AUS AUS AUS AUS AUS AUS AUS AUS AUS AUS AUS AUS AUS AUS AUS AUS AUS AUS AUT AUT AUT AUT AUT AUT AUT AUT AUT AUT AUT AUT AUT AUT AUT AUT AUT AUT AUT AUT AUT AUT AUT AUT AUT AUT AUT AUT BLR BLR BLR BLR BLR BLR BLR BLR BLR BLR BLR BLR BLR BLR BLR BLR BLR BLR BLR BLR BLR BLR BLR BLR BLR BLR BLR BLR BEL BEL BEL BEL BEL BEL BEL BEL BEL BEL BEL BEL BEL BEL BEL BEL BEL BEL BEL BEL BEL BEL BEL BEL BEL BEL BEL BEL BLZ BLZ BLZ BLZ BLZ BLZ BLZ BLZ BLZ BLZ BLZ BLZ BLZ BLZ BLZ BLZ BLZ BLZ BLZ BLZ BLZ BLZ BLZ BLZ BLZ BLZ BLZ BLZ BRABRABRABRABRABRABRABRABRABRABRABRABRABRABRABRABRABRABRABRABRABRABRABRABRABRABRABRA
BGR BGR BGR BGR BGR BGR BGR BGR BGR BGR BGR BGR BGR BGR BGR BGR BGR BGR BGR BGR BGR BGR BGR BGR BGR BGR BGR BGR CAN CAN CAN CAN CAN CAN CAN CAN CAN CAN CAN CAN CAN CAN CAN CAN CAN CAN CAN CAN CAN CAN CAN CAN CAN CAN CAN CAN CHL CHL CHL CHL CHL CHL CHL CHL CHL CHL CHL CHL CHL CHL CHL CHL CHL CHL CHL CHL CHL CHL CHL CHL CHL CHL CHL CHL COL COL COL COL COL COL COL COL COL COL COL COL COL COL COL COL COL COL COL COL COL COL COL COL COL COL COL COLCRICRICRICRICRICRICRICRICRICRICRICRICRICRICRICRICRICRICRICRICRICRICRICRICRICRICRICRI
HRV HRV HRV HRV HRV HRV HRV HRV HRV HRV HRV HRV HRV HRV HRV HRV HRV HRV HRV HRV HRV HRV HRV HRV HRV HRV HRV HRV CUB CUB CUB CUB CUB CUB CUB CUB CUB CUB CUB CUB CUB CUB CUB CUB CUB CUB CUB CUB CUB CUB CUB CUB CUB CUB CUB CUB CZECZECZECZECZECZECZECZECZECZECZECZECZECZECZECZECZECZECZECZECZECZECZECZECZECZECZECZE
DNK DNK DNK DNK DNK DNK DNK DNK DNK DNK DNK DNK DNK DNK DNK DNK DNK DNK DNK DNK DNK DNK DNK DNK DNK DNK DNK DNK DOM DOM DOM DOM DOM DOM DOM DOM DOM DOM DOM DOM DOM DOM DOM DOM DOM DOM DOM DOM DOM DOM DOM DOM DOM DOM DOM DOM ECU ECU ECU ECU ECU ECU ECU ECU ECU ECU ECU ECU ECU ECU ECU ECU ECU ECU ECU ECU ECU ECU ECU ECU ECU ECU ECU ECU SLV SLV SLV SLV SLV SLV SLV SLV SLV SLV SLV SLV SLV SLV SLV SLV SLV SLV SLV SLV SLV SLV SLV SLV SLV SLV SLV SLV EST EST EST EST EST EST EST EST EST EST EST EST EST EST EST EST EST EST EST EST EST EST EST EST EST EST EST EST FIN FIN FIN FIN FIN FIN FIN FIN FIN FIN FIN FIN FIN FIN FIN FIN FIN FIN FIN FIN FIN FIN FIN FIN FIN FIN FIN FIN FRA FRA FRA FRA FRA FRA FRA FRA FRA FRA FRA FRA FRA FRA FRA FRA FRA FRA FRA FRA FRA FRA FRA FRA FRA FRA FRA FRA GEO GEO GEO GEO GEO GEO GEO GEO GEO GEO GEO GEO GEO GEO GEO GEO GEO GEO GEO GEO GEO GEO GEO GEO GEO GEO GEO GEO DEU DEU DEU DEU DEU DEU DEU DEU DEU DEU DEU DEU DEU DEU DEU DEU DEU DEU DEU DEU DEU DEU DEU DEU DEU DEU DEU DEU GRC GRC GRC GRC GRC GRC GRC GRC GRC GRC GRC GRC GRC GRC GRC GRC GRC GRC GRC GRC GRC GRC GRC GRC GRC GRC GRC GRC GTM GTM GTM GTM GTM GTM GTM GTM GTM GTM GTM GTM GTM GTM GTM GTM GTM GTM GTM GTM GTM GTM GTM GTM GTM GTM GTM GTM GUY GUY GUY GUY GUY GUY GUY GUY GUY GUY GUY GUY GUY GUY GUY GUY GUY GUY GUY GUY GUY GUY GUY GUY GUY GUY GUY GUY HKG HKG HKG HKG HKG HKG HKG HKG HKG HKG HKG HKG HKG HKG HKG HKG HKG HKG HKG HKG HKG HKG HKG HKG HKG HKG HKG HKG HUN HUN HUN HUN HUN HUN HUN HUN HUN HUN HUN HUN HUN HUN HUN HUN HUN HUN HUN HUN HUN HUN HUN HUN HUN HUN HUN HUN ISL ISL ISL ISL ISL ISL ISL ISL ISL ISL ISL ISL ISL ISL ISL ISL ISL ISL ISL ISL ISL ISL ISL ISL ISL ISL ISL ISL IRL IRL IRL IRL IRL IRL IRL IRL IRL IRL IRL IRL IRL IRL IRL IRL IRL IRL IRL IRL IRL IRL IRL IRL IRL IRL IRL IRL ISR ISR ISR ISR ISR ISR ISR ISR ISR ISR ISR ISR ISR ISR ISR ISR ISR ISR ISR ISR ISR ISR ISR ISR ISR ISR ISR ISR ITAITAITAITAITAITAITAITAITAITAITAITAITAITAITAITAITAITAITAITAITAITAITAITAITAITAITAITA JPN JPN JPN JPN JPN JPN JPN JPN JPN JPN JPN JPN JPN JPN JPN JPN JPN JPN JPN JPN JPN JPN JPN JPN JPN JPN JPN JPN KAZ KAZ KAZ KAZ KAZ KAZ KAZ KAZ KAZ KAZ KAZ KAZ KAZ KAZ KAZ KAZ KAZ KAZ KAZ KAZ KAZ KAZ KAZ KAZ KAZ KAZ KAZ KAZ KWT KWT KWT KWT KWT KWT KWT KWT KWT KWT KWT KWT KWT KWT KWT KWT KWT KWT KWT KWT KWT KWT KWT KWT KWT KWT KWT KWT KGZ KGZ KGZ KGZ KGZ KGZ KGZ KGZ KGZ KGZ KGZ KGZ KGZ KGZ KGZ KGZ KGZ KGZ KGZ KGZ KGZ KGZ KGZ KGZ KGZ KGZ KGZ KGZ LVA LVA LVA LVA LVA LVA LVA LVA LVA LVA LVA LVA LVA LVA LVA LVA LVA LVA LVA LVA LVA LVA LVA LVA LVA LVA LVA LVA LTU LTU LTU LTU LTU LTU LTU LTU LTU LTU LTU LTU LTU LTU LTU LTU LTU LTU LTU LTU LTU LTU LTU LTU LTU LTU LTU LTU LUX LUX LUX LUX LUX LUX LUX LUX LUX LUX LUX LUX LUX LUX LUX LUX LUX LUX LUX LUX LUX LUX LUX LUX LUX LUX LUX LUX MLT MLT MLT MLT MLT MLT MLT MLT MLT MLT MLT MLT MLT MLT MLT MLT MLT MLT MLT MLT MLT MLT MLT MLT MLT MLT MLT MLT MUS MUS MUS MUS MUS MUS MUS MUS MUS MUS MUS MUS MUS MUS MUS MUS MUS MUS MUS MUS MUS MUS MUS MUS MUS MUS MUS MUS MEX MEX MEX MEX MEX MEX MEX MEX MEX MEX MEX MEX MEX MEX MEX MEX MEX MEX MEX MEX MEX MEX MEX MEX MEX MEX MEX MEX NLD NLD NLD NLD NLD NLD NLD NLD NLD NLD NLD NLD NLD NLD NLD NLD NLD NLD NLD NLD NLD NLD NLD NLD NLD NLD NLD NLD NZL NZL NZL NZL NZL NZL NZL NZL NZL NZL NZL NZL NZL NZL NZL NZL NZL NZL NZL NZL NZL NZL NZL NZL NZL NZL NZL NZL NIC NIC NIC NIC NIC NIC NIC NIC NIC NIC NIC NIC NIC NIC NIC NIC NIC NIC NIC NIC NIC NIC NIC NIC NIC NIC NIC NIC NOR NOR NOR NOR NOR NOR NOR NOR NOR NOR NOR NOR NOR NOR NOR NOR NOR NOR NOR NOR NOR NOR NOR NOR NOR NOR NOR NOR PAN PAN PAN PAN PAN PAN PAN PAN PAN PAN PAN PAN PAN PAN PAN PAN PAN PAN PAN PAN PAN PAN PAN PAN PAN PAN PAN PAN PRY PRY PRY PRY PRY PRY PRY PRY PRY PRY PRY PRY PRY PRY PRY PRY PRY PRY PRY PRY PRY PRY PRY PRY PRY PRY PRY PRY PER PER PER PER PER PER PER PER PER PER PER PER PER PER PER PER PER PER PER PER PER PER PER PER PER PER PER PER POL POL POL POL POL POL POL POL POL POL POL POL POL POL POL POL POL POL POL POL POL POL POL POL POL POL POL POL PRT PRT PRT PRT PRT PRT PRT PRT PRT PRT PRT PRT PRT PRT PRT PRT PRT PRT PRT PRT PRT PRT PRT PRT PRT PRT PRT PRT PRIPRIPRIPRIPRIPRIPRIPRIPRIPRIPRIPRIPRIPRIPRIPRIPRIPRIPRIPRIPRIPRIPRIPRIPRIPRIPRIPRI KOR KOR KOR KOR KOR KOR KOR KOR KOR KOR KOR KOR KOR KOR KOR KOR KOR KOR KOR KOR KOR KOR KOR KOR KOR KOR KOR KOR MDA MDA MDA MDA MDA MDA MDA MDA MDA MDA MDA MDA MDA MDA MDA MDA MDA MDA MDA MDA MDA MDA MDA MDA MDA MDA MDA MDA ROM ROM ROM ROM ROM ROM ROM ROM ROM ROM ROM ROM ROM ROM ROM ROM ROM ROM ROM ROM ROM ROM ROM ROM ROM ROM ROM ROM RUS RUS RUS RUS RUS RUS RUS RUS RUS RUS RUS RUS RUS RUS RUS RUS RUS RUS RUS RUS RUS RUS RUS RUS RUS RUS RUS RUS SRB SRB SRB SRB SRB SRB SRB SRB SRB SRB SRB SRB SRB SRB SRB SRB SRB SRB SRB SRB SRB SRB SRB SRB SRB SRB SRB SRB SGP SGP SGP SGP SGP SGP SGP SGP SGP SGP SGP SGP SGP SGP SGP SGP SGP SGP SGP SGP SGP SGP SGP SGP SGP SGP SGP SGP SVK SVK SVK SVK SVK SVK SVK SVK SVK SVK SVK SVK SVK SVK SVK SVK SVK SVK SVK SVK SVK SVK SVK SVK SVK SVK SVK SVK SVN SVN SVN SVN SVN SVN SVN SVN SVN SVN SVN SVN SVN SVN SVN SVN SVN SVN SVN SVN SVN SVN SVN SVN SVN SVN SVN SVN ZAF ZAF ZAF ZAF ZAF ZAF ZAF ZAF ZAF ZAF ZAF ZAF ZAF ZAF ZAF ZAF ZAF ZAF ZAF ZAF ZAF ZAF ZAF ZAF ZAF ZAF ZAF ZAF ESP ESP ESP ESP ESP ESP ESP ESP ESP ESP ESP ESP ESP ESP ESP ESP ESP ESP ESP ESP ESP ESP ESP ESP ESP ESP ESP ESP SUR SUR SUR SUR SUR SUR SUR SUR SUR SUR SUR SUR SUR SUR SUR SUR SUR SUR SUR SUR SUR SUR SUR SUR SUR SUR SUR
SUR SWESWESWESWESWESWESWESWESWESWESWESWESWESWESWESWESWESWESWESWESWESWESWESWESWESWESWESWE CHE CHE CHE CHE CHE CHE CHE CHE CHE CHE CHE CHE CHE CHE CHE CHE CHE CHE CHE CHE CHE CHE CHE CHE CHE CHE CHE CHE MKD MKD MKD MKD MKD MKD MKD MKD MKD MKD MKD MKD MKD MKD MKD MKD MKD MKD MKD MKD MKD MKD MKD MKD MKD MKD MKD MKD UKR UKR UKR UKR UKR UKR UKR UKR UKR UKR UKR UKR UKR UKR UKR UKR UKR UKR UKR UKR UKR UKR UKR UKR UKR UKR UKR UKR GBR GBR GBR GBR GBR GBR GBR GBR GBR GBR GBR GBR GBR GBR GBR GBR GBR GBR GBR GBR GBR GBR GBR GBR GBR GBR GBR GBR USA USA USA USA USA USA USA USA USA USA USA USA USA USA USA USA USA USA USA USA USA USA USA USA USA USA USA USA URY URY URY URY URY URY URY URY URY URY URY URY URY URY URY URY URY URY URY URY URY URY URY URY URY URY URY URY VEN VEN VEN VEN VEN VEN VEN VEN VEN VEN VEN VEN VEN VEN VEN VEN VEN VEN VEN VEN VEN VEN VEN VEN VEN VEN VEN VEN
0
10
20
30
40
Su
ici
de
R
at
e,
O
ve
ra
ll
8
9
10
11
12
Log Real GDP Per Capita
ARG ARG ARG ARG ARG ARG ARG ARG ARG ARG ARG ARG ARG ARG ARG ARG ARG ARG ARG ARG ARG ARG ARG ARG ARG ARG ARG ARG ARM ARM ARM ARM ARM ARM ARM ARM ARM ARM ARM ARM ARM ARM ARM ARM ARM ARM ARM ARM ARM ARM ARM ARM ARM ARM ARM ARM AUS AUS AUS AUS AUS AUS AUS AUS AUS AUS AUS AUS AUS AUS AUS AUS AUS AUS AUS AUS AUS AUS AUS AUS AUS AUS AUS AUS AUT AUT AUT AUT AUT AUT AUT AUT AUT AUT AUT AUT AUT AUT AUT AUT AUT AUT AUT AUT AUT AUT AUT AUT AUT AUT AUT AUT BLR BLR BLR BLR BLR BLR BLR BLR BLR BLR BLR BLR BLR BLR BLR BLR BLR BLR BLR BLR BLR BLR BLR BLR BLR BLR BLR BLR BEL BEL BEL BEL BEL BEL BEL BEL BEL BEL BEL BEL BEL BEL BEL BEL BEL BEL BEL BEL BEL BEL BEL BEL BEL BEL BEL BEL BLZ BLZ BLZ BLZ BLZ BLZ BLZ BLZ BLZ BLZ BLZ BLZ BLZ BLZ BLZ BLZ BLZ BLZ BLZ BLZ BLZ BLZ BLZ BLZ BLZ BLZ BLZ BLZ BRABRABRABRABRABRABRABRABRABRABRABRABRABRABRABRABRABRABRABRABRABRABRABRABRABRABRABRA
BGR BGR BGR BGR BGR BGR BGR BGR BGR BGR BGR BGR BGR BGR BGR BGR BGR BGR BGR BGR BGR BGR BGR BGR BGR BGR BGR BGR CAN CAN CAN CAN CAN CAN CAN CAN CAN CAN CAN CAN CAN CAN CAN CAN CAN CAN CAN CAN CAN CAN CAN CAN CAN CAN CAN CAN CHL CHL CHL CHL CHL CHL CHL CHL CHL CHL CHL CHL CHL CHL CHL CHL CHL CHL CHL CHL CHL CHL CHL CHL CHL CHL CHL CHL COL COL COL COL COL COL COL COL COL COL COL COL COL COL COL COL COL COL COL COL COL COL COL COL COL COL COL COLCRICRICRICRICRICRICRICRICRICRICRICRICRICRICRICRICRICRICRICRICRICRICRICRICRICRICRICRI
HRV HRV HRV HRV HRV HRV HRV HRV HRV HRV HRV HRV HRV HRV HRV HRV HRV HRV HRV HRV HRV HRV HRV HRV HRV HRV HRV HRV CUB CUB CUB CUB CUB CUB CUB CUB CUB CUB CUB CUB CUB CUB CUB CUB CUB CUB CUB CUB CUB CUB CUB CUB CUB CUB CUB CUB CZECZECZECZECZECZECZECZECZECZECZECZECZECZECZECZECZECZECZECZECZECZECZECZECZECZECZECZE
DNK DNK DNK DNK DNK DNK DNK DNK DNK DNK DNK DNK DNK DNK DNK DNK DNK DNK DNK DNK DNK DNK DNK DNK DNK DNK DNK DNK DOM DOM DOM DOM DOM DOM DOM DOM DOM DOM DOM DOM DOM DOM DOM DOM DOM DOM DOM DOM DOM DOM DOM DOM DOM DOM DOM DOMECUECUECUECUECUECUECUECUECUECUECUECUECUECUECUECUECUECUECUECUECUECUECUECUECUECUECUECU SLV SLV SLV SLV SLV SLV SLV SLV SLV SLV SLV SLV SLV SLV SLV SLV SLV SLV SLV SLV SLV SLV SLV SLV SLV SLV SLV SLV EST EST EST EST EST EST EST EST EST EST EST EST EST EST EST EST EST EST EST EST EST EST EST EST EST EST EST EST FIN FIN FIN FIN FIN FIN FIN FIN FIN FIN FIN FIN FIN FIN FIN FIN FIN FIN FIN FIN FIN FIN FIN FIN FIN FIN FIN FIN FRA FRA FRA FRA FRA FRA FRA FRA FRA FRA FRA FRA FRA FRA FRA FRA FRA FRA FRA FRA FRA FRA FRA FRA FRA FRA FRA FRA GEO GEO GEO GEO GEO GEO GEO GEO GEO GEO GEO GEO GEO GEO GEO GEO GEO GEO GEO GEO GEO GEO GEO GEO GEO GEO GEO GEO DEU DEU DEU DEU DEU DEU DEU DEU DEU DEU DEU DEU DEU DEU DEU DEU DEU DEU DEU DEU DEU DEU DEU DEU DEU DEU DEU DEU GRC GRC GRC GRC GRC GRC GRC GRC GRC GRC GRC GRC GRC GRC GRC GRC GRC GRC GRC GRC GRC GRC GRC GRC GRC GRC GRC GRC GTM GTM GTM GTM GTM GTM GTM GTM GTM GTM GTM GTM GTM GTM GTM GTM GTM GTM GTM GTM GTM GTM GTM GTM GTM GTM GTM GTM GUY GUY GUY GUY GUY GUY GUY GUY GUY GUY GUY GUY GUY GUY GUY GUY GUY GUY GUY GUY GUY GUY GUY GUY GUY GUY GUY GUY HKG HKG HKG HKG HKG HKG HKG HKG HKG HKG HKG HKG HKG HKG HKG HKG HKG HKG HKG HKG HKG HKG HKG HKG HKG HKG HKG HKG HUN HUN HUN HUN HUN HUN HUN HUN HUN HUN HUN HUN HUN HUN HUN HUN HUN HUN HUN HUN HUN HUN HUN HUN HUN HUN HUN HUN ISL ISL ISL ISL ISL ISL ISL ISL ISL ISL ISL ISL ISL ISL ISL ISL ISL ISL ISL ISL ISL ISL ISL ISL ISL ISL ISL ISLIRLIRLIRLIRLIRLIRLIRLIRLIRLIRLIRLIRLIRLIRLIRLIRLIRLIRLIRLIRLIRLIRLIRLIRLIRLIRLIRLIRL ISR ISR ISR ISR ISR ISR ISR ISR ISR ISR ISR ISR ISR ISR ISR ISR ISR ISR ISR ISR ISR ISR ISR ISR ISR ISR ISR ISR ITAITAITAITAITAITAITAITAITAITAITAITAITAITAITAITAITAITAITAITAITAITAITAITAITAITAITAITA JPN JPN JPN JPN JPN JPN JPN JPN JPN JPN JPN JPN JPN JPN JPN JPN JPN JPN JPN JPN JPN JPN JPN JPN JPN JPN JPN JPN KAZ KAZ KAZ KAZ KAZ KAZ KAZ KAZ KAZ KAZ KAZ KAZ KAZ KAZ KAZ KAZ KAZ KAZ KAZ KAZ KAZ KAZ KAZ KAZ KAZ KAZ KAZ KAZ KWT KWT KWT KWT KWT KWT KWT KWT KWT KWT KWT KWT KWT KWT KWT KWT KWT KWT KWT KWT KWT KWT KWT KWT KWT KWT KWT KWT KGZ KGZ KGZ KGZ KGZ KGZ KGZ KGZ KGZ KGZ KGZ KGZ KGZ KGZ KGZ KGZ KGZ KGZ KGZ KGZ KGZ KGZ KGZ KGZ KGZ KGZ KGZ KGZ LVA LVA LVA LVA LVA LVA LVA LVA LVA LVA LVA LVA LVA LVA LVA LVA LVA LVA LVA LVA LVA LVA LVA LVA LVA LVA LVA LVA LTU LTU LTU LTU LTU LTU LTU LTU LTU LTU LTU LTU LTU LTU LTU LTU LTU LTU LTU LTU LTU LTU LTU LTU LTU LTU LTU LTU LUX LUX LUX LUX LUX LUX LUX LUX LUX LUX LUX LUX LUX LUX LUX LUX LUX LUX LUX LUX LUX LUX LUX LUX LUX LUX LUX LUX MLT MLT MLT MLT MLT MLT MLT MLT MLT MLT MLT MLT MLT MLT MLT MLT MLT MLT MLT MLT MLT MLT MLT MLT MLT MLT MLT MLT MUS MUS MUS MUS MUS MUS MUS MUS MUS MUS MUS MUS MUS MUS MUS MUS MUS MUS MUS MUS MUS MUS MUS MUS MUS MUS MUS MUS MEX MEX MEX MEX MEX MEX MEX MEX MEX MEX MEX MEX MEX MEX MEX MEX MEX MEX MEX MEX MEX MEX MEX MEX MEX MEX MEX MEX NLD NLD NLD NLD NLD NLD NLD NLD NLD NLD NLD NLD NLD NLD NLD NLD NLD NLD NLD NLD NLD NLD NLD NLD NLD NLD NLD NLD NZL NZL NZL NZL NZL NZL NZL NZL NZL NZL NZL NZL NZL NZL NZL NZL NZL NZL NZL NZL NZL NZL NZL NZL NZL NZL NZL NZL NIC NIC NIC NIC NIC NIC NIC NIC NIC NIC NIC NIC NIC NIC NIC NIC NIC NIC NIC NIC NIC NIC NIC NIC NIC NIC NIC NIC NOR NOR NOR NOR NOR NOR NOR NOR NOR NOR NOR NOR NOR NOR NOR NOR NOR NOR NOR NOR NOR NOR NOR NOR NOR NOR NOR NOR PAN PAN PAN PAN PAN PAN PAN PAN PAN PAN PAN PAN PAN PAN PAN PAN PAN PAN PAN PAN PAN PAN PAN PAN PAN PAN PAN PAN PRY PRY PRY PRY PRY PRY PRY PRY PRY PRY PRY PRY PRY PRY PRY PRY PRY PRY PRY PRY PRY PRY PRY PRY PRY PRY PRY PRYPERPERPERPERPERPERPERPERPERPERPERPERPERPERPERPERPERPERPERPERPERPERPERPERPERPERPERPER
POL POL POL POL POL POL POL POL POL POL POL POL POL POL POL POL POL POL POL POL POL POL POL POL POL POL POL POL PRT PRT PRT PRT PRT PRT PRT PRT PRT PRT PRT PRT PRT PRT PRT PRT PRT PRT PRT PRT PRT PRT PRT PRT PRT PRT PRT PRT PRIPRIPRIPRIPRIPRIPRIPRIPRIPRIPRIPRIPRIPRIPRIPRIPRIPRIPRIPRIPRIPRIPRIPRIPRIPRIPRIPRI KOR KOR KOR KOR KOR KOR KOR KOR KOR KOR KOR KOR KOR KOR KOR KOR KOR KOR KOR KOR KOR KOR KOR KOR KOR KOR KOR KOR MDA MDA MDA MDA MDA MDA MDA MDA MDA MDA MDA MDA MDA MDA MDA MDA MDA MDA MDA MDA MDA MDA MDA MDA MDA MDA MDA MDA ROM ROM ROM ROM ROM ROM ROM ROM ROM ROM ROM ROM ROM ROM ROM ROM ROM ROM ROM ROM ROM ROM ROM ROM ROM ROM ROM ROM RUS RUS RUS RUS RUS RUS RUS RUS RUS RUS RUS RUS RUS RUS RUS RUS RUS RUS RUS RUS RUS RUS RUS RUS RUS RUS RUS RUS SRB SRB SRB SRB SRB SRB SRB SRB SRB SRB SRB SRB SRB SRB SRB SRB SRB SRB SRB SRB SRB SRB SRB SRB SRB SRB SRB SRB SGP SGP SGP SGP SGP SGP SGP SGP SGP SGP SGP SGP SGP SGP SGP SGP SGP SGP SGP SGP SGP SGP SGP SGP SGP SGP SGP SGP SVK SVK SVK SVK SVK SVK SVK SVK SVK SVK SVK SVK SVK SVK SVK SVK SVK SVK SVK SVK SVK SVK SVK SVK SVK SVK SVK SVK SVN SVN SVN SVN SVN SVN SVN SVN SVN SVN SVN SVN SVN SVN SVN SVN SVN SVN SVN SVN SVN SVN SVN SVN SVN SVN SVN SVN ZAF ZAF ZAF ZAF ZAF ZAF ZAF ZAF ZAF ZAF ZAF ZAF ZAF ZAF ZAF ZAF ZAF ZAF ZAF ZAF ZAF ZAF ZAF ZAF ZAF ZAF ZAF ZAF ESP ESP ESP ESP ESP ESP ESP ESP ESP ESP ESP ESP ESP ESP ESP ESP ESP ESP ESP ESP ESP ESP ESP ESP ESP ESP ESP ESP SUR SUR SUR SUR SUR SUR SUR SUR SUR SUR SUR SUR SUR SUR SUR SUR SUR SUR SUR SUR SUR SUR SUR SUR SUR SUR SUR
SUR SWESWESWESWESWESWESWESWESWESWESWESWESWESWESWESWESWESWESWESWESWESWESWESWESWESWESWESWE CHE CHE CHE CHE CHE CHE CHE CHE CHE CHE CHE CHE CHE CHE CHE CHE CHE CHE CHE CHE CHE CHE CHE CHE CHE CHE CHE CHE MKD MKD MKD MKD MKD MKD MKD MKD MKD MKD MKD MKD MKD MKD MKD MKD MKD MKD MKD MKD MKD MKD MKD MKD MKD MKD MKD MKD UKR UKR UKR UKR UKR UKR UKR UKR UKR UKR UKR UKR UKR UKR UKR UKR UKR UKR UKR UKR UKR UKR UKR UKR UKR UKR UKR UKR GBR GBR GBR GBR GBR GBR GBR GBR GBR GBR GBR GBR GBR GBR GBR GBR GBR GBR GBR GBR GBR GBR GBR GBR GBR GBR GBR GBR USA USA USA USA USA USA USA USA USA USA USA USA USA USA USA USA USA USA USA USA USA USA USA USA USA USA USA USA URY URY URY URY URY URY URY URY URY URY URY URY URY URY URY URY URY URY URY URY URY URY URY URY URY URY URY URY VEN VEN VEN VEN VEN VEN VEN VEN VEN VEN VEN VEN VEN VEN VEN VEN VEN VEN VEN VEN VEN VEN VEN VEN VEN VEN VEN VEN
0
20
40
60
80
Su
ic
id
e
R
at
e,
M
al
e
8
9
10
11
12
Log Real GDP Per Capita
ARG ARG ARG ARG ARG ARG ARG ARG ARG ARG ARG ARG ARG ARG ARG ARG ARG ARG ARG ARG ARG ARG ARG ARG ARG ARG ARG ARG ARM ARM ARM ARM ARM ARM ARM ARM ARM ARM ARM ARM ARM ARM ARM ARM ARM ARM ARM ARM ARM ARM ARM ARM ARM ARM ARM ARM AUS AUS AUS AUS AUS AUS AUS AUS AUS AUS AUS AUS AUS AUS AUS AUS AUS AUS AUS AUS AUS AUS AUS AUS AUS AUS AUS AUS AUT AUT AUT AUT AUT AUT AUT AUT AUT AUT AUT AUT AUT AUT AUT AUT AUT AUT AUT AUT AUT AUT AUT AUT AUT AUT AUT AUT BLR BLR BLR BLR BLR BLR BLR BLR BLR BLR BLR BLR BLR BLR BLR BLR BLR BLR BLR BLR BLR BLR BLR BLR BLR BLR BLR BLR BEL BEL BEL BEL BEL BEL BEL BEL BEL BEL BEL BEL BEL BEL BEL BEL BEL BEL BEL BEL BEL BEL BEL BEL BEL BEL BEL BEL BLZ BLZ BLZ BLZ BLZ BLZ BLZ BLZ BLZ BLZ BLZ BLZ BLZ BLZ BLZ BLZ BLZ BLZ BLZ BLZ BLZ BLZ BLZ BLZ BLZ BLZ BLZ BLZ BRABRABRABRABRABRABRABRABRABRABRABRABRABRABRABRABRABRABRABRABRABRABRABRABRABRABRABRA
BGR BGR BGR BGR BGR BGR BGR BGR BGR BGR BGR BGR BGR BGR BGR BGR BGR BGR BGR BGR BGR BGR BGR BGR BGR BGR BGR BGR CAN CAN CAN CAN CAN CAN CAN CAN CAN CAN CAN CAN CAN CAN CAN CAN CAN CAN CAN CAN CAN CAN CAN CAN CAN CAN CAN CAN CHL CHL CHL CHL CHL CHL CHL CHL CHL CHL CHL CHL CHL CHL CHL CHL CHL CHL CHL CHL CHL CHL CHL CHL CHL CHL CHL CHL COL COL COL COL COL COL COL COL COL COL COL COL COL COL COL COL COL COL COL COL COL COL COL COL COL COL COL COLCRICRICRICRICRICRICRICRICRICRICRICRICRICRICRICRICRICRICRICRICRICRICRICRICRICRICRICRI
HRV HRV HRV HRV HRV HRV HRV HRV HRV HRV HRV HRV HRV HRV HRV HRV HRV HRV HRV HRV HRV HRV HRV HRV HRV HRV HRV HRV CUB CUB CUB CUB CUB CUB CUB CUB CUB CUB CUB CUB CUB CUB CUB CUB CUB CUB CUB CUB CUB CUB CUB CUB CUB CUB CUB CUB CZE CZE CZE CZE CZE CZE CZE CZE CZE CZE CZE CZE CZE CZE CZE CZE CZE CZE CZE CZE CZE CZE CZE CZE CZE CZE CZE CZE DNKDNKDNKDNKDNKDNKDNKDNKDNKDNKDNKDNKDNKDNKDNKDNKDNKDNKDNKDNKDNKDNKDNKDNKDNKDNKDNKDNK
DOM DOM DOM DOM DOM DOM DOM DOM DOM DOM DOM DOM DOM DOM DOM DOM DOM DOM DOM DOM DOM DOM DOM DOM DOM DOM DOM DOM ECU ECU ECU ECU ECU ECU ECU ECU ECU ECU ECU ECU ECU ECU ECU ECU ECU ECU ECU ECU ECU ECU ECU ECU ECU ECU ECU ECU SLV SLV SLV SLV SLV SLV SLV SLV SLV SLV SLV SLV SLV SLV SLV SLV SLV SLV SLV SLV SLV SLV SLV SLV SLV SLV SLV SLV EST EST EST EST EST EST EST EST EST EST EST EST EST EST EST EST EST EST EST EST EST EST EST EST EST EST EST EST FIN FIN FIN FIN FIN FIN FIN FIN FIN FIN FIN FIN FIN FIN FIN FIN FIN FIN FIN FIN FIN FIN FIN FIN FIN FIN FIN FIN FRA FRA FRA FRA FRA FRA FRA FRA FRA FRA FRA FRA FRA FRA FRA FRA FRA FRA FRA FRA FRA FRA FRA FRA FRA FRA FRA FRA GEO GEO GEO GEO GEO GEO GEO GEO GEO GEO GEO GEO GEO GEO GEO GEO GEO GEO GEO GEO GEO GEO GEO GEO GEO GEO GEO GEO DEU DEU DEU DEU DEU DEU DEU DEU DEU DEU DEU DEU DEU DEU DEU DEU DEU DEU DEU DEU DEU DEU DEU DEU DEU DEU DEU DEU GRC GRC GRC GRC GRC GRC GRC GRC GRC GRC GRC GRC GRC GRC GRC GRC GRC GRC GRC GRC GRC GRC GRC GRC GRC GRC GRC GRC GTM GTM GTM GTM GTM GTM GTM GTM GTM GTM GTM GTM GTM GTM GTM GTM GTM GTM GTM GTM GTM GTM GTM GTM GTM GTM GTM GTM GUY GUY GUY GUY GUY GUY GUY GUY GUY GUY GUY GUY GUY GUY GUY GUY GUY GUY GUY GUY GUY GUY GUY GUY GUY GUY GUY GUY HKG HKG HKG HKG HKG HKG HKG HKG HKG HKG HKG HKG HKG HKG HKG HKG HKG HKG HKG HKG HKG HKG HKG HKG HKG HKG HKG HKG HUN HUN HUN HUN HUN HUN HUN HUN HUN HUN HUN HUN HUN HUN HUN HUN HUN HUN HUN HUN HUN HUN HUN HUN HUN HUN HUN HUN ISL ISL ISL ISL ISL ISL ISL ISL ISL ISL ISL ISL ISL ISL ISL ISL ISL ISL ISL ISL ISL ISL ISL ISL ISL ISL ISL ISL IRL IRL IRL IRL IRL IRL IRL IRL IRL IRL IRL IRL IRL IRL IRL IRL IRL IRL IRL IRL IRL IRL IRL IRL IRL IRL IRL IRL ISR ISR ISR ISR ISR ISR ISR ISR ISR ISR ISR ISR ISR ISR ISR ISR ISR ISR ISR ISR ISR ISR ISR ISR ISR ISR ISR ISR ITAITAITAITAITAITAITAITAITAITAITAITAITAITAITAITAITAITAITAITAITAITAITAITAITAITAITAITA JPN JPN JPN JPN JPN JPN JPN JPN JPN JPN JPN JPN JPN JPN JPN JPN JPN JPN JPN JPN JPN JPN JPN JPN JPN JPN JPN JPN KAZ KAZ KAZ KAZ KAZ KAZ KAZ KAZ KAZ KAZ KAZ KAZ KAZ KAZ KAZ KAZ KAZ KAZ KAZ KAZ KAZ KAZ KAZ KAZ KAZ KAZ KAZ KAZ KWT KWT KWT KWT KWT KWT KWT KWT KWT KWT KWT KWT KWT KWT KWT KWT KWT KWT KWT KWT KWT KWT KWT KWT KWT KWT KWT KWT KGZ KGZ KGZ KGZ KGZ KGZ KGZ KGZ KGZ KGZ KGZ KGZ KGZ KGZ KGZ KGZ KGZ KGZ KGZ KGZ KGZ KGZ KGZ KGZ KGZ KGZ KGZ KGZ LVA LVA LVA LVA LVA LVA LVA LVA LVA LVA LVA LVA LVA LVA LVA LVA LVA LVA LVA LVA LVA LVA LVA LVA LVA LVA LVA LVA LTU LTU LTU LTU LTU LTU LTU LTU LTU LTU LTU LTU LTU LTU LTU LTU LTU LTU LTU LTU LTU LTU LTU LTU LTU LTU LTU LTU LUX LUX LUX LUX LUX LUX LUX LUX LUX LUX LUX LUX LUX LUX LUX LUX LUX LUX LUX LUX LUX LUX LUX LUX LUX LUX LUX LUX MLT MLT MLT MLT MLT MLT MLT MLT MLT MLT MLT MLT MLT MLT MLT MLT MLT MLT MLT MLT MLT MLT MLT MLT MLT MLT MLT MLT MUS MUS MUS MUS MUS MUS MUS MUS MUS MUS MUS MUS MUS MUS MUS MUS MUS MUS MUS MUS MUS MUS MUS MUS MUS MUS MUS MUS MEX MEX MEX MEX MEX MEX MEX MEX MEX MEX MEX MEX MEX MEX MEX MEX MEX MEX MEX MEX MEX MEX MEX MEX MEX MEX MEX MEX NLD NLD NLD NLD NLD NLD NLD NLD NLD NLD NLD NLD NLD NLD NLD NLD NLD NLD NLD NLD NLD NLD NLD NLD NLD NLD NLD NLD NZL NZL NZL NZL NZL NZL NZL NZL NZL NZL NZL NZL NZL NZL NZL NZL NZL NZL NZL NZL NZL NZL NZL NZL NZL NZL NZL NZL NIC NIC NIC NIC NIC NIC NIC NIC NIC NIC NIC NIC NIC NIC NIC NIC NIC NIC NIC NIC NIC NIC NIC NIC NIC NIC NIC NIC NOR NOR NOR NOR NOR NOR NOR NOR NOR NOR NOR NOR NOR NOR NOR NOR NOR NOR NOR NOR NOR NOR NOR NOR NOR NOR NOR NOR PAN PAN PAN PAN PAN PAN PAN PAN PAN PAN PAN PAN PAN PAN PAN PAN PAN PAN PAN PAN PAN PAN PAN PAN PAN PAN PAN PAN PRY PRY PRY PRY PRY PRY PRY PRY PRY PRY PRY PRY PRY PRY PRY PRY PRY PRY PRY PRY PRY PRY PRY PRY PRY PRY PRY PRY PER PER PER PER PER PER PER PER PER PER PER PER PER PER PER PER PER PER PER PER PER PER PER PER PER PER PER PER POL POL POL POL POL POL POL POL POL POL POL POL POL POL POL POL POL POL POL POL POL POL POL POL POL POL POL POL PRTPRTPRTPRTPRTPRTPRTPRTPRTPRTPRTPRTPRTPRTPRTPRTPRTPRTPRTPRTPRTPRTPRTPRTPRTPRTPRTPRT
PRI PRI PRI PRI PRI PRI PRI PRI PRI PRI PRI PRI PRI PRI PRI PRI PRI PRI PRI PRI PRI PRI PRI PRI PRI PRI PRI PRI KOR KOR KOR KOR KOR KOR KOR KOR KOR KOR KOR KOR KOR KOR KOR KOR KOR KOR KOR KOR KOR KOR KOR KOR KOR KOR KOR KOR MDA MDA MDA MDA MDA MDA MDA MDA MDA MDA MDA MDA MDA MDA MDA MDA MDA MDA MDA MDA MDA MDA MDA MDA MDA MDA MDA MDA ROM ROM ROM ROM ROM ROM ROM ROM ROM ROM ROM ROM ROM ROM ROM ROM ROM ROM ROM ROM ROM ROM ROM ROM ROM ROM ROM ROM RUS RUS RUS RUS RUS RUS RUS RUS RUS RUS RUS RUS RUS RUS RUS RUS RUS RUS RUS RUS RUS RUS RUS RUS RUS RUS RUS RUS SRB SRB SRB SRB SRB SRB SRB SRB SRB SRB SRB SRB SRB SRB SRB SRB SRB SRB SRB SRB SRB SRB SRB SRB SRB SRB SRB SRB SGP SGP SGP SGP SGP SGP SGP SGP SGP SGP SGP SGP SGP SGP SGP SGP SGP SGP SGP SGP SGP SGP SGP SGP SGP SGP SGP SGP SVK SVK SVK SVK SVK SVK SVK SVK SVK SVK SVK SVK SVK SVK SVK SVK SVK SVK SVK SVK SVK SVK SVK SVK SVK SVK SVK SVK SVN SVN SVN SVN SVN SVN SVN SVN SVN SVN SVN SVN SVN SVN SVN SVN SVN SVN SVN SVN SVN SVN SVN SVN SVN SVN SVN SVN ZAF ZAF ZAF ZAF ZAF ZAF ZAF ZAF ZAF ZAF ZAF ZAF ZAF ZAF ZAF ZAF ZAF ZAF ZAF ZAF ZAF ZAF ZAF ZAF ZAF ZAF ZAF ZAF ESP ESP ESP ESP ESP ESP ESP ESP ESP ESP ESP ESP ESP ESP ESP ESP ESP ESP ESP ESP ESP ESP ESP ESP ESP ESP ESP ESP SUR SUR SUR SUR SUR SUR SUR SUR SUR SUR SUR SUR SUR SUR SUR SUR SUR SUR SUR SUR SUR SUR SUR SUR SUR SUR SUR
SUR SWESWESWESWESWESWESWESWESWESWESWESWESWESWESWESWESWESWESWESWESWESWESWESWESWESWESWESWE CHE CHE CHE CHE CHE CHE CHE CHE CHE CHE CHE CHE CHE CHE CHE CHE CHE CHE CHE CHE CHE CHE CHE CHE CHE CHE CHE CHE MKD MKD MKD MKD MKD MKD MKD MKD MKD MKD MKD MKD MKD MKD MKD MKD MKD MKD MKD MKD MKD MKD MKD MKD MKD MKD MKD MKD UKR UKR UKR UKR UKR UKR UKR UKR UKR UKR UKR UKR UKR UKR UKR UKR UKR UKR UKR UKR UKR UKR UKR UKR UKR UKR UKR UKR GBR GBR GBR GBR GBR GBR GBR GBR GBR GBR GBR GBR GBR GBR GBR GBR GBR GBR GBR GBR GBR GBR GBR GBR GBR GBR GBR GBR USA USA USA USA USA USA USA USA USA USA USA USA USA USA USA USA USA USA USA USA USA USA USA USA USA USA USA USA URY URY URY URY URY URY URY URY URY URY URY URY URY URY URY URY URY URY URY URY URY URY URY URY URY URY URY URY VEN VEN VEN VEN VEN VEN VEN VEN VEN VEN VEN VEN VEN VEN VEN VEN VEN VEN VEN VEN VEN VEN VEN VEN VEN VEN VEN VEN
0
5
10
15
Su
ic
id
e
R
at
e,
F
em
al
e
8
9
10
11
12
Log Real GDP Per Capita
Note: Solid line is the median spline.
Figure 2: Scatter plot between suicide rates (per 100,000 inhabitants) of 15-24 age group and
log of real GDP per capita (1990-2010 averages)
ARG ARG ARG ARG ARG ARG ARG ARG ARG ARG ARG ARG ARG ARG ARG ARG ARG ARG ARG ARG ARG ARG ARG ARG ARG ARG ARG ARG ARM ARM ARM ARM ARM ARM ARM ARM ARM ARM ARM ARM ARM ARM ARM ARM ARM ARM ARM ARM ARM ARM ARM ARM ARM ARM ARM ARM AUS AUS AUS AUS AUS AUS AUS AUS AUS AUS AUS AUS AUS AUS AUS AUS AUS AUS AUS AUS AUS AUS AUS AUS AUS AUS AUS AUSAUTAUTAUTAUTAUTAUTAUTAUTAUTAUTAUTAUTAUTAUTAUTAUTAUTAUTAUTAUTAUTAUTAUTAUTAUTAUTAUTAUT BLR BLR BLR BLR BLR BLR BLR BLR BLR BLR BLR BLR BLR BLR BLR BLR BLR BLR BLR BLR BLR BLR BLR BLR BLR BLR BLR BLR BEL BEL BEL BEL BEL BEL BEL BEL BEL BEL BEL BEL BEL BEL BEL BEL BEL BEL BEL BEL BEL BEL BEL BEL BEL BEL BEL BEL BLZ BLZ BLZ BLZ BLZ BLZ BLZ BLZ BLZ BLZ BLZ BLZ BLZ BLZ BLZ BLZ BLZ BLZ BLZ BLZ BLZ BLZ BLZ BLZ BLZ BLZ BLZ BLZ BRA BRA BRA BRA BRA BRA BRA BRA BRA BRA BRA BRA BRA BRA BRA BRA BRA BRA BRA BRA BRA BRA BRA BRA BRA BRA BRA BRA BGR BGR BGR BGR BGR BGR BGR BGR BGR BGR BGR BGR BGR BGR BGR BGR BGR BGR BGR BGR BGR BGR BGR BGR BGR BGR BGR BGR CAN CAN CAN CAN CAN CAN CAN CAN CAN CAN CAN CAN CAN CAN CAN CAN CAN CAN CAN CAN CAN CAN CAN CAN CAN CAN CAN CAN CHL CHL CHL CHL CHL CHL CHL CHL CHL CHL CHL CHL CHL CHL CHL CHL CHL CHL CHL CHL CHL CHL CHL CHL CHL CHL CHL CHL COL COL COL COL COL COL COL COL COL COL COL COL COL COL COL COL COL COL COL COL COL COL COL COL COL COL COL COLCRICRICRICRICRICRICRICRICRICRICRICRICRICRICRICRICRICRICRICRICRICRICRICRICRICRICRICRI
HRV HRV HRV HRV HRV HRV HRV HRV HRV HRV HRV HRV HRV HRV HRV HRV HRV HRV HRV HRV HRV HRV HRV HRV HRV HRV HRV HRV CUB CUB CUB CUB CUB CUB CUB CUB CUB CUB CUB CUB CUB CUB CUB CUB CUB CUB CUB CUB CUB CUB CUB CUB CUB CUB CUB CUB CZECZECZECZECZECZECZECZECZECZECZECZECZECZECZECZECZECZECZECZECZECZECZECZECZECZECZECZE
DNK DNK DNK DNK DNK DNK DNK DNK DNK DNK DNK DNK DNK DNK DNK DNK DNK DNK DNK DNK DNK DNK DNK DNK DNK DNK DNK DNK DOM DOM DOM DOM DOM DOM DOM DOM DOM DOM DOM DOM DOM DOM DOM DOM DOM DOM DOM DOM DOM DOM DOM DOM DOM DOM DOM DOM ECU ECU ECU ECU ECU ECU ECU ECU ECU ECU ECU ECU ECU ECU ECU ECU ECU ECU ECU ECU ECU ECU ECU ECU ECU ECU ECU ECU SLV SLV SLV SLV SLV SLV SLV SLV SLV SLV SLV SLV SLV SLV SLV SLV SLV SLV SLV SLV SLV SLV SLV SLV SLV SLV SLV SLV EST EST EST EST EST EST EST EST EST EST EST EST EST EST EST EST EST EST EST EST EST EST EST EST EST EST EST EST FIN FIN FIN FIN FIN FIN FIN FIN FIN FIN FIN FIN FIN FIN FIN FIN FIN FIN FIN FIN FIN FIN FIN FIN FIN FIN FIN FIN FRA FRA FRA FRA FRA FRA FRA FRA FRA FRA FRA FRA FRA FRA FRA FRA FRA FRA FRA FRA FRA FRA FRA FRA FRA FRA FRA FRA GEO GEO GEO GEO GEO GEO GEO GEO GEO GEO GEO GEO GEO GEO GEO GEO GEO GEO GEO GEO GEO GEO GEO GEO GEO GEO GEO GEO DEU DEU DEU DEU DEU DEU DEU DEU DEU DEU DEU DEU DEU DEU DEU DEU DEU DEU DEU DEU DEU DEU DEU DEU DEU DEU DEU DEU GRC GRC GRC GRC GRC GRC GRC GRC GRC GRC GRC GRC GRC GRC GRC GRC GRC GRC GRC GRC GRC GRC GRC GRC GRC GRC GRC GRC GTM GTM GTM GTM GTM GTM GTM GTM GTM GTM GTM GTM GTM GTM GTM GTM GTM GTM GTM GTM GTM GTM GTM GTM GTM GTM GTM GTM GUY GUY GUY GUY GUY GUY GUY GUY GUY GUY GUY GUY GUY GUY GUY GUY GUY GUY GUY GUY GUY GUY GUY GUY GUY GUY GUY GUY HKG HKG HKG HKG HKG HKG HKG HKG HKG HKG HKG HKG HKG HKG HKG HKG HKG HKG HKG HKG HKG HKG HKG HKG HKG HKG HKG HKG HUN HUN HUN HUN HUN HUN HUN HUN HUN HUN HUN HUN HUN HUN HUN HUN HUN HUN HUN HUN HUN HUN HUN HUN HUN HUN HUN HUN ISL ISL ISL ISL ISL ISL ISL ISL ISL ISL ISL ISL ISL ISL ISL ISL ISL ISL ISL ISL ISL ISL ISL ISL ISL ISL ISL ISL IRL IRL IRL IRL IRL IRL IRL IRL IRL IRL IRL IRL IRL IRL IRL IRL IRL IRL IRL IRL IRL IRL IRL IRL IRL IRL IRL IRL ISR ISR ISR ISR ISR ISR ISR ISR ISR ISR ISR ISR ISR ISR ISR ISR ISR ISR ISR ISR ISR ISR ISR ISR ISR ISR ISR ISR ITA ITA ITA ITA ITA ITA ITA ITA ITA ITA ITA ITA ITA ITA ITA ITA ITA ITA ITA ITA ITA ITA ITA ITA ITA ITA ITA ITA JPN JPN JPN JPN JPN JPN JPN JPN JPN JPN JPN JPN JPN JPN JPN JPN JPN JPN JPN JPN JPN JPN JPN JPN JPN JPN JPN JPN KAZ KAZ KAZ KAZ KAZ KAZ KAZ KAZ KAZ KAZ KAZ KAZ KAZ KAZ KAZ KAZ KAZ KAZ KAZ KAZ KAZ KAZ KAZ KAZ KAZ KAZ KAZ KAZ KWT KWT KWT KWT KWT KWT KWT KWT KWT KWT KWT KWT KWT KWT KWT KWT KWT KWT KWT KWT KWT KWT KWT KWT KWT KWT KWT KWT KGZ KGZ KGZ KGZ KGZ KGZ KGZ KGZ KGZ KGZ KGZ KGZ KGZ KGZ KGZ KGZ KGZ KGZ KGZ KGZ KGZ KGZ KGZ KGZ KGZ KGZ KGZ KGZ LVA LVA LVA LVA LVA LVA LVA LVA LVA LVA LVA LVA LVA LVA LVA LVA LVA LVA LVA LVA LVA LVA LVA LVA LVA LVA LVA LVA LTU LTU LTU LTU LTU LTU LTU LTU LTU LTU LTU LTU LTU LTU LTU LTU LTU LTU LTU LTU LTU LTU LTU LTU LTU LTU LTU LTU LUX LUX LUX LUX LUX LUX LUX LUX LUX LUX LUX LUX LUX LUX LUX LUX LUX LUX LUX LUX LUX LUX LUX LUX LUX LUX LUX LUX MLT MLT MLT MLT MLT MLT ML