A Comparative Study of Two Shear Deforming Processes in Texture Evolution
Jun-Hyun Han
1, Jin-Kook Yoon
1, Jong-Woo Park
1, Kyu Hwan Oh
2and Jae-Chul Lee
31Division of Materials Science & Engineering, Korea Institute of Science and Technology (KIST), Seoul 130-650, Korea
2School of Materials Science and Engineering, Seoul National University, Shinrim-dong 56-1, Kwanak-ku, Seoul 151-742, Korea
3
Division of Materials Science and Engineering, Korea University, Anam-dong Seoul 136-701, Korea
The effects of deformation history on the texture evolution in an aluminum alloy during two different shear deforming processes,i.e., equal channel angular pressing (ECAP) and dissimilar channel angular pressing (DCAP) were comparatively investigated. Simulation based on the Taylor model showed that the texture evolution during DCAP was very similar to that of ECAP up to the region, a so-called ‘zero dilatation line’. Beyond this line, the texture continued to evolve by rotating about the transverse direction (TD) by 10–15during ECAP, whereas the texture
hardly evolved during DCAP. These analytical observations were verified experimentally. (Received September 14, 2004; Accepted April 8, 2005; Published May 15, 2005)
Keywords: shear deforming process, equal channel angular pressing (ECAP), dissimilar channel angular pressing (DCAP), texture, deformation history, zero dilatation line
1. Introduction
Equal channel angular pressing (ECAP)1–6)has been used
as a process route not only for producing bulk materials with ultrafine grains, but also for controlling the crystallographic orientations of materials. Recently, a new ECAP-based process, termed dissimilar channel angular pressing (DCAP), was developed and found to be effective for controlling textures.7–11)
Since the texture evolution is very sensitive to the deformation history imposed to the material, the deformation histories resulted by ECAP and DCAP and their influence on the texture evolution are of special interest. Although the deformation behavior of ECAP has long been thought to be simple shear,1,12)a couple of recent studies10,13)have shown
that the deformation behavior during DCAP as well as ECAP is not the ideal (or perfect) simple shear deformation, but the complex mode of deformation consisting of compression, tension, and shear. Authors10)have demonstrated the effects
of the deformation history on the texture evolution during ECAP and DCAP using the general die configurations having the oblique angle () of 90 and 120, respectively. However, a more detailed analysis on the deformation behaviors during the two shear deforming processes within the deformation zone of the workpiece under the same die configuration is needed to elucidate how the texture evolves when the workpiece passes the shear deformations.
In the present study, the effects of the deformation history on the texture evolution in an aluminum alloy during ECAP and DCAP were investigated and their results were com-pared. Finite element analyses were performed within the deformation zone to analyze the effect of the deformation histories during the two shear deforming processes on the texture evolution. Texture simulations using the Taylor model were carried out to study the detailed texture evolutions during the two shear deforming processes, and the analytical results were verified with the experimental results.
2. Experimental Procedures
To simulate the deformation behaviors of workpieces during ECAP and DCAP, the commercial finite element analysis software ABAQUS was used. A two-dimensional problem was considered, since the processes satisfy the plane-strain condition. The material was regarded as elasto-perfectly plastic with a von Mises yield strength of 100 MPa.
The die having the oblique angle () of 120 and the
curvature angle () of 0 was assumed to be rigid and
frictionless. Other conditions used to calculate the deforma-tion process were identical to those used in the earlier study.14)As already reported by the authors,15)the calculated
results were accurate enough to represent the experimental results.
The full constraint Taylor analyses based on the rate sensitivity model16) were carried out to investigate the
detailed texture evolution sequences during ECAP and DCAP. The strain rate sensitivity of 0.05 was adopted since it is typical for aluminum at room temperature.17)The shear
strains imparted to the specimens were1.15)Other details, such as equations, solving procedures, etc., can be found elsewhere.16,17)
The deformation gradient,18)which was obtained from the actual deformation behavior, was converted to the velocity gradient,18) which later was used as the input data for the
texture analysis. The velocity gradient obtained from the deformation gradient contains two terms, which were con-tributed by the plastic rotation due to dislocation slip (i.e., the symmetric part of the velocity gradient) and the rigid body rotation during the shear deformation (i.e., the skewed part of the velocity gradient). As such, texture evolution based on the deformation history incorporates the plastic rotation and the rigid body rotation during the shear deformation. The texture evolution sequence corresponding to this actual deformation history was analyzed according to the Taylor model.
To trace how the individual grains are rotating under the actual deformations of ECAP and DCAP, 1000 crystallo-graphic orientations corresponding to the experimental results obtained from the annealed 1050 Al alloy were
generated before the analyses and utilized as an initial texture prior to ECAP and DCAP. To verify the analytical results, the texture evolutions due to DCAP were measured directly using both the X-ray diffratometry and the electron back scattered diffraction (EBSD).
3. Results and Discussion
3.1 Streamline coordinates
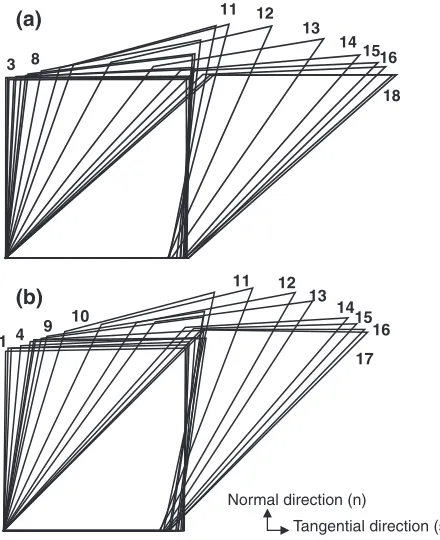
To investigate how the workpiece undergoes deformation during ECAP and DCAP, one arbitrary tracer element in the FEM model as in Fig. 1 was selected from the middle of the specimen thickness. The coordinates were given to the four nodal points of the selected element before the calculation and traced during the whole deformation processes.
The plane of intersection of the inlet and the outlet channel in ECAP is termed the shear plane. Many researchers19,20) assumed that, during ECAP, simple shear takes place along a direction parallel to this shear plane and has been used both to calculate and to interpret textures measured from extruded billets. In reality, however, the deformation during ECAP or DCAP takes pace within a so-called deformation zone21,22)
rather than the shear plane. That is, during ECAP or DCAP, materials are progressively sheared as they pass through the deformation zone. Therefore, the shear direction is not simply parallel to the shear plane of intersection of the die channels.13)As such, texture analyses, that are based on the
reference axis constructed on the die’s shear plane, are not considered to be appropriate.
In order to facilitate tracing the shape changes of the tracer element and avoid ambiguity in defining the reference axis for texture analyses, streamline coordinates (s;n) were employed, in which the two coordinates, i.e., ‘s’ and ‘n’, were defined as the directions tangential and normal to the
streamline, respectively. In this study, the coordinates of the nodal points assigned in the Cartesian coordinate (x;y) were first transformed to those in the streamline coordinates as shown in Fig. 1. That is, before calculating the deformation gradient in the streamline coordinate, we incorporated the angle between the reference lines of the tracers on the streamline side corresponding to n-step and (nþ1)-step calculations, followed by calculations of the deformation gradient, the velocity gradient, and the corresponding texture on the transformed streamline coordinate.
3.2 Deformation characteristics of ECAP and DCAP
Figure 2 is a series of deformation patterns of the tracer element, showing how the shape of the square element is evolving with the calculation time steps during ECAP and DCAP. To quantify the actual deformation behavior visual-ized in Fig. 2, four different deformation gradient compo-nents, i.e., Fss, Fnn, Fsn, and Fns where the subscript ‘ij’
denotes the direction component as defined in Fig. 2 and eq. (1), were adopted.
Fi j¼
@xi
@Xj
ð1Þ
whereXandxare the coordinates of the nodal points of the element before and after deformation, respectively. The deformation gradient matrices corresponding to every finite element steps were extracted from the ABAQUS results. The four deformation gradient components expressed by the coordinates of the nodal points in the Cartesian coordinate (x;y) were transformed to the streamline coordinates (s;n). Figures 3 and 4 are the variations in the transformed 16
15 14 13 12 11
8 2
8
2
14
12
11 13
16
Cartesian coordinate
Streamline coordinate y
x
n s
Fig. 1 Finite element calculations of ECAP showing how the shape of the tracer element is evolving with respect to different locations. ‘x’ and ‘y’ refer to two normal directions in the Cartesian coordinate system. ‘s’ and ‘n’ refer to the directions tangential and normal to the streamline, respectively, in the streamline coordinate system.
16
18 15 14 13 12 11
8 3
17 16 15 14 13 12 11
10 9 4 1
Normal direction (n)
Tangential direction (s) (a)
(b)
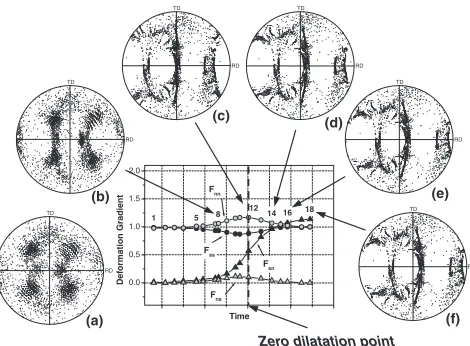
[image:2.595.314.534.74.344.2] [image:2.595.54.278.77.301.2]deformation gradient components calculated as a function of the time steps during ECAP and DCAP, respectively, and the {111} pole figures corresponding to each calculation step are superimposed.
The physical meaning of the each deformation gradient component can be explained in terms of elongation and rotation of fibers23)consisting the initial square grid. Changes
in the value of Fss, averaged s-direction component of
elongation of fibers initially directed to thes-direction, reflect the compression and tension of the grid along thes-direction during the deformation process, while changes inFsnreflect
averaged degree of rotation of fibers initially directed to the n-direction. Therefore, it is anticipated from the Figs. 3 and 4 that the texture evolutions process largely in the early stages (up to step 12 in Figs. 3 and 4) of the deformation, while,
show different features in the two processes (ECAP and DCAP) beyond this stage, which will be treated in detail in section 3.3.
As in Figs. 2(a) and 3, during the whole deformation process, i.e., from step 3 to step 18, a complex mode of deformation takes place in a continuous manner; from step 3 in Figs. 2(a) and 3, the element starts to experience both shear and compression along the tangential direction so that the height of the grid becomes elongated along the normal direction. Beyond step 12, changes in the deformation mode have occurred such that tension along the tangential direction takes place, resulting in the recovery of the grid height to the original value.
In the case of DCAP, the deformation behavior in the early stage (up to step 12 in Figs. 2(b) and 4) of the deformation is nearly identical to that exhibited by ECAP; that is, likewise in ECAP, both shear and compression are subjected to the workpiece along the tangential direction. However, beyond this stage, the grid height does not return to the original value due to the difference in thickness of inlet and outlet channel of the DCAP die,7) and, therefore, the final height of the
deformed grid is slightly higher than the initial one as seen in Figs. 2(b) and 4.
To analyze the deformation behavior in correlation with the deformation rate and to simulate the texture evolution sequence corresponding to the actual deformation history, the velocity gradients (L) as defined in eq. (2)18)were calculated from the relationship with the deformation gradient given by eq. (3).
L¼gradv¼ @v
@x ð2Þ
L¼FF_F1 ð3Þ
wherevis the velocity vector.18)The symmetric part of the
velocity gradientL(orD) is known as the deformation rate tensor or strain rate tensor.18) This tensor describes the
deformation rate at any material point and given by eq. (4). Therefore, once the deformation gradients as shown in Figs. 3 and 4 were determined, the velocity gradient (L) and the deformation rate (D) can be calculated using eqs. (3) and (4), respectively.
D¼1
2ðLþL
TÞ ð4Þ
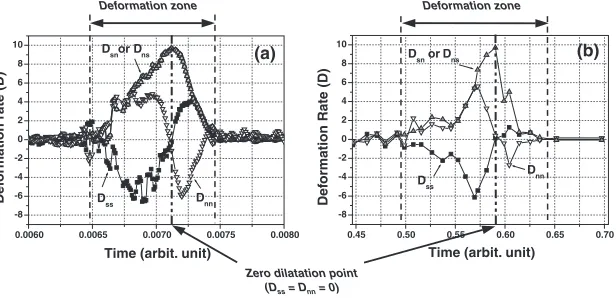
Shown in Fig. 5 are the variations of four deformation rate components (Dss, Dsn, Dns, and Dnn) during ECAP and
DCAP. It is noted from Fig. 5 that, from both processes, there exists a region (or instance) in the deformation zone where two dilatation components (Dss andDnn) of the deformation
rate intersect each other at the zero deformation rate. This indicates that, at this region, the shear components (Dsn or
Dns) are the maximum. In this study, therefore, it is termed
the zero dilatation point or maximum shear point.
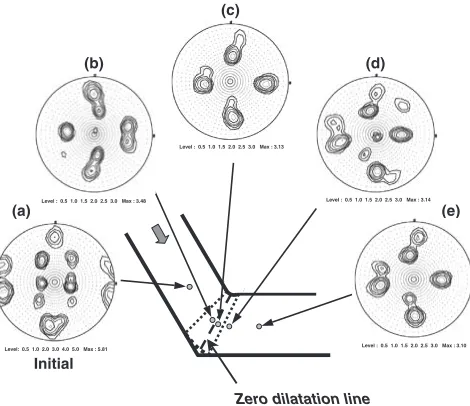
According to our observations of the zero dilatation points obtained from several different thickness of the workpiece,
the zero dilatation lineis thought to coincide with the line of intersection connecting the inlet and the outlet channel of the die. Shown in Fig. 6 is the schematic constructed based on the earlier findings, showing the deformation behavior within the deformation zone characterized in terms of the deforma-0.0 0.5 1.0 1.5 2.0 18 5 1416
12 8 1 Fns Fsn Fnn Fss Def ormation Gradient Time TD RD TD RD TD RD TD RD TD RD TD RD (a) (b) (c) (d) (e) (f)
Zero dilatation point
Fig. 3 The {111} pole figures obtained from the heat treated specimen (a) before ECAP and in steps (b) 8, (c) 12, (d) 14, (e) 16, and (f) 18 during ECAP analyzed based on the actual deformation history acquired from the finite element calculations. The RD and TD are parallel to the directions tangential and binormal to the streamline, respectively, as shown in Figs. 1 and 2. The step numbers denoted in the graphs are the same as those denoted in Fig. 2(a).
0.0 0.5 1.0 1.5 2.0 17 14 11 9 5 3 1 Fss Fns F sn Fnn Def ormation Gradient Time TD RD TD RD TD RD TD RD TD RD TD RD (a) (b) (c) (d) (e) (f)
Zero dilatation point
[image:3.595.51.286.71.244.2]tion rates; the deformation zone can be divided into two regions showing different deformation characteristics by the zero dilatation line (Dss¼Dnn¼0). The first region prior to
the zero dilatation line is characterized asDss<0andDnn> 0 and the shear component (Dsn or Dns) increases. On the
other hand, the second region ranging from the zero dilatation line to the finishing line of deformation is defined asDss>0
andDnn<0, and the shear component (DsnorDns) decreases
to zero. Therefore, it is considered that the zero dilatation line plays an important role in distinguishing the deformation behavior within the deformation zone during the shear deforming processes, since it is considered as the boundary where a significant change in the deformation characteristics takes place.
From the results obtained from the analyses based on the variations of the deformation gradient and the deformation rate as shown in Figs. 3–5, it is clear that the deformation behavior of DCAP is very similar to that of ECAP except for the final stage of the deformation, i.e., beyond the zero dilatation line (>step 12 in this specific case); general deformation feature exhibited by ECAP and DCAP is characterized by the dominant shear deformation with minor tension and compression. However, unlike DCAP, the height of the deformed grid in ECAP continued to reduce even after the workpiece passes the zero dilatation line until the grid
thickness returns to the initial one. Therefore, it is of interest to examine the effects of the different deformation character-istics of ECAP and DCAP on texture evolution.
3.3 Effects of deformation history on texture evolution
As discussed in section 3.2, the deformation behaviors in ECAP and DCAP show different deformation features once the workpiece passes through the zero dilatation line. Therefore, the effects of the different deformation behaviors on texture evolution were investigated in connection with the zero dilatation line.
Figures 3 and 4 show a series of the {111} pole figures calculated based on the actual deformation history, showing how the textures evolve with time steps during ECAP and DCAP, respectively. To be consistent with rolling, the direction tangential to the streamline is referred as RD, while the binormal direction,i.e., the direction normal to both the tangential and the normal direction is defined as TD.
As can be seen in Fig. 3, the {111} pole figure calculated based on the actual deformation history caused by ECAP continued to rotate largely (10–15) about the transverse direction (TD) during all period of the deformation process. Considering that the grid height returns to the original value upon exiting the deformation zone, the observed continuous orientation rotation with respect to TD is due to the compression along the thickness direction, which agrees well with the experimental and analyzed results presented by Suhet al.10)On the other hand, when compared the sequential {111} pole figures during ECAP (Fig. 3) with those obtained from DCAP (Fig. 4), considerable difference in the texture evolutions due to ECAP and DCAP was found; as already pointed out, the texture evolution in the early stage of deformation up to the zero dilatation time step (step 12) during DCAP is very similar to that shown by ECAP. However, after the zero dilatation time step in DCAP, textures did not evolve further and were observed to be nearly identical to those calculated based on the simple shear deformation and obtained experimentally from the Al alloys subjected to DCAP.10)Results similar to the texture evolu-tions in the heat treated specimen as shown in Figs. 3 and 4 could also be obtained in the cold rolled specimen as in Fig. 7.
To verify the results of the texture simulation due to DCAP
Zero dilatation point (Dss= Dnn= 0)
0.0060 0.0065 0.0070 0.0075 0.0080
-8 -6 -4 -2 0 2 4 6 8 10
Dnn Dsnor Dns
Dss
Def
ormation rate (D)
Time (arbit. unit) Deformation zone
(a)
0.45 0.50 0.55 0.60 0.65 0.70
-8 -6 -4 -2 0 2 4 6 8 10
Dss Dnn
Dsn or Dns
Def
ormation Rate (D)
Time (arbit. unit)
(b)
Deformation zone
Fig. 5 Variations in the deformation rate components during (a) ECAP and (b) DCAP analyzed by finite element method, defining the deformation zone and the zero dilatation point.
Zero dilatation line
Dss>0 Dnn<0
Dss= Dnn= 0
Dead zone
Dss<0
Dnn>0 Dsnor Dns
Dsnor Dns
[image:4.595.146.454.74.223.2]shown in Figs. 4 and 7, the sample was fed into the DCAP
machine at 10m/min. Once the sample reached the
deformation zone, the operation of the forming machine was discontinued. The sample was then removed from the machine to examine the side surface of the specimen using an electron backscattered diffraction (EBSD). Figure 8 shows a series of the {111} pole figures measured from the cold rolled specimen, showing how the textures are evolving during DCAP. It is noted in this figure that the initial texture as shown in Fig. 8(a) is identical to that of the cold rolled specimen shown in Fig. 7(a). When the specimen passed through the deformation zone, the texture evolved in a
manner similar to those shown in Figs. 4 and 7; That is, the texture evolved progressively up to the zero dilatation line followed by insignificant changes after the zero dilatation line. Therefore, the texture evolution sequence calculated based on the actual deformation history during DCAP is considered to agree well with the result of EBSD analysis. From the above results, it is concluded that the texture evolution during DCAP is very similar to that observed from ECAP up to the zero dilatation time. However, unlike the texture evolution during ECAP, the texture evolution beyond the zero dilatation time was so small that it is not visible on the scale of the pole figure as presented.
4. Conclusions
The effects of the deformation history on the texture evolution during ECAP and DCAP were investigated using the simulation and experiments. The obtained results were summarized as follows.
(1) The zero dilatation line coincides with the line of intersection connecting the inlet and the outlet channel of the die, and plays an important role in distinguishing the deformation behavior within the deformation zone during ECAP and DCAP, since it is considered as the boundary where a significant change in the deformation characteristics takes place.
(2) The deformation behavior of DCAP is very similar to that of ECAP except for the final stage of the deformation, i.e., beyond the zero dilatation line. The general deformation feature exhibited by ECAP and DCAP is characterized by the dominant shear defor-mation with minor tension and compression. However, the height of the deformed grid in ECAP continued to decrease after the zero dilatation line until the grid thickness returns to the initial one.
(3) The texture evolution during DCAP is very similar to that observed from ECAP up to the zero dilatation time. However, unlike the texture evolution during ECAP, the texture evolution beyond the zero dilatation time was very insignificant.
Acknowledgement
This work was financially supported by the Center for Nanostructured and Technology through a 21C Frontier R&D Program of the Ministry of Science & Technology of Korea. The authors would like to thank Mr. Jin-Yoo Suh in Caltech for his helpful discussion.
REFERENCES
1) V. M. Segal: Mater. Sci. Eng. A197(1995) 157–164.
2) Y. Iwahashi, Z. Horita, M. Nemoto and T. G. Langdon: Acta Mater.45
(1997) 4733–4741.
3) M. Furukawa, Z. Horita, M. Nemoto, R. Z. Valiev and T. G. Langdon: Acta Mater.44(1996) 4619–4629.
4) P. B. Berbon, N. K. Tsenev, R. Z. Valiev, M. Furukawa, Z. Horita, M. Nemoto and T. G. Langdon: Metall. Mater. Trans.29A(1998) 2237– 2243.
5) Y. T. Zhu and T. C. Lowe: Mater. Sci. Eng.A291(2000) 46–53. 6) S. R. Agnew, J. A. Horton, T. M. Lillo and D. W. Brown: Scr. Mater.50 R D
T D (a)
(d)
Max 7.1
Max 7.0 R D
R D R D
T D
T D T D
Max 6.0
Max 5.5
(b)
(c)
Fig. 7 The {111} pole figures obtained from the cold rolled specimen before and after ECAP and DCAP. (a) initial texture (measured), (b) after ECAP (predicted), (c) after DCAP (predicted), and (d) after DCAP (measured).
Zero dilatation line (a)
(b)
(c)
(d)
(e)
Level: 0.5 1.0 2.0 3.0 4.0 5.0 Max : 5.81 Level : 0.5 1.0 1.5 2.0 2.5 3.0 Max : 3.48
Level : 0.5 1.0 1.5 2.0 2.5 3.0 Max : 3.13
Level : 0.5 1.0 1.5 2.0 2.5 3.0 Max : 3.14
Level : 0.5 1.0 1.5 2.0 2.5 3.0 Max : 3.10
Initial
[image:5.595.54.283.69.290.2] [image:5.595.51.286.369.572.2](2004) 377–381.
7) J. C. Lee, H. K. Seok, J. H. Han and Y. H. Chung: Mater. Res. Bull.36
(2001) 997–1004.
8) J. H. Han, H. K. Seok, Y. H. Chung, M. C. Shin and J. C. Lee: Mater. Sci. Eng. A323(2002) 342–347.
9) J. C. Lee, H. K. Seok and J. Y. Suh: Acta Mater.50(2002) 4005–4019. 10) J. Y. Suh, J. H. Han, K. H. Oh and J. C. Lee: Scr. Mater.49(2003) 185–
190.
11) J. H. Han, J. Y. Suh, K. H. Oh and J. C. Lee: Mater. Trans.45(2004) 125–130.
12) R. Z. Valiev: Met. Mater. Int.7(2001) 413–420.
13) A. Gholinia, P. Bate and P. B. Prangnell: Acta Mater.50(2002) 2121– 2136.
14) J. Y. Suh, H. S. Kim, J. W. Park and J. Y. Chang: Scr. Mater.44(2000) 677–681.
15) J. C. Lee, H. K. Seok, J. Y. Suh, J. H. Han and Y. H. Chung: Metall.
Mater. Trans.33A(2002) 665–673.
16) S. H. Choi and K. H. Oh: Met. Mater. Int.3(1997) 252–259. 17) S. M. Baeck, H. K. Seok, J. C. Lee, D. I. Kim, H. I. Lee and K. H. Oh:
Mater. Sci. Forum408–412(2002) 685–690.
18) A. S. Khan and S. Huang:Continuum Theory of Plasticity, (John Wiley & Sons, New York, 1995) pp. 20–38.
19) S. R. Agnew:Proc. of the 12th ICOTOM, Montreal (1999) pp. 575– 580.
20) M. A. Gibbs, K. T. Hartwig, L. R. Cornwell, R. E. Goforth and E. A. Payzant: Scr. Mater.39(1998) 1699–1704.
21) J. R. Bowen, A. Gholinia, S. M. Roberts and P. B. Prangnell: Mater. Sci. Eng. A287(2000) 87–99.
22) S. L. Semiatin, D. P. Delo and E. B. Shell: Acta Mater.48(2000) 1841– 1851.