Simultaneous Prediction of Bendability and Deep Drawability Using Orientation
Distribution Function for Aluminum Alloy Sheets
*1Hirofumi Inoue
*2Department of Materials Science, Graduate School of Engineering, Osaka Prefecture University, Sakai 599–8531, Japan
Sheet metal formability is generally affected by crystallographic texture. In particular, bendability and deep-drawability of aluminum and its alloys are closely related to the recrystallization texture of the rolled sheets. It is necessary to quantitatively predict them from a view-point of texture control. This paper described a method for simultaneous prediction of both the bendability and the deep-drawability on the ba-sis of the average Taylor factor as a polycrystal calculated by using an orientation distribution function. The normalized Taylor factor (Mn -value) and the r-value were used as measures of bendability and deep-drawability, respectively. The predicted results from ideal orientations demonstrated that {001}<100> orientation had excellent bendability and poor deep-drawability, whereas {111}<110> orientation had poor bendability and excellent deep-drawability. The predicted results for some aluminum alloys suggested that conventional cold-rolled and an-nealed sheets would be favorable to bendability, and the addition of asymmetric warm rolling after cold rolling would lead to improved deep-drawability. [doi:10.2320/matertrans.L-M2017857]
(Received November 30, 2017; Accepted December 10, 2017; Published February 2, 2018)
Keywords: aluminum alloy, sheet metal formability, orientation distribution function, average Taylor factor, r-value
1. Introduction
In recent years, aluminum alloy sheets are used for the bodies of some automobiles to reduce the weight. It is known that the formability of sheet steel commonly used as the body consists of four basic deformation components: deep drawability, stretch formability, stretch-flange forma-bility and bendaforma-bility1). Among them, deep drawability2) and
bendability3) are strongly affected by crystallographic
orien-tations and consequently depend on textures of polycrystal-line metal sheets.
As for the body of an automobile, since outer panels of the hood, trunk-lid and doors require hemming which corre-sponds to 180 -bending, good bendability is necessary for aluminum alloy sheets employed as the outer panels. Takeda et al.3) showed that there was a negative correlation between
the bendability on a plane strain condition and the Taylor factor on the basis of experimental results of Al-Mg-Si alloy single crystals with various orientations, although the data had random variation. Similarly, Kaneko and Eguchi4)
ex-amined the effect of crystallographic texture on the bend-ability of Cu-Ni-Si alloy sheets with various textures, and found a positive correlation between the minimum bend ra-dius and the average Taylor factor which meant the average value of the Taylor factor as a polycrystalline sample. Thus it is clear that bendability is correlated with the Taylor factor and the orientation with a lower Taylor factor results in bet-ter bendability. Since the properties of polycrystalline mate-rials are expressed by the average values of those of
individ-ual grains, the author6) recently proposed a method for
predicting the bendability from the average Taylor factor of polycrystalline face-centered cubic metal sheets calculated using an orientation distribution function (ODF)5) which
ex-pressed a volume fraction of grain orientation.
When considering sheet metal formability in the body of
automobiles, sheet materials with good deep-drawability are necessary for door inner panels and fenders which require forming the sheets into complex components. Lankford value (r-value)7) as a measure of deep drawability, however,
has a considerably low value in normally rolled and an-nealed aluminum alloy sheets as compared to in steel sheets. Therefore the r-value which strongly depends on orientation should be improved through texture control2). Recently the
authors succeeded the formation of recrystallization texture consisting mainly of {111}<110> orientations favorable for improving the r-value as a main texture component8–10).
Fine texture control requires predicting in-plane anisotropy of the r-value with high accuracy. A method for predicting the r-value based on the average Taylor factor calculated by using ODF is very useful2,5,11,12).
In the present study, the average Taylor factor of a poly-crystalline material was calculated through texture analysis by ODF. Then the anisotropic in-plane features of the nor-malized Taylor factor and the r-value as respective criteria of bendability and deep drawability were predicted simultane-ously. In addition, the normalized Taylor factor and the r-value were calculated by using real recrystallization tex-ture data for aluminum alloy sheets9,13).
2. Analytical and Experimental Methods
Tensile deformation is first explained as the basics of bending deformation and the r-value analysis.
2.1 Calculation of Taylor factor in tensile deformation
In tensile deformation of a sheet material, the longitudi-nal, transverse and thickness directions are defined as the X-, Y- and Z-axes, respectively. Here we assume that the volume element with unit length is macroscopically elongated by dε in the X-direction and is contracted by qdε and (1 − q)dε in the Y- and Z-directions, respectively, that is, the condition of constant volume, dεx + dεy + dεz = 0 is satisfied under mac-roscopically uniform plastic deformation. In this case, the strain tensor E S is expressed by the following equation. *1 This Paper was Originally Published in Japanese in J. JILM 66 (2016)
582–588.
ES=dε·
1 0 0
0 −q 0
0 0 −(1−q)
(1)
Thus the q-value represents a ratio of transverse to longitudi-nal strain (0 ≤ q ≤ 1).
Now we assume that individual grains are subjected to ho-mogeneous strain identical with macroscopic tensile strain to satisfy the continuity in strain at grain boundaries. In or-der to view the strain condition of eq. (1) in the crystal coor-dinate system, X C = [100], Y C = [010] and Z C = [001], the
coordinate transformation is performed from the tensile specimen coordinate system X-Y-Z. There are five indepen-dent strain components in the coordinate-transformed strain tensor in view of both the symmetry of strain and the condi-tion of constant volume. Thus at least five active slip sys-tems are necessary for plastic deformation in each grain. The principle of the minimum work is here introduced to deter-mine the combination of five active slip systems. If the criti-cal resolved shear stress (CRSS) of {111}<110> glide sys-tems is τc and the shear strain of a given glide system is represented by dγn, then the plastic work by slip deforma-tion is expressed by the following equadeforma-tion.
dW=τc 5
n=1
|dγn| (2)
Hence the combination of glide systems in which dW is minimum, i.e. the sum of absolute value of shear strain is minimum, is selected as five active slip systems. In the case of tensile deformation, the plastic work by external stress is expressed by σ · dε and is equal to the right side of eq. (2). Thus the Taylor factor M, which is a function of crystallo-graphic orientation g and strain ratio q, is given by the fol-lowing equation.
M= σ
τc =min 5
n=1
|dγn|
dε (3)
Calculating the Taylor factor M(q, g) at a given q-value, the relation between g and M(q, g) is determined. In order to simplify subsequent calculations, we calculate an approxi-mation of M(q, g) in the form of series-expansion by gener-alized spherical harmonics Tµν
l (g)5) which take crystal and sample symmetry into account.
M(q,g)= L l=0 M(l) µ=1 N(l) ν=1 mµν l (q)T µν
l (g) (4)
In this manner, the coefficients mµν
l (q) can be determined by calculating M(q, g) at an appropriate interval from q = 0 to q = 1. q = 0 and q = 1 correspond to plane strain deformation and q = 0.5 corresponds to axisymmetric deformation.
In the meantime, the texture in a polycrystalline metal can be quantitatively expressed using an orientation distribution function (ODF) f(g)5) shown in the following equation.
f(g)=
L
l=0 M(l)
µ=1 N(l)
ν=1
Cµν
l T
µν
l (g) (5)
The coefficients Cµν
l can be calculated from some pole fig-ures on different crystal planes measured by X-ray diffrac-tion. When the tensile-strain direction is identical with the rolling direction, the mean value of the Taylor factor as the whole of specimen, namely the average Taylor factor, M¯ (q), is obtained by taking the weighted average of M(q, g) with f(g) in the whole orientation space.
¯
M(q)= M(q,g) f (g)dg (6)
Using the coefficients mµν
l (q) and C
µν
l in eq. (4) and eq. (5) respectively, eq. (6) can also be expressed as the following equation.
¯
M(q)=
L
l=0 M(l)
µ=1 N(l)
ν=1
mµν
l (q)C
µν
l
2l+1 (7)
If we use the tensile specimen cut along an arbitrary di-rection to the rolling didi-rection in a sheet, then the average Taylor factor in the specific direction is given by the follow-ing equation usfollow-ing the angle θ to the rolling direction.
¯
M(q, θ)=
L
l=0 M(l)
µ=1 N(l)
ν=1
mµνl (q)Cµν
l cos 2(ν−1)θ
2l+1 (8)
Therefore, the curve M¯ (q, θ) as a function of θ under a fixed q-value represents an in-plane variation of the average Taylor factor in a polycrystalline sheet material.
2.2 Prediction of bendability
It is known that crack initiation during bending deforma-tion is related to the formadeforma-tion of shear bands and texture strongly affects the shear bands formation3,4,14). The CRSS
is identical in face-centered cubic metals with only {111}<110> glide systems at room temperature. Therefore, assuming that as the Taylor factor lowers, i.e. as the total amount of glides becomes smaller, it is more difficult for shear bands to form, the average Taylor factor of a polycrys-talline material was calculated from the ODF, and then uti-lized for predicting bendability.
In bending deformation, the q-value of eq. (8) corre-sponds to a ratio of compressive strain along the bending axis to tensile strain along the bending direction on the side subjected to tensile stress. When an outer side (a convex side) in bending deformation satisfies the condition of plane strain tension, the q-value equals zero. In fact the q-value is considered to be a little larger than zero on the sheet surface subjected to the maximum tensile stress when the width of a bending specimen is relatively small. An in-plane variation of the average Taylor factor can be given by the graph show-ing a relationship between θ and M¯ (q, θ) under a fixed q-value in eq. (8). To quantitatively relate the average Taylor factor to bendability, we further calculate the average Taylor factor for a textured sheet material M¯ (q, θ) divided by the Taylor factor for a randomly oriented sample (i.e. by the co-efficient of the first term in eq. (4)) m11
as the normalized Taylor factor (the Mn value)6). Therefore
the Mn value of 1.0 corresponds to bendability for a
ran-domly oriented sample.
Mn(q, θ)= ¯
M(q, θ)
m11 0 (q)
(9)
In the present study, the Mn value was calculated for q =
0.16) suitable for bendability prediction by setting the
inter-val of angle θ at 15 .
2.3 Prediction of deep drawability
Since the r-value is a strain ratio of width and thickness directions in a tensile specimen, the r-value can be ex-pressed by the following equation using the q-value which corresponds to a strain ratio of width and longitudinal directions.
r= q
1−q (10)
The average Taylor factor M¯ (q, θ) can be calculated using eq. (8). Thus the r-value can be determined by calculating the q-value which M¯ (q, θ) becomes minimum at a fixed an-gle of θ. Here r = 1 (i.e. q = 0.5) means the r-value for a ran-domly oriented sample. If the q-value which M¯ (q, θ) be-comes minimum is determined at various angles of θ, then an in-plane variation curve of the r-value is obtained. In fact the r-value was calculated at a constant angle interval of 15 . To compare the calculated results of all aluminum alloys, the full constraints model suitable for the r-value prediction of Al-Mg-Si alloy sheets2) was used in the present study (See
eq. (1)). As mentioned above, it is possible to predict bend-ability and deep drawbend-ability simultaneously by calculating the average Taylor factor M¯ (q, θ) using ODF.
2.4 Prediction of the Mn value and the r-value for ideal
orientations
A single texture component, that is a family of preferred orientations consisting of crystallographically equivalent variants, was artificially generated, which was expressed by
the ODF with Gaussian spread5) of 20 . The width of
Gaussian spread was set in view of orientation density com-patible to that of a real texture. It should be noted that one texture component does not mean a strict orientation (hkl)[uvw] of a single crystal but consists of all the equiva-lent orientations {hkl}<uvw> of a polycrystal in terms of or-thogonal sample symmetry of a rolled sheet. The average Taylor factor M¯ (q, θ) was calculated using eq. (8) from the coefficients Cµν
l of the ODF for a given texture component
{hkl}<uvw>. Then the Mn value and the r-value were
deter-mined by the above methods.
2.5 Prediction of the Mn value and the r-value for
alu-minum alloy sheets
In addition to a 1050 commercially pure aluminum sheet with O temper, a 5182 aluminum alloy sheet with O temper and a 6022 aluminum alloy sheet with T4 temper employed as common samples of the Sectional Meeting on Textures in the Japan Institute Light Metals13), a 6022 aluminum alloy
sheet which was 90% cold rolled, 25% asymmetrically warm rolled at 473 K with a roll speed ratio of 1.5 and
T4-treated9) was used for texture measurements. The {111}, {100}, {110} and {311} incomplete pole figures of these sam-ples were measured using CuKα radiation by Schulz reflec-tion method15) in a tilt angle range of Φ = 15 to 90 . For the
sheet materials employed in the Sectional Meeting on Textures, the pole figures were measured on the sheet sur-face after lightly removing oxides by chemical etching6).
Using ODF analysis by the iterative series-expansion method16) developed by the author, the coefficients Cµν
l were calculated from measured incomplete pole figures, and then the Mn value and the r-value were determined by the above
methods. In the case of the cold rolled and asymmetrically warm rolled A6022-T4 sample, ODF analysis was made us-ing RD pole figures measured for a stacked sheets specimen to examine an average texture through sheet thickness17).
Computer program for predicting the Mn value and the
r-value operates in connection with general-purpose ODF
analytical software (Standard ODF18)) on Microsoft
Windows.
3. Results and Discussion
3.1 In-plane variations of the Mn value and the r-value
for ideal orientations
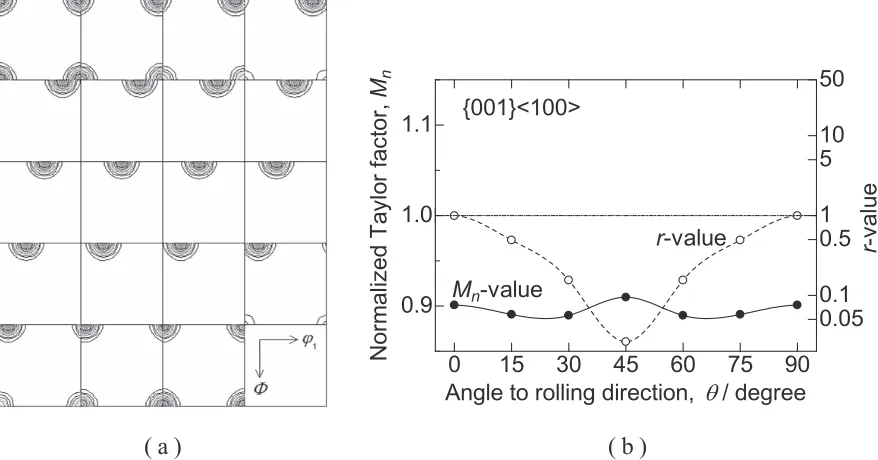
Figure 1(a) shows an ODF of cube orientation {001}<100> with Gaussian distribution. Considering the or-thogonal sample symmetry, the multiplicity is 4. Thus the cube orientation consists only of one variant, and the maxi-mum orientation density of the ODF has a high value of 48.5. In-plane variations of the normalized Taylor factor Mn
and the r-value for the cube orientation calculated at q = 0.1 are shown in Fig. 1(b). The Mn value shows a very low value
of about 0.9 at all angles to the rolling direction. Here the angle θ means the bending direction perpendicular to a bend axis, which is subjected to tensile or compressive strain during bending deformation. Therefore the bendability of cube orientation can be estimated to be very excellent in any direction. The predicted results for bendability correspond well to experimental results by Takeda et al.3) In contrast,
the r-value shows a very low value less than 0.1 at θ = 45 and the in-plane anisotropy is remarkable. Thus the deep drawability of cube orientation is estimated to be bad.
S orientations {123}<634> (Fig. 2(a)), which consist of four variants symmetrical to the RD and TD axes in pole fig-ures (i.e. a multiplicity of 1) and show the maximum orien-tation density (11.6) of about quarter value compared with cube orientation, have isotropic Mn values being slightly
higher than 1.0 (Fig. 2(b)). The r-value shows a higher value than 1.0 around θ = 45 in contrast with cube orientation but the in-plane anisotropy is relatively large. Thus it is esti-mated for S orientations that the bendability is not good and the deep drawability is not so good.
{111}<110> orientations (Fig. 3(a)), which consist of two variants symmetrical to the RD axis in pole figures (i.e. a multiplicity of 2) and show the maximum orientation density (24.7) of about half value compared with cube orientation, have higher Mn values than those of S orientation (Fig. 3(b)).
The r-value shows a high value more than 1.5 in any direc-tion and similar in-plane anisotropy to that of the Mn value.
bendability is not good but the deep drawability is very ex-cellent. The predicted results for deep drawability corre-spond to experimental results by authors obtained in a sam-ple with {111}<uvw> orientation components2).
From the predicted results from these ideal orientations, {001}<100> and {111}<110> orientations are effective for improving bendability and deep drawability, respectively. It is obvious that texture control suitable for the use is neces-sary to improve sheet metal formability.
3.2 In-plane variations of the Mn value and the r-value
for aluminum alloy sheets
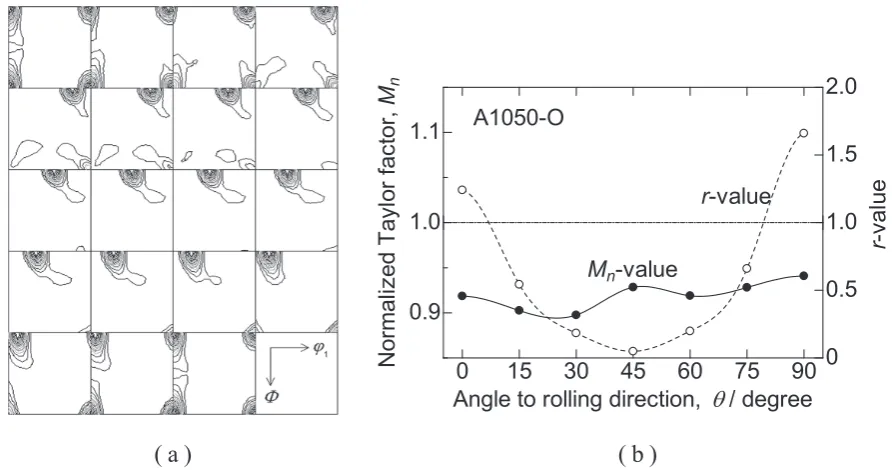
Figure 4 shows an ODF for the surface area of a 1050 alu-minum sheet with O temper and in-plane variations of the
Mn value and the r-value calculated from the ODF. Since
there is a sharp cube texture including RD-rotated compo-nents from cube preferred orientation (an orientation spread along the Φ axis in the φ2 = 0 section), this material has
considerably low the Mn value similar to that of cube
orien-tation in Fig. 1 and the Mn value increases slightly with
in-creasing angle θ, resulting from RD-rotated weak
compo-nents. The r-value shows a very low value around θ = 45 Fig. 1 (a) Orientation distribution function (ODF) with maximum orientation density of 48.5 for ideal orientation {001}<100> (Contour levels: 3.0 to 45.0
at a step of 3.0), and (b) in-plane variations of normalized Taylor factor and r-value calculated from the ODF.
[image:4.595.79.518.72.302.2] [image:4.595.78.522.355.592.2]and the in-plane anisotropy is considerably remarkable. Thus it is estimated for A1050-O that the bendability is ex-cellent but the deep drawability is not good.
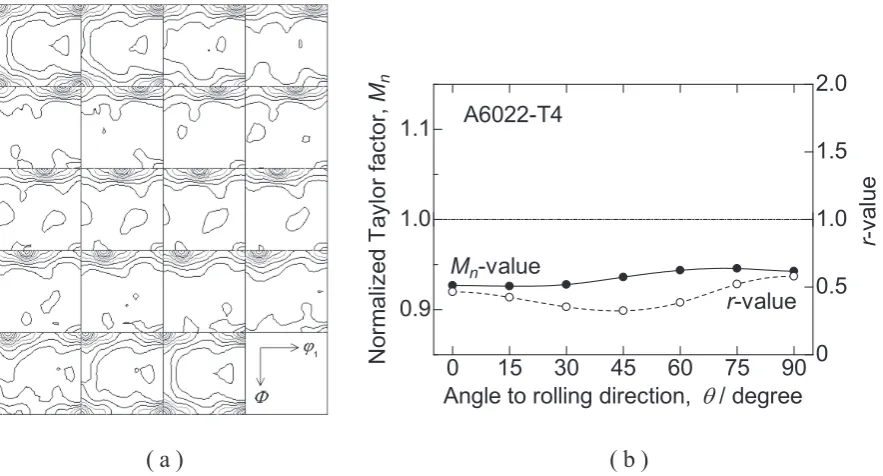
ODFs for the surface areas of a 5182 aluminum alloy sheet with O temper and a 6022 aluminum alloy sheet with T4 temper and in-plane variations of the Mn value and the
r-value calculated from the ODFs are shown in Fig. 5 and Fig. 6, respectively. Since A5182-O has a weak ND-rotated cube orientation of {001}<310> as a main component, the Mn value is moderately lower than 1.0 and relatively
isotro-pic (Mn < 1.0 in any direction). Similarly the r-value is
rela-tively isotropic and on the whole has a low value of about 0.5, although it shows a rather high value at θ = 45 In
con-trast, A6022-T4 shows large spreads toward ND-rotated cube orientation of {001}<310> and RD-rotated cube orien-tation of {011}<100>, but has moderately strong cube tex-ture. Therefore the Mn value is relatively low and isotropic.
The r-value shows the lowest value at θ = 45 and on the whole becomes somewhat lower than that of A5182-O. When ignoring the effect of ductility on sheet formability, in view of texture, A6022-T4 is better in bendability than A5182-O, while A5182-O is somewhat better in deep drawability than A6022-T4.
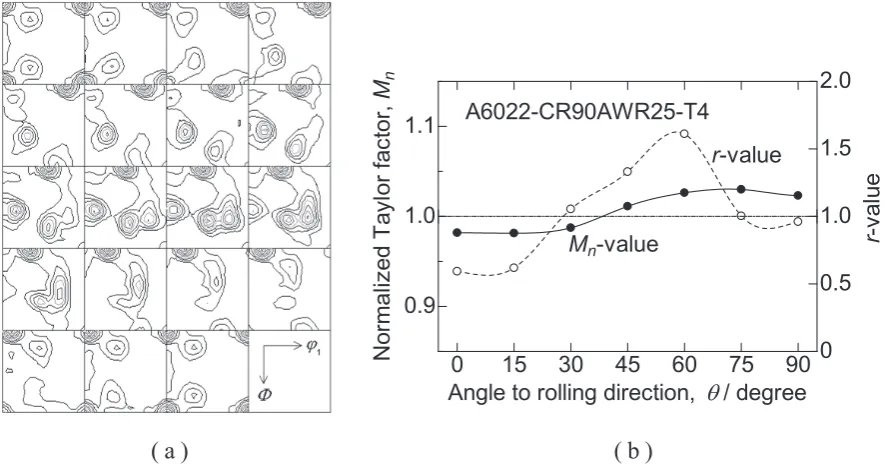
Figure 7 shows the results of a T4-treated material for the 6022 aluminum alloy sheet which was 90% cold rolled and 25% asymmetrically warm rolled. A main component of the Fig. 3 (a) Orientation distribution function (ODF) with maximum orientation density of 24.7 for ideal orientation {111}<110> (Contour levels: 2.0 to 24.0
at a step of 2.0.), and (b) in-plane variations of normalized Taylor factor and r-value calculated from the ODF.
[image:5.595.88.514.72.297.2] [image:5.595.74.522.343.578.2]recrystallization texture consists of near {111}<110> and cube orientation {001}<100> exists as the second compo-nent. As inferred from {111}<110> orientations of Fig. 3, the Mn value shows a relatively high value of about 1.0, and
there is a tendency to have high values in θ = 45 to 90 . Although the r-value shows in-plane anisotropy similar to the Mn value, the average r-value is considerably higher than
those of aluminum alloy sheets manufactured by normal processing and exceeds 1.0 (the calculated value: 1.07, the measured value: 1.01). The higher r-value seems to be an ef-fect of near {111}<uvw> orientation. The predicted results suggest that the deep drawability is good while the
bendabil-ity is not so good in this sheet. The application of this tex-ture to inner panels of the body can be expected in the fu-ture. On the contrary, normally cold rolled and T4-treated sheets shown in Fig. 6 seem to be suitable for outer panels which requires hemming.
4. Conclusions
Based on the average Taylor factor of polycrystalline face-centered cubic metals calculated by using ODF, it was possible to predict the Mn value for bendability estimation
and the r-value for deep drawability estimation simultane-Fig. 5 (a) Orientation distribution function (ODF) with maximum orientation density of 3.7 for 5182 aluminum alloy sheet with O temper (Contour levels:
1.0 to 3.0 at a step of 1.0), and (b) in-plane variations of normalized Taylor factor and r-value calculated from the ODF.
[image:6.595.76.524.68.305.2] [image:6.595.79.521.356.594.2]ously. In terms of texture control, the main results obtained in the present study are as follows:
(1) From the analytical results using ideal orientations, it is obvious that cube orientation {001}<100> is excellent for bendability and {111}<110> orientation is excellent for deep drawability. It is estimated that {123}<634> orientation (S orientation) has poor bendability and the effect of the r-value improvement is not so much as expected.
(2) The analytical results using real textures of annealed aluminum alloy sheets suggest that cold rolling which develops cube orientation during annealing is effective for the improvement in bendability, and that the addition of asymmetric warm rolling possible to develop {111}<uvw> components such as {111}<110> during annealing is effective for the improvement in deep drawability.
REFERENCES
1) K. Yoshida: J. Jpn Soc. Mech. Eng. 84 (1981) 261–267.
2) H. Inoue and T. Takasugi: Mater. Trans. 48 (2007) 2014–2022. 3) H. Takeda, A. Hibino and K. Takata: Mater. Trans. 51 (2010)
614–619.
4) H. Kaneko and T. Eguchi: Mater. Trans. 53 (2012) 1847–1851. 5) H. J. Bunge: Texture Analysis in Materials Science, Translated by P.
R. Morris, Butterworths, (1982). 6) H. Inoue: Mater. Trans. 56 (2015) 61–69.
7) W.T. Lankford, S.C. Snyder and J.A. Bauscher: Trans. Am. Soc. Met. 42 (1950) 1197–1232.
8) H. Inoue, M. Hori, T. Komatsubara, H. Tanaka and T. Takasugi: Mater. Sci. Forum 558–559 (2007) 207–212.
9) H. Inoue: Mater. Sci. Forum 783–786 (2014) 33–38. 10) H. Inoue: J. Japan Inst. Light Metals 65 (2015) 156–163.
11) H. Inoue and N. Inakazu: J. Japan Inst. Light Metals 44 (1994) 97–103.
12) H. Inoue, T. Yamasaki, G. Gottstein, P. Van Houtte and T. Takasugi: Mater. Sci. Forum 495–497 (2005) 573–578.
13) H. Inoue, Y. Yamada, S. Suzuki and H. Morita: Report of the Sectional Meeting on Textures in the Japan Institute Light Metals No.56,
Controlling and Formation Mechanism of Texture, (2011) pp. 1–26. 14) M. Kuroda and V. Tvergaard: Int. J. Plast. 23 (2007) 244–272. 15) L.G. Schulz: J. Appl. Phys. 20 (1949) 1030–1033.
16) H. Inoue and N. Inakazu: J. Jpn. Inst. Metals 58 (1994) 892–898. 17) H. Inoue and T. Takasugi: Z. Metallk. 92 (2001) 82–88. 18) H. Inoue: Materia Japan 40 (2001) 589–591.
Fig. 7 (a) Orientation distribution function (ODF) with maximum orientation density of 11.2 for 6022 aluminum alloy sheet with T4 temper after 90% cold rolling and 25% asymmetric warm rolling (Contour levels: 1.0 to 11.0 at a step of 1.0), and (b) in-plane variations of normalized Taylor factor and
[image:7.595.77.522.70.303.2]