Evolution of Rolling Textures of Cold Rolled Copper Foils
Su-Hyeon Kim
1, Seung Zeon Han
1, Chang Joo Kim
1, In-Youb Hwang
2and Fuxing Yin
31Korea Institute of Materials Science, 531 Changwondaero, Changwon, Gyeongnam, 641-831, Korea 2Poongsan Co., 611 Daejung-Ri, Onsan-Oup, Ulju-Kun, UIsan, 689-892, Korea
3
National Institute for Materials Science, Tsukuba 305-0047, Japan
The texture evolution of cold rolled tough pitch copper foils could be changed by altering the initial texture and microstructure before cold rolling. The development of-fiber texture was substantially suppressed even after 92% reduction for the case of abnormally coarse initial grain structure and extremely strong initial cube texture. Instead, the intensity of cube and RD (rolling direction)-rotated cube texture components was increased continuously by increasing the intensity of the initial cube texture. [doi:10.2320/matertrans.MRA2008330]
(Received September 11, 2008; Accepted December 1, 2008; Published January 21, 2009)
Keywords: copper foil, rolling, texture, cube texture,-fiber, initial texture
1. Introduction
Rolled copper foils are often used as conductive metal layers in flexible printed circuit boards. Texture control is important in order to enhance flexibility or the bending endurance of rolled copper foils. Cube texture is the most favorable component of the flexibility of copper foils.1,2)
Heavily cold rolled coppers typically exhibit strong -fiber texture, which frequently changes into the cube texture after recrystallization.3) Anomalous texture evolutions of rolled copper foils have been reported; the foils possess very strong cube texture in the as-rolled state, which result in unique recrystallization textures in the annealed state.4,5) The
mechanism of texture evolution in cold rolled copper foils is not fully understood.
In the present research study, cold rolled copper foils with different thicknesses were prepared by changing the initial thickness before rolling. The evolutions of the textures and microstructures were investigated and the influence of initial texture and microstructure was discussed.
2. Experimental
The material used in this study is tough pitch copper (C11000), which contains oxygen as copper oxide particles. Table 1 indicates the chemical composition of the material measured by an ICP (inductively coupled plasma) method and an oxygen analysis.
Three kinds of samples with different thicknesses were prepared by a rolling schedule as shown in Fig. 1. Hot rolled strip with 9 mm thickness was cold rolled to different thicknesses, 1.55, 1.05, and 0.45 mm, and then annealed to be recrystallized. TP450a was prepared by higher temper-ature annealing in order to intentionally increase the intensity of cube texture. TP1550a, TP1050a, and TP450a were cold rolled to 125, 85, and 36mmthicknesses, respectively. Thickness reduction by the final cold rolling is 92% regardless of thickness of the samples.
Macroscopic textures of the samples were measured by a back reflection X-ray diffraction method. Three incomplete pole figures (111), (200), and (220) were measured; and complete pole figures and orientation distribution functions
(ODFs) were calculated using Labotex software by arbitrarily defined cells (ADC) method.6)The specimens were polished
parallel to the rolling plane mechanically and chemically to expose the center layers to measure. The textures on a microscopic scale were measured by the techniques of scanning electron microscope-electron back-scattered dif-fraction (SEM-EBSD). EBSD samples were mechanically polished and subsequently electro-polished. Microstructures of the specimens were observed under an optical microscope and a transmission electron microscope.
3. Results and Discussion
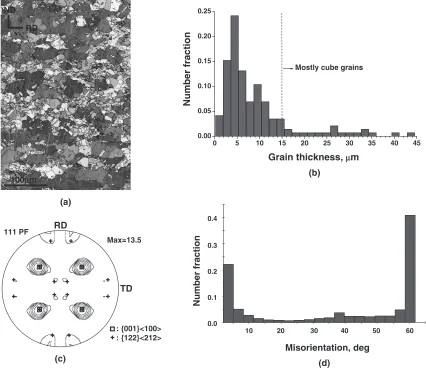
Figure 2 shows the ODFs of TP1550a, TP1050a, and TP450a, which are cold rolled and annealed sheets with 1.55, 1.05, and 0.45 mm thicknesses, respectively. Strong cube textures developed but those intensities increased with decreasing thickness of the specimens. Because three samples were cold rolled from the same thickness, reduction increases with decreasing thickness of the samples. Higher cold rolling reduction could substantially enhance the development of cube texture in the specimen TP450a. Figure 3 shows the longitudinal section optical microstruc-tures of each specimen. Recrystallized grain strucmicrostruc-tures can be seen in all the specimens. Compared to TP1550a and TP1050a, TP450a exhibited an inhomogeneous grain size distribution, which can be characterized by the mixture of coarse grains and fine grains. In order to discriminate the orientations of these two kinds of grains, EBSD mapping in the longitudinal section was carried out and shown in Fig. 4. Solid lines in the micrograph indicate high angle boundaries with a misorientation of more than 15 deg, and grain thicknesses were measured by a linear intersection method. Coarse grains with thickness of larger than 15mm mainly possessed the cube orientation, but the fine grains had various orientations. Grain boundary misorientation histo-gram shows the presence of large amount of low angle boundaries, which indicates that cube-oriented grains are agglomerated and impinge on each other. Grain boundary misorientation histogram also shows the presence of twins of cube orientation, which were indexed byf122gh212iin (111) pole figure.
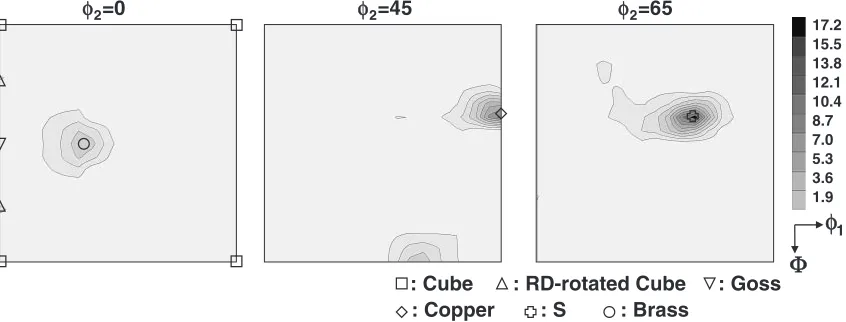
Figure 5, Figure 6, and Figure 7 show the texture evolutions of TP125 (125mm thick sample), TP85 (85mm
thick sample), and TP36 (36mmthick sample), respectively. TP125 sample exhibited a typical cold rolling texture characterized by -fiber, running from the copper orienta-tion f112gh111i, over the S f123gh634i, to the brass orientation f011gh211i in the Euler orientation space. In the TP85 specimen, a new orientation defined as RD (rolling direction)-rotated cube, indexed by f025gh100i, was found in the 2¼0 section. In the TP36 specimen, cube
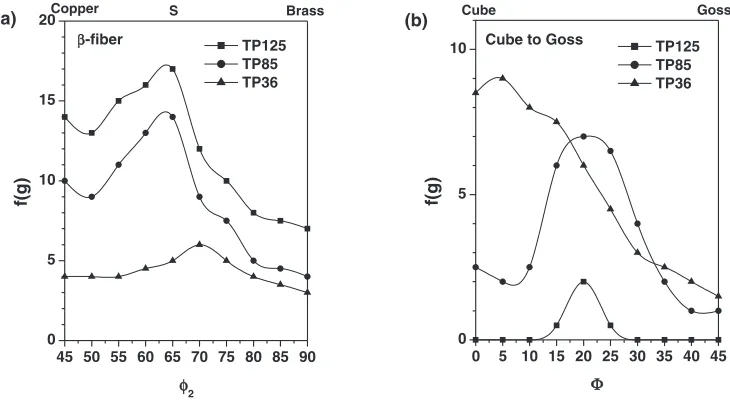
(f001gh100i) and RD-rotated cube textures developed sig-nificantly with reducing intensity of-fiber texture. Figure 8 shows the orientation densities along the-fiber, and those along the cube to goss (f011gh100i) orientations. The texture
components found in TP125, TP85, and TP36 specimens can be ordered from the maximum to the minimum as follows.
TP125
S>copper>brass>RD-rotated cube>cube TP85
S>copper>RD-rotated cube>brass>cube TP36
RD-rotated cube>cube>S>copper>brass The main texture of the cold rolled foils was changed from the -fiber to the cube or RD-rotated cube with decreasing thickness of the foils.
Hot rolled to 9mm
Cold rolled to 1.55mm by 83% reduction
Cold rolled to 1.05mm by 88% reduction
Cold rolled to 0.45mm by 95% reduction
Annealed at 500°C for 30min
(TP1550a)
Annealed at 500°C for 30min
(TP1050a)
Annealed at 750°C for 0.5min (TP450a)
Cold rolled to 125µm by 92% reduction through 50 passes
(TP125)
Cold rolled to 85µm by 92% reduction through 60 passes
(TP85)
Cold rolled to 36µm by 92% reduction through 5 passes
(TP36)
Fig. 1 Rolling schedule of tough pitch copper foils with three different thicknesses.
21.0 18.9 16.9 14.8 12.8 10.8 8.7 6.7 4.6 2.6 φ1 Φ φ2=0
: Cube 97.0
87.0 77.0 67.0 57.0 47.0 37.0 27.0 17.0 7.0
204 183 162 141 120 99 78 57 36 15 φ1
Φ
φ1 Φ
φ2=0 φ2=0
(a) (b) (c)
[image:2.595.49.550.85.123.2]Fig. 2 ODFs in2¼0sections of (a) TP1550a (annealed 1.55 mm thick sample), (b) TP1050a (annealed 1.05 mm thick sample), and (c) TP450a (annealed 0.45 mm thick sample).
Table 1 Chemical composition of tough pitch copper.
Fe Pb S Bi As Sb O Cu
Composition,
[image:2.595.81.506.128.390.2] [image:2.595.87.512.427.577.2]Figure 9 shows the microstructures of cold rolled foils. Elongated grain structures indicate that the materials were heavily cold rolled. Compared to TP125 and TP85 specimens showing fine and homogeneous grain structures, the micro-structure of TP36 was characterized by a mixture of fine and coarse grains. The origin of coarse grains in the deformed state would be coarse grains in the initial state before rolling. Inhomogeneous microstructure of TP450a could retain even
after 92% deformation to form coarse grains in TP36. Microstructure evolution of TP36 was observed under TEM and shown in Fig. 10. Refined as well as less refined grains were present and the orientation measured at one of the coarse grains were close tof001gh100i.
The presence of coarse grains in the TP36 sample was also confirmed by the EBSD analysis. Figure 11(a) shows the pattern quality micrograph in the longitudinal section of
ND
RD
100µm 100µm
ND
RD
100µm ND
RD
(a) (b)
(c)
Fig. 3 Longitudinal section optical micrographs of (a) TP1550a (annealed 1.55 mm thick sample), (b) TP1050a (annealed 1.05 mm thick sample), and (c) TP450a (annealed 0.45 mm thick sample).
Misorientation, deg
10 20 30 40 50 60
Number fraction
0.0 0.1 0.2 0.3 0.4
(b)
(d)
0 5 10 15 20 25 30 35 40 45
0.00 0.05 0.10 0.15 0.20 0.25
Mostly cube grains
Number fraction
Grain thickness, µm
(a) 100µm
ND
RD
(c) RD
TD 111 PF
: {001}<100> : {122}<212> Max=13.5
[image:3.595.89.512.79.232.2] [image:3.595.84.510.282.652.2]TP36. Solid lines in the micrograph indicate high angle boundaries with a misorientation of more than 15 deg. Figure 11(b) and 11(c) shows that cube, f001gh100i and RD-rotated cube,f025gh100iwere detected in coarse grains. Therefore, the presence of coarse grains is responsible for the high intensity of cube and RD-rotated cube textures in the deformed state.
Figure 12 shows the grain thickness histogram of TP36. Figure 12(a) shows the measured values from the micrograph
of Fig. 11(a); and Fig. 12(b) shows the conversion from the grain thickness of TP450a (annealed 0.45 mm thick sample), assuming that the thickness changes of grains are homolo-gous with the macroscopic thickness changes. Comparison of two histograms says that grain thickness distribution follows the prediction based on external thickness changes. Inhomo-geneous grain size distribution corresponds with that in the initial state. Therefore, the origin of coarse grains with cube and RD-rotated cube orientations in TP36 can be
cube-17.2 15.5 13.8 12.1 10.4 8.7 7.0 5.3 3.6 1.9
φ
1Φ
: Cube : RD-rotated Cube
: Brass
: Copper : S
φ2=0 φ2=45 φ2=65
: Goss
Fig. 5 ODFs in2¼0, 45, and 65 sections of TP125 (125mmthick sample).
13.3 12.0 10.7 9.3 8.0 6.6 5.3 4.0 2.6 1.3
φ
1Φ
φ2=0 φ2=45 φ2=65
: Cube : RD-rotated Cube
: Brass
: Copper : S
: Goss
Fig. 6 ODFs in2¼0, 45, and 65 sections of TP85 (85mmthick sample).
φφ
1Φ
9.4 8.5 7.6 6.7 5.8 4.9 4.0 3.1 2.2 1.3
φ2=0 φ2=45 φ2=65
: Cube : RD-rotated Cube
: Brass
: Copper : S
: Goss
[image:4.595.88.511.76.237.2] [image:4.595.91.509.277.439.2] [image:4.595.88.510.481.644.2]oriented coarse grains in TP450a. The cube orientation can reside in rolled state, because this orientation is metastable against deformation.7) Several previous experimental re-searches showed that deformed cube grains can be present in cold rolled polycrystalline copper.8,9) Researches about single crystallites confirmed the stability of cube orientation and also presented the sequence of orientation changes during rolling. Verbraak reported that cube-oriented single
crystalline copper still contains a strong cube texture component even after 99% cold rolling.10)Other studies on
single crystalline copper and aluminum alloy reported that initial cube orientation rotates around the RD (rolling direction) and then changes into S orientation by additional TD (transverse direction) rotation.11,12) Lattice rotation of crystallite is predicted by the calculation of active slip system under the loading condition. Full constraint Taylor model
45 50 55 60 65 70 75 80 85 90 0
5 10 15 20
β-fiber
Brass S
Copper
f(g)
φ2
TP125 TP85 TP36
0 5 10 15 20 25 30 35 40 45
0 5
10 Cube to Goss
Goss Cube
f(g)
Φ
TP125 TP85 TP36
(a) (b)
Fig. 8 Orientation densities f(g) of TP125 (125mmthick sample), TP85 (85mmthick sample), and TP36 (36mmthick sample) (a) along
-fibers and (b) from¼0to 45 in2¼0section.
10µµm
ND
RD
10µm
ND
RD
(a)
(b)
10µm
ND
RD
(c)
Fig. 9 Longitudinal section optical micrographs of (a) TP125 (125mmthick sample), (b) TP85 (85mmthick sample), and (c) TP36 (36mm
thick sample).
0.2µµm RD ND
0.2µm RD ND
200
020
(a) (b)
[image:5.595.116.481.73.274.2](c)
[image:5.595.85.513.331.464.2] [image:5.595.81.514.519.646.2]predicts that exact cube orientation is stable and slight deviation from the exact cube orientation is unstable against RD rotation. TD-rotated cube orientation can be produced by grain subdivision into deformation bands.13) In the present
study, no TD-rotated cube orientation was found in both X-ray diffraction and EBSD analysis. Figure 11 shows that cube and RD-rotated cube orientation were present prefer-entially in the large thickness grains, which should come from large-sized cube-oriented grains before rolling. The orientation of initially cube-oriented coarse grains might be stable against deformation, or changed into RD-rotated cube with increasing deformation. Therefore, the intensity of
-fiber texture in the rolled state can be directly related to the intensity of cube texture before rolling. Figure 13 shows the orientation densities of the rolling texture components in TP125, TP85, and TP36, as a function of the orientation densities of the cube component in TP1550a, TP1050a, and TP450a. It is clearly seen that the-fiber intensity decreases with increasing initial cube texture intensity. Initial texture can influence subsequent rolling texture evolution, but will disappear after a critical reduction if it is unstable against deformation.14,15) The present research reports that the
-fiber development is very sluggish even after 92% reduction for the case of an extremely strong initial cube texture and abnormally coarse initial grain structure. Because the initial state before cold rolling was cold rolled to a large reduction in the previous step, it concurrently possessed a
5µm
RD ND
[image:6.595.84.511.74.227.2](a) (b) (c)
Fig. 11 Longitudinal section EBSD measurement of TP36 (36mmthick sample) showing (a) pattern quality map, (b) grains off001gh100i orientation with 10 deg tolerance angle, and (c) grains off025gh100iorientation with 10 deg tolerance angle.
0.0 0.5 1.0 1.5 2.0 2.5 3.0 3.5 0.00
0.05 0.10 0.15 0.20 0.25
cube and RD-rotated cube grains
Number fraction
Grain thickness, µm
0.0 0.5 1.0 1.5 2.0 2.5 3.0 3.5 0.00
0.05 0.10 0.15 0.20 0.25
Initially cube grains
Number fraction
Grain thickness, µm
[image:6.595.88.513.282.411.2](a) (b)
Fig. 12 Grain thickness histogram of (a) TP36 (36mmthick sample) in Fig. 11 and of (b) conversion from the TP450a (annealed 0.45 mm thick sample) in Fig. 4 imposed by macroscopic thickness reduction (92%).
0 50 100 150 200 250
0 5 10 15
f(g) of texture components in cold rolled state
Copper S Brass Cube
RD-rotated cube
f(g) of cube texture before cold rolling
[image:6.595.322.528.486.747.2]high intensity of cube texture. Unlike bulk-scale products, thin foils inevitably undergo a large amount of rolling reduction from hot rolled strip to final thickness. Therefore, a new strategy of texture control is required in the manufacture of copper foils from a practical point of view.
4. Conclusion
Cold rolled copper foils exhibited a high intensity of cube and RD (rolling direction)-rotated cube textures and a low intensity of -fiber components. The microstructure before cold rolling was composed of cube-oriented coarse grains and other fine grains. Sluggish development of-fiber texture of cold rolled copper foils is mainly attributed to extremely strong initial cube texture.
Acknowledgement
This work is supported by the Mid-Term Core Technology Development Program of Ministry of Commerce, Industry and Energy in Korea.
REFERENCES
1) Japan Patent, 11-286760, 1999.
2) T. Hatano, Y. Kurosawa and J. Miyake: J. Electron. Mater.29(2000) 611–616.
3) F. J. Humphreys and M. Hatherly: Recrystallization and Related Annealing Phenomena, (Pergamon, Great Britain, 1995) pp. 328–333. 4) G. Simons, K. Kunze, W. Hauffe and J. Dual: Solid State Phenomena
105(2005) 465–470.
5) S.-H. Kim, S. Z. Han, C. J. Kim, S.-Y. Ok, I.-Y. Hwang and F. Yin: Mater. Sci. Forum558–559(2007) 229–234.
6) K. Pawlik: Phys. Status Solidi134B(1986) 477–483. 7) I. L. Dillamore and H. Katoh: Met. Sci.8(1974) 73–83.
8) A. A. Ridha and W. B. Hutchinson: Acta Metall.30(1982) 1929–1939. 9) B. J. Duggan, K. Lu¨cke, G. Ko¨hlhoff and C. S. Lee: Acta Metall. Mater.
41(1993) 1921–1927.
10) C. A. Verbraak: Acta Metall.6(1958) 580–597.
11) M. Wro´bel, S. Dymek, M. Blicharski and S. Gorczyca: Z. Metallkd.85
(1994) 415–425.
12) O. Engler, X. W. Kong and K. Lu¨cke: Scr. Mater.41(1999) 493–503. 13) F. Basson and J. H. Driver: Acta Mater.48(2000) 2101–2115. 14) Z. Chen, X. Zhang, Y. Du, Z. Yao and C. Liu: Mater. Sci. Forum408–
412(2002) 475–480.