Mayonnaise belongs to the food products widely consumed in Europe. It is an emulsion of vegetable oil and water, where egg yolk acts as an emulsifier (Yang & Lai 2003), and salt, vinegar, sugar, and other substances act as flavourings. The com-position of mayonnaises is very close to that of various dressings (Friberg et al. 2003; Ford et al. 2004). Mayonnaise has a semisolid structure with pronounced viscoelastic properties, growing liquid at moderate shear (García et al. 1988). The elastic character prevails over the viscous charac-ter at the same frequency (Berjano et al. 1990). The complex viscosity decreases with increasing frequency. A sample of light mayonnaise was less
destroyed by shear than a sample of full-fat may-onnaise (Muñtoz & Sherman 1990).
Traditional mayonnaise should contain about 80% oil, according to the legislation, and its rheo-logical properties depend on the oil content (Štern et al. 2001, 2007). The oil content is substantially lower in low-energy light mayonnaises, where the traditional viscosity is simulated by the addition of modified starch, xanthan (Lee 2001), β-glucan (Vaikousi & Biliaderis 2005) or other thickening agents. Thickeners and emulsifiers increase the textural thickness, and rheological data correlate with the sensory thickness (Wendin 2001). A similar effect was observed in the case of tartar
Supported by the Grant Agency of the Academy of Sciences of the Czech Republic (Grant No. IAA 2060404).
Rheological and Sensory Characteristics
of Yoghurt-Modified Mayonnaise
Petr ŠTERN
1, Jan POKORNÝ
2, Alena ŠEDIVÁ
2and Zdeňka PANOVSKÁ
21
Institute of Hydrodynamics, Academy of Sciences of the Czech Republic, Prague,
Czech Republic;
2Department of Food Chemistry and Analysis, Faculty of Food
and Biochemical Technology, Institute of Chemical Technology in Prague, Prague,
Czech Republic
Abstract
Štern P., pokorný J., Šedivá A., Panovská Z. (2008): Rheological and sensory characteristics of yo-ghurt-modified mayonnaise. Czech J. Food Sci., 26: 190–198.
Rheological and textural characteristics were studied in a set of 11 samples of yoghurt-modified mayonnaise at 15, 20, and 25°C. The rheometer Rheostress 300 was used to determine the static yield value, apparent viscosity, thixotropy, and elasticity. The sensory texture and flavour profiles were developed and determined in agreement with the respec-tive international standards, using a group of selected and trained assessors. The yield value and apparent viscosity substantially decreased with increasing temperature, but thixotropy and sensory characteristics were not significantly affected by temperature. Linear and semilogarithmic relations were observed between the analytical parameters, but more complex relations, showing a maximum or a minimum, were found in some cases. Thixotropy was related to most of the sensory parameters, viscosity was related to spreadability, and significant relationships existed between the texture acceptability and the flavour acceptability. Rheological measurements were thus useful for a rapid prediction of the sensory properties of yoghurt-modified mayonnaises, but could not be used to replace any textural analysis.
sauce (Štern et al. 2007), which is a special fla-voured mayonnaise.
A disadvantage of traditional mayonnaise is the high cholesterol content. Cholesterol-free mayon-naise may be prepared by replacing egg yolk with vegetable proteins, such as soy milk (García et al. 2002), fermented peas (Siebenhandl et al. 2002), peanuts (Guadalupe-Johnston et al. 2003), and white lupin protein isolate (Raymundo et al. 2002a), or white lupin protein and xanthan (Raymundo et al. 2002b).
The relatively bland flavour of traditional may-onnaise may seem less acceptable on frequent consumption, therefore, the composition of may-onnaise may be diversified by various seasonings, either by simple substances or by more compli-cated mixtures containing also some fat. Tartar sauce is a mayonnaise modified by the addition of milk, white wine, solid particles of vegetables, fruits, or mushrooms (Štern et al. 2007). Solid particles do not substantially affect the rheology-texture relationships (Štern et al. 2006). Another example of a modified mayonnaise is a mixture of mayonnaise with fondue cheese (Bieri 2005). In this paper, we report on rheology and texture relations of mayonnaise containing the addition of yoghurt.
MATERIAL AND METHODS
Material. Mayonnaise consisted of 30% wa-ter, 25% refined rapeseed oil, 15% white yoghurt, 10% corn syrup and 6% icing sugar. It contained the following additional ingredients: instant starch, vinegar, salted egg yolk, salt, mustard, tartaric acid, xanthan, potassium sorbate, and EDTA. The final product contained 1310 kJ, 0.4 g protein, 18.7 g carbohydrates and sugars, and 26.1 g fat per 100 g. Commercial products were spiked with xanthan in the producer’s pilot plant.
Rheological analysis. Rheological parameters (yield value τ0) and viscoelasticity moduli (storage modulus G' – elastic components, loss modulus G'' – viscous component, G* – complex modulus) were determined using the Rheostress 300 (Ther-moHaake, Karlsruhe, Germany) in the CR mode. Flow curves, apparent viscosity ηA, and visco- elastic parameters were determined using coaxial cylinders (Z 38, Ra = 21.7 mm; Ri = 19.01 mm; Ra/Ri = 2.69), ribbed to prevent slipping. A vane rotor FL 20 (D = 21 mm, 4-wing) was used for measuring the yield value τ0. The yield value τ0 was
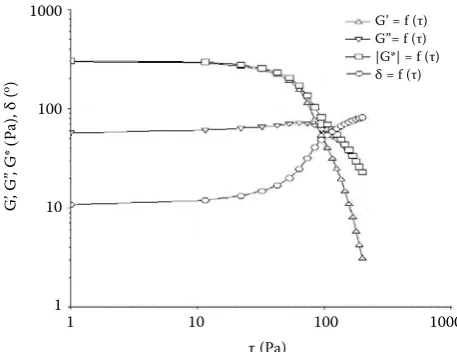
determined as the maximum on the shear stress – time curve at the constant shear rate of 0.5 s in the CR mode. Flow curves were determined with the RS 300 over the shear rate range of 0–150 s in such a way that the rotor reached the maximum rotations in 60 s (upwards flow curve), and it reached zero in the same time of 60 s (downwards flow curve). Thixotropy (Pa/s) was determined as the area between the upward and downward curves of the flow curve (Figure 1). The apparent viscosity ηA was calculated at the highest shear rate applied (150 s). The viscoelasticity moduli were determined by means of dynamic tests with forced oscillation by frequency 0.1 Hz (index0.1) and 1.0 Hz (index1.0) or by amplitude of 1–200 Pa in the linear viscoelastic region. The shear stress (stress sweep) τ represents the value at which the viscosity modulus G'' exceeds the elastic modu-lus G' at the frequency of 1.0 Hz. The frequency of 0.1 Hz was used for the determination of the moduli G’ and G’’. An example of the mechanical spectra of the experimental samples is shown in Figure 2 (Oscillation Amplitude Sweep).
Sensory analysis. The analysis was carried out in a standard test room (ISO 8589) under the con-ditions specified by the respective international standard (ISO 6564). Two 20 ml samples in 150 ml beakers, provided with four-digit codes, were served at a session in random order. White bread was used as a neutralisation agent. The assessor panel consisted of 18 experienced persons, selected, trained, and monitored according to the respective international standard (ISO 8586). To conform with international usage, extraneous values were not eliminated prior to the statistical analysis as all the results are considered as equally valid. The results were rated using of unstructured
graphi-0 50 100 150 200
0 30 60 90 120 150
Jȱ(1/s)
W
ȱ(P
[image:2.595.309.531.82.226.2]a)
cal scales 160 mm long (ISO 4121), orientated by descriptions on both ends (Table 1); the sensory values were converted into p. c. (%) of the average value before the cluster analysis.
Statistical analysis. The two-way analysis of variance, the one-way ANOVA, regression analysis, and cluster analysis were applied using the software Microsoft STATISTICA 7.0; the replicates were treated as dimensions in ANOVA; the probability level was fixed at P = 0.95, unless otherwise stated (they were usually much lower). Multicompo-nent functions were applied in such cases when a maximum or a minimum was observed; in the latter cases, regressions were calculated using the software SigmaPlot (Systat Software Inc.).
RESULTS AND DISCUSSION Design of the experiments
All samples of yoghurt mayonnaise had the same composition, differing only in the content of xanthan as the thickening agent. As xanthan is sensorily neutral, the flavour should be nearly the same in all samples. Xanthan is commonly used as a thickener in mayonnaise, dressings and other oil-in-water emul-sions. It inhibits the oil droplets fusion (Tanaka & Fukuda 1976). The samples were prepared in a pilot plant equipment of the manufacturing plant in the same way as in the case of commercial samples. Eleven samples with various rheological properties were tested at 15, 20, and 25°C so that a matrix of 33 cases was obtained for statistical evaluations, but elasticity was tested in 21 cases only, at least once in every sample. The range of values obtained in the analysis of the parameters used is shown in Table 2. Rheological analyses were repeated four times. The values called repeatabilities in Table 2 are the respective standard deviations. Xanthan did not affect the sensory analysis of the flavour acceptability.
[image:3.595.62.291.83.259.2]Because of the complicated composition of yo-ghurt mayonnaise (two different oil-in-water emul-sions mixed together), large differences between duplicates were observed (Table 2, showing average differences between ratings of different asses-sors at the same session). Therefore, the sensory analysis was repeated 18 times in order to obtain lower standard deviations of average values; the sessions took place on different days, but at the same time and with the same assessors.
Table 1. Texture profile design
Code Descriptor used End of the scale
left right
A ladling of the sample with a spoon very thin very thick
B viscosity perceived immediately after ingestion in the mouth thin thick
C viscosity perceived in the mouth after a few movements with the tongue thin thick
D viscosity perceived at pressing the sample against the palate thin thick
E overall texture acceptability bad excellent
F spreadability on a slice of white bread bad excellent
G expressive flavour faint outstanding
H expressive flavour on a slice of white bread faint outstanding
J overall flavour acceptability bad excellent
Figure 2. Mechanical spectrum of yoghurt mayonnaise examined, G' = storage modulus (Pa), G''= loss modulus
(Pa), G* = complex modulus, δ = phase angle (o), τ =
ap-plied stress (Pa)
[image:3.595.70.534.570.760.2]G’ = f (τ) G’’= f (τ) |G*| = f (τ) δ = f (τ)
G
’, G
’’,
G
*
(
Pa
),
δ
(
o) 1000
100
10
1
1 10 100 1000
Relations between rheological parameters
The yield values and apparent viscosities were interrrelated (Figure 3). The regression is nearly linear because of relatively narrow ranges of rheo-logical parameters studied. Both the linear and the semilogarithmic regressions were statistically significant (Table 3) as the differences were very small in the narrow interval of 15–25°C studied. A larger temperature range hardly occurs in practical applications. Thixotropy correlated neither with the yield value, nor with the apparent viscosity. In the investigation of elasticity, storage and loss moduli were linearly related to each other (Table 3) but not to the apparent viscosity. Similarly, the shear rate was linearly correlated neither with the yield value nor with the apparent viscosity. Stor-age and loss moduli were exponentially related to each other (Figure 4) while the shear stress τ
[image:4.595.65.535.100.446.2](stress sweep) was linearly related to the yield value. Mayonnaises are regarded, from the rheo-logical aspect, as thixotropic viscoplastic bodies
Table 2. Ranges of analytical parameters and repeatabilities of determination
Analytical parameter Range at 15°C Range at 20°C Range at 25°C Repeatability
Rheology
Yield value (Pa) 87–130 69–106 55–87 ± 4
Apparent viscosity (Pa·s) 1.20–1.81 1.10–1.38 0.99–1.35 ± 3
Thixotropy (Pa/s) 640–1900 890–2730 730–2650 ± 4
Elasticity
Storage modulus* (Pa) 910–1200 230–270 135–180 ± 3
Loss modulus* (Pa) 80–97 35–40 20–30 ± 3
Phase angle* 1.3–8.7 ± 3
Shear stress** (Pa) 85–140 ± 3
Sensorics***
A (mm) 103–117 91–117 84–109 17–31
B (mm) 84–146 87–122 89–103 16–33
C (mm) 78–113 72–97 78–100 13–32
D (mm) 62–94 73–99 71–98 19–34
E (mm) 87–123 83–115 82–116 16–31
F (mm) 115–132 117–136 111–138 10–24
G (mm) 98–128 107–126 111–127 13–26
H (mm) 87–113 94–115 96–109 12–31
J (mm) 74–115 88–105 64–102 25–35
*measured at 0.1 Hz; **measured at 1.0 Hz; ***Codes A–J are explained in Table 1; mm = mm of the graphical scale, measured from the left end; repeatabilities of rheological parameters are expressed as standard deviation values (%), repeatabilities of sensory characteristics are expressed as average differences (mm of the scale)
yȱ=ȱ0.1264Ln(x)ȱ–ȱ0.4496 0.00
0.04 0.08 0.12 0.16 0.20
60 70 80 90 100 110 120
Yieldȱvalueȱ(Pa)
Log
ȱa
pp
ar
en
tȱv
is
co
si
ty
ȱ
[image:4.595.305.530.562.726.2](Ford et al. 2004). On the contrary, yoghurts are not thixotropic (Brummer 2006); due to greater deformation, the absolute values of both moduli G' and G'' decrease sharply and the loss modulus G'' becomes larger than the storage modulus G''. After a sudden return to a smaller deformation, the relationship reversed very quickly at the be-ginning, but the final values never reached the baseline condition. The behaviour is called “ir-reversible thixotropy” – structure breakdown (German “unechte Thixotropie”), but the two terms are not distinguished in English. Therefore, the time dependence is very evident (Mullineux & Simmons 2007), even when the process is not completely reversible. It is interesting that a rela-tively high addition of 15% yoghurt did not affect the thixotropy of modified mayonnaise.
Temperature dependence of rheological and textural parameters
Both the yield value and the apparent viscosity decreased significantly with increasing temperature as could be expected. The linear relation gave a better fit in the case of the yield value (R2 = 0.5510,
n = 33, P < 0.0005) while semilogarithmic relation was found more probable in the case of the appar-ent viscosity (R2 = 0.4844, n = 33, P < 0.0005). The
relationships between the store modulus or the loss modulus were semilogarithmic (R2 = 0.3955,
n = 21, P = 0.02, and R2 = 0.2932, n = 21, P =
0.035, respectively). The relation between the shear stress and the temperature was linear (R2 =
0.4184, n = 21, P = 0.002). No sensory character-istic was temperature dependent (in the range studied), which could be expected because of the too narrow temperature range studied. Small
temperature differences are always perceived with difficulty in sensory evaluations as the sample temperature rapidly changes in the contact with mucosa of the oral cavity, and the results are also modified by the action of association centres in the brain. However, it could be expected that in a broader range of temperatures, both rheological and sensory characteristics would be significantly influenced.
Relationships between sensory characteristics
Regressions between sensory characteristics have usually low R2 coefficients as the differences
[image:5.595.64.533.101.248.2]between individual assessors were large. Sensory characteristics have a hedonic character so that the results should be taken as they have been col-lected, and all the values obtained, including the outliers, should be accounted for. Therefore, it is generally not possible to replace a sensory method by another, or to simplify the sensory profile. We
Table 3. Relationships between different rheological parameters
Independent
variable Dependent variable Regression equation Number of cases R2 value Significant probability
Yield value apparent viscosity ηA = 0.8 + 0.005 τ0 33 0.504 < 0.0005
Yield value apparent viscosity log ηA = 0.0014 τ0 – 0.0064 33 0.539 < 0.0005
Yield value apparent viscosity log η0 = 0.36 log τ0 – 0.60 33 0.537 < 0.0005
Storage modulus* loss modulus* G'' = 0.46 G' – 145 21 0.502 < 0.0005
Storage modulus* loss modulus* G'' = 22.4 exp (0.015 G') 21 0.737 < 0.0005
Storage modulus* phase angle* δ = 7.78 exp (0.003 G') 21 0.616 < 0.0005
Loss modulus* phase angle* δ = 8.5 exp (0.0007 G'') 21 0.603 < 0.0005
*measured at 0.1Hz
Figure 4. Relationship between the loss modulus and the storage modulus
y ȱ=ȱ22.392e0.0015x
0 500 1000 1500 2000 2500
0 1000 2000 3000 4000
LossȱmodulusȱGȇȇȱ(Pa)
St
or
ag
eȱ
m
od
ul
us
ȱG
ȇȱ(
Pa
)
[image:5.595.307.531.566.724.2]give the probability value at least, when the rela-tionship is still statistically significant.
The relationships between different sensory characteristics were mainly linear as could be expected when unstructured graphical scales were used for the intensity ratings (Table 4). After McBride (1985) the relation between the intensity of the stimulus and the intensity of the percept are linear, except the extreme values on either end of the unstructured graphical scale. In all cases, semilogarithmic relations were very close to linear relations, therefore, the values are not given here. Obviously, in such a narrow temperature range, linear and semilogarithmic courses are very close to one another. Because of the great variability of the sensory results and the included extraneous results, at least 10 assessors are recommended for the sensory testing (18 were used in our experi-ments). The R2 coefficients are, naturally, lower
than in the case of rheology measurements; as
given in tables and figures, probabilities of er-ronous conclusions were quite low.
[image:6.595.63.292.82.247.2]Sensory characteristics may be divided into two groups, illustrated by the cluster analysis (Figure 5). The texture acceptability is best estimated on the basis of the ladling of the sample with a spoon (descriptor A) and the viscosity perceived within 2–3 s after ingestion of the sample in the mouth (descriptor B), when the temperature changes only a little, and about in the same extent in all samples analysed. The values obtained after several move-ments of the tongue or after pressing the sample against the palate behave differently, obviously due to the effect of saliva. According to Borwankar (1992), the sensory texture evaluation is based on the attributes observed both before the sample ingestion and the mouthfeel. The behaviour of the morsel after a few movements of the tongue (descriptor C) and at pressing the sample against the palate (descriptor D) is more related to the
Table 4. Linear relationships between sensory characteristics (N = 33) Independent
variable Dependent variable Regression equation R2 value Significant probability
A B B = 1.11 A – 9.8 0.536 < 0.0005
A J J = 111 – 0.067 A 0.229 0.005
B C C = 1.11 B – 9.8 0.181 0.014
D E E = 0.47 D + 44.3 0.204 0.008
J E J = 0.67 E + 22.8 0.379 < 0.0005
F H H = 110 – 0.087 F 0.310 0.001
F G G = 64 – 0.42 F 0.195 0.010
B E E = 0.226 + 94 E 0.300 0.001
F J J = 134 – 0.38 F 0.310 0.001
Codes of sensory characteristics are explained in Table 1
Eucledian distance
Se
ns
or
y
ch
ar
ac
te
ri
st
[image:6.595.64.537.567.736.2]ic
Figure 5. Cluster analysis of sensory characteristics
Prom 9, A = shuffling with a spoon
Prom 10, B = viscosity perceived after ingestion in the mouth Prom 13, E = texture acceptability
Prom 16, H = expressive flavour on a slice of bread Prom 14, F = spreadability
Prom 15, G = expressive flavour on direct consumption (without bread)
Prom 17, J = flavour acceptability
Prom 11, C = viscosity perceived in the mouth after several movements with the tongue
flavour acceptability, similarly as the spreadabil-ity (descriptor F). The flavour is linearly related to the texture acceptability (Figure 6), as it was found in our earlier experiments (Štern et al. 2006, 2007).
Relationships between rheological and sensory parameters
While rheological measurements give an infor-mation on intensities, the procedures of sensory analysis have always a hedonic character, deal-ing with acceptancies. Therefore, the relations between rheological and sensory characteristics have lower R2 coefficients than that between two
rheological analyses, not allowing to substitute a sensory method with a simpler and more rapid
instrumental method. They can only serve as a preliminary orientation. In this aspect, our results only confirm general experience, at least in the case of unknown samples. However, in the case of developing the optimum recipe of a product, when the composition of the samples compared is relatively similar, it is possible to use faster and less expensive rheological methods for the pre-liminary testing, leaving the sensory evaluation only for the samples near the optimum.
Most sensory characteristics were related to thix-otropy; both the linear relationships and semiloga-rithmic relationships were statistically significant (Table 5), and the respective R2 values differed only
moderately. In some cases, the linear regression fitted better with the experimental data, in other cases, semilogarithmic relations fitted better, but the differences were not crucial. The resistance to pressing the sample against the palate was nearly linearly correlated with thixotropy. The relation between thixotropy and the spreadability was more complicated, showing maximum values between the thixotropy of 1200–2200 Pa/s (Figure 7).
Other rheological data also correlated with sen-sory characteristics, i.e. semilogarithmic relation-ship was found between the ladling with a spoon and the logarithm of the yield value (A = 29 + 38.7 log τ0 (n = 33; R2 = 0.165; P = 0.019), or between
the apparent viscosity and the spreadability (log ηA = –0.0001F2 + 0.0337F – 1.926; R2 = –0.130;
P = 0.039) with a flat maximum at log ηA = 0.12 as shown in Figure 8. No significant relationships
yȱ =ȱ0.5125xȱ+ȱ55.221
60 80 100 120 140
60 70 80 90 100 110 120
Flavourȱ(mm)
Te
xt
ur
e
ȱ
ac
ce
pt
ab
ili
ty
ȱ
[image:7.595.64.291.81.223.2](mm)
Figure 6. Relationship between the flavour and the texture acceptability (R2 = 0.3790; P = < 0.0005)
Table 5. Relationship between the thixotropy and sensory characteristics (N = 33)
Dependent variable Regression expression R2 value Significant probability
A A = 96 + 0.006 ThA = 47 + 18.3 log Th 0.1770.153 0.0150.024
B B = 90 + 0.011 Th 0.301 0.001
C C = 44 + 13.6 log Th 0.285 0.001
D D = 74 + 0.0076 Th 0.293 0.001
E E = 96 + 0.006 ThE = 37 + 21.7 log Th 0.1230.160 0.0450.021
F F = 119 + 0.0057 ThF = 69 + 18.8 log Th 0.2950.198 0.0020.010
J J = 82 + 0.0077 ThJ = 10 + 26.7 log Th 0.1700.196 0.0170.010
[image:7.595.67.534.531.736.2]were found between the storage or loss modulus and the sensory characteristics, as already resulted from the cluster analysis, however, the shear stress τ was closer to the flavour acceptability and some other sensory characteristics than to elasticity or to rheological characteristics.
The discussion contains no mentions of comparing the results of our experiments with those of other authors, due to the absence of products of this type from other producers. The effect of xanthan on the flavour was not taken into account, as the substance was found sensorically neutral in preliminary ex-periments. All samples could thus be considered as samples of identical composition.
CONCLUSION
Rheological and sensory textural characteristics of mayonnaise modified by the addition of yoghurt showed relations similar to those in other food emul-sions. Most of the rheological characteristics were interrelated, while the textural characteristics behaved as independent variables in a majority of cases. Due to the narrow temperature interval studied, the effect of temperature on the texture was insignificant. Sen-sory characteristics were often related to thixotropy. Rheological data could be used only for preliminary information, but could not be used for the texture evaluation instead of a sensory method.
References
Bieri M. (2005): Fondue mayonnaise. DE 10331814 A1.
Berjano M., Munoz J., Guerrero A., Flores V., Galle-gos C. (1990): Comportamiento viscoelástico dinámico de mayonasas comerciales. Revista de Agroquímica y Tecnología Alimentaria, 30: 481–491.
Borwankar R.P. (1992): Food texture and rheology. Journal of Food Engineering, 16: 1–16.
Brummer R. (2006): Rheology Essentials of Cosmetic and Food Emulsions. Springer, Berlin, Heidelberg, New York: 166.
Ford L.D., Borwankar R.P., Pechak D., Schwimmer B. (2004): Dressings and sauces. In: Friberg S.E., Larsson K., Sjöblom J. (eds): Food Emulsions. 4th Ed.
Marcel Dekker, New York, Basel: 525–572.
Friberg S., Larsson K., Sjoblom J. (2003): Food Emul-sions. 4th Ed. CRC Press, Boca Raton.
García Y., Batista A.R., Rodríguez J.L., Lima R., Ro-dríguez I., Yanez Y. (2002): Studies on keeping quality of a mayonnaise type dressing made with powdered soymilk. Alimentaria, 329: 73–76.
García Y., Navarro F.B., Berjano-Nunez M., Gal-legos-Montes C. (1988): Rheology of mayonnaises. Grasas y Aceites, 39: 181–185.
Guadalupe-Johnston M., Navarro V.M.M., Brutti N.I., Nepote V., Grosso B.R., Guzmán C.A. (2003): Argentinean peanut sauce similar to mayonnaise: chemical, nutritional and sensorial aspects. Grasas y Aceites, 54: 7–11.
Lee Y.-Y. (2001). Effect of size distribution of oil particles with emulsifiers and stabilizers on the emulsion stability of mayonnaise. Journal of the Korean Society of Food Science and Nutrition, 30: 204-209
McBride R.L. (1985): Sensory measurement: An in-troductory review. CSIRO Food Research Quarterly,
45: 59–63.
500 1000 1500 2000 2500 3000
Thixotropy (Pa/s)
Sp
re
ad
ab
ili
ty
(m
m
)
120 110
100 90
80
70
60 50
[image:8.595.64.295.81.252.2]40
Figure 7. Relationship between the thixotropy and the
spreadability (R2 = 0.2150; P = 0.007) Figure. 8. Relationship between the spreadability and the logarithm of apparent viscosity (R2 = 0.1502; P = 0.026)
yȱ =ȱ3EȬ06x3ȱ–ȱ0.0011x2ȱ+ȱ0.1592x ȱ–ȱ7.1239
0.02 0.06 0.10 0.14 0.18
100 105 110 115 120 125 130 135 140 Spreadabilityȱ(mm)
Log
ȱa
pp
ar
en
tȱv
is
co
si
ty
2
1710 ln 5 .0 –
103 ¸¸¹ · ¨¨ ©
§ x
[image:8.595.304.531.89.246.2]Mullineux G., Simmons M.J.H. (2007): Effects of process-ing on shear rate of yoghurt. Journal of Food Engineer-ing, 79: 850–857.
Muñtoz J., Sherman P. (1990): Dynamic viscoelastic properties of some commercial salad dressings. Journal of Texture Studies, 21: 441–456.
Raymundo A., Nunes C., Franco J.M., Empis J., Sousa I. (2002a): White lupin protein as an ingredient to pro-duce egg-free mayonnaise and salad dressings. Food Industry Journal, 5: 322–329.
Raymundo A., Franco J.M., Empis J., Sousa I. (2002b): Optimization of the composition of low-fat oil-in-water emulsions stabilized by white lupin protein. Journal of American Oil Chemists’ Society, 79: 783–790. Siebenhandl S., Wagner M., Berghofer E. (2002):
Improving the stability of mayonnaise by addition of fermented peas. Ernährung, 26: 306–311.
Štern P., Valentová H., Pokorný J. (2001): Rheological properties and sensory texture of mayonnaise. European Journal of Lipid Science and Technology, 103: 23–28. Štern P., Panovská J., Pokorný J. (2006): Psychorhe-ology of tartar sauce. Journal of Texture Studies, 37: 580–596.
Štern P., Míková K., Pokorný J., Valentová H. (2007): Effect of oil content on the rheological and textural properties of mayonnaise. Journal of Food and Nutri-tion Research, 46: 1–8.
Tanaka M., Fukuda H.. (1976): Studies of the texture of salad dressings containing xanthan gum. Canadian Institute of Food Science and Technology Journal, 9: 130–134.
Vaikousi H., Biliaderis C.G. (2005): Processing and formulation effects on rheological behaviour of barley β-glucan aqueous dispersions. Food Chemistry, 91: 505–516.
Wendin K. (2001): Sensory dynamics in emulsion products differing in fat content. SIK Report, 679: 1–160. Yang S.C., Lai L.S. (2003): Dressings and mayonnaise.
In: Caballero B., Trugo L.C., Finglas P.M. (eds): Encyclopedia of Food Sciences and Nutrition. 2nd Ed.
Elsevier Science, Amsterdam: 1893–1903.
Received for publication March 12, 2007 Accepted after corrections November 7, 2007
Corresponding author:
Doc. RNDr. Petr Štern, CSc., Ústav pro hydrodynamiku AV ČR, v.v.i., Pod Paťankou 30/5,166 12 Praha 6, Česká republika