Molecular Dynamics Simulation on Anelasticity under Tensile
and Shearing Stresses in Single Component Amorphous Metal
Kazutaka Fujita
1, Junji Ohgi
2, Vasek Vitek
3, Tao Zhang
4and Akihisa Inoue
51
Department of Mechanical Engineering, Ube National College of Technology, Ube 755-8555, Japan
2Department of Mechanical Engineering, Yamaguchi University, Ube 755-8611, Japan
3Department of Materials Science and Engineering, University of Pennsylvania, Philadelphia, PA 19104, US
4School of Material Science and Engineering, Beijing University of Aeronautics and Astronautics, Beijing 100083, China 5Institute of Materials Research, Tohoku University, Sendai 980-8577, Japan
In this study, the nanoscopic deformation behavior in single amorphous during loading-unloading process under tensile and shearing stresses were analyzed by the molecular dynamics method and were compared with the earlier experimental results where an anelastic behavior was not shown in tensile stress but in shearing stress. In this study a clear anelastic deformation was shown in the shearing stress. However, it didn’t occur in the tensile stress. This corresponds to the earlier experimental result. When an abrupt strain increase in the stress–strain curve was exhibited, the potential energy and atomic volume has been increased suddenly. This result indicates that the anelastic response of the amorphous metal in the shearing stress was generated by local phase transformation.
(Received June 23, 2005; Accepted October 3, 2005; Published December 15, 2005)
Keywords: molecular dynamics simulation, anelasticity, amorphous metal, bulk metallic glass, tensile stress, shearing stress, voronoi polyhedra
1. Introduction
It has been known that an anelastic behavior occurs more remarkably for amorphous thin films than that for metallic crystals under tensile stress.1) In earlier studies of authors, tensile and shearing tests were performed with round bar type test specimens of La-, Pd- and Zr-based bulk glassy alloys to investigate the anelastic behaviors under tensile and shearing stresses in these materials. According to these tests, the anelastic behavior hardly occurred under the tensile stress, but a remarkable anelastic behavior appeared under the shearing stress even in small stress level and the tendency was stronger in higher shearing stress level.2)Although such the anelastic behavior is unique in the glassy alloys, their detail has not been clarified. In this study, the nanoscopic deformation behaviors in single amorphous during loading-unloading process under tensile and shearing stresses were analyzed on the basis of the molecular dynamics (MD). Then the anelastic deformations in glassy alloy were evaluated from the calculated and experimental results mentioned above.
2. Calculation
2.1 MD simulation
Molecular dynamics (MD), in which the Newton’s equation of moving is made for all atoms/molecules consisted in a system and the locations and/or velocities of each particle were calculated numerically integrating the above equation, have been developed as the effective way to analyze the macroscopic property in the system.
In this study, the MD simulation was performed with the Finiss–Sinclar potential (FS potential)3) for Cu through Parinello–Rahman algorithm4) and the constant pressure condition, which is the hydrostatic pressure 0.1 MPa, was considered. As the boundary condition, the cyclic boundary
condition was employed, and temperature was controlled using the velocity scaling method. Numerical integral based on predictor-corrector method was applied to the equation of motion where the time step was21015s.
2.2 Production of amorphous solid
As the unit cell, a cubic which includes 500 Cu atoms taking fcc crystalline structure was constructed at the beginning. Then the model melted by heating from 0 to 3500 K with 500 K steps under the condition in which the shape similarity of the unit cell is kept regardless of expansion and contraction (uniform condition).5)After that, the temperature was dropped rapidly to 0 K at a cooling rate of 1:01014 (K/s). Relaxation for 10,000 steps (1 step =
1 fs) was applied to the model where the temperature was set to 0 K every 200 steps, and additional relaxation for 10,000 steps was given without controlling system temperature. Again, relaxation for 10,000 steps was applied under the condition where angles in the three sides of the unit cell are set to be perpendicular to each other, but deformations inx-,
y- andz-directions are independent (fixed angle condition),5) and additionally relaxation for 10,000 steps was given without controlling the temperature also. Finally, amorphous solid was produced without any condition for keeping the shape similarity and the angles of 90in three sides of the unit cell (general condition).5)
2.3 Application of loading and unloading
Reversed tensile and shearing loading were applied to the produced crystal and amorphous model using the Parinell-Rahman algorithm by which not only hydrostatic pressure but also general external loading is effectively applied to the model.4)
The equation of motion for cell shapehis given by
Whh€ ¼ imvivi
X
i
X
j>i
dðri jÞ
ri j
1
ri j
ri jri jpV
( )
ðhTÞ1h ð1Þ
Whereis related to the external stressSand is given by following equation.
¼h01ðSpÞðhT0Þ1V0 ð2Þ
The stress S is calculated by giving , h0 and V0 to
the equation (2).
The strain"is calculated by
1
2fðh T
0Þ
1Gh1
0 1g; ð3Þ
whereh0is the cell shape after relaxation, andGis the metric
tensor which is obtained by multiplying the vector of the unit cell and the transposed vector of it.
Both in the tensile and shearing loading (or unloading), the incremental stress was set to be 0.2 GPa, however, extremely small incremental stress was given for specific period during shearing loading-unloading process.
3. Results and Discussion
3.1 Stress–strain response
3.1.1 Simulation with large stress increment
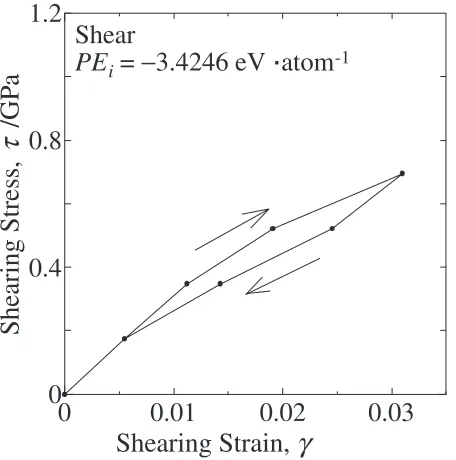
[image:2.595.313.539.70.291.2]Calculated stress–strain responses under tensile and shearing loading-unloading in amorphous solid are shown in Figs. 4 and 5. In these calculations, the stress increment is 0.2 GPa. While the stress–strain response in loading process coincides with the one in unloading process in tensile deformation, the stress–strain hysteresis, namely anelastic behavior, is shown in shearing deformation. This tendency coincides with the experimental results which were obtained from shearing and tensile test for round bar specimen of bulk glassy alloy and are shown in Figs. 6 and 7.2) The stress– strain relations are also calculated for crystal model with same procedure as for the amorphous model. The calculated stress–strain relations under tensile and shearing stress are shown in Figs. 8 and 9, respectively. In crystal model, an anelastic deformation is not confirmed even in shearing deformation for the same stress–strain paths both in the loading and unloading processes.
Table 1 shows the calculated Young’s modulusEin [100], [110] and [111] directions, and modulus of transverse
0
1000
2000
3000
12
14
16
18
Cu (500 Atoms at 0.1MPa)
Uniform dilation
General dilation
−
10
13−
10
14−
10
15K
.
SK
.
SK
.
S-1Temperature, T / K
V
o
lume per
Atom,
V
/ Ang
3
-1 -1
Fig. 1 The relationship between the volume and temperature.
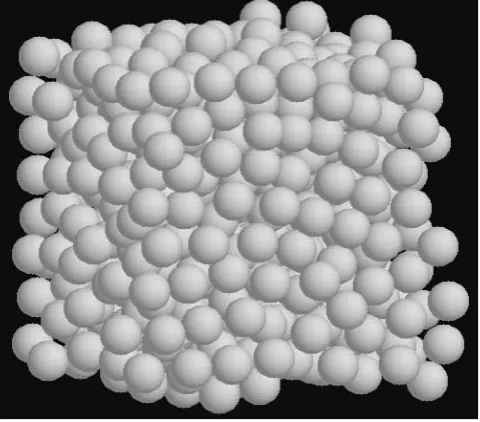
Fig. 2 The three-dimensional view of the amorphous solid model.
1
2
3
0
1
2
3
Cu
r / a
g(r)
Amorphous 0K
Liquid 2000K
[image:2.595.57.287.71.297.2] [image:2.595.50.290.344.555.2]elasticity G in [010] direction on (100) plane. The exper-imental data are also indicated in this table. The validity of this simulation could be clarified from the similarity between calculated and experimental data.
3.1.2 Simulation with small stress increment
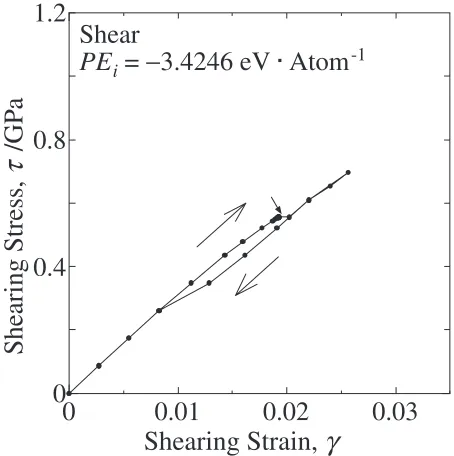
In order to investigate the influence of relatively large stress increment of 0.2 GPa on the results shown in last section, the stress increment of 0.1 GPa is adopted and the smaller stress increment less than 0.1 MPa is adopted for the region where the gradient in stress–strain relation is small. The shearing stress and strain relation calculated with 0.1 GPa step is shown in Fig. 10. At the region pointed by
small arrow, the strain quickly increase despite of small stress increase. This response could be generated because of the anelastic behavior.
3.2 Potential energy and average atomic volume The potential energy (PE) and average atomic volume (V) were calculated from the simulation with 0.1 GPa stress increment, and are plotted against shearing stress in Figs. 11 and 12, respectively. According to Fig. 11, PE
rapidly increases with rapid strain increase as shown in Fig. 10. V decreases just before the rapid increase of the strain and then increase remarkably as shown in Fig. 12.
0
0.01
0.02
0.03
0
0.4
0.8
1.2
Tension
PE
iT
ensile Stress,
Tensile Strain,
ε
-1
σ
/GP
a
=
−
3.4246 eV
.
atom
Fig. 4 The stress–strain curves in the amorphous model under the tensile loading and unloading.
τ
0
0.01
0.02
0.03
0
0.4
0.8
1.2
Shear
PE
i=
−
3.4246 eV
.
atom
-1Shearing Stress,
/GP
a
Shearing Strain,
γ
Fig. 5 The stress–strain curves in the amorphous model under the shearing loading and unloading.
0
0.002
0.004
0
100
200
La based metallic glass
σ
max/
σ
B= 20
(%)T
ensile Stress,
σ
/GP
a
Tensile Strain,
ε
Fig. 6 The experimental stress–strain curves in the bulk glassy alloy under the tensile loading and unloading.
0
0.01
0
100
La based metallic glass
τ
max/
τ
B= 29 (%)
Shearing Stress,
τ
/GP
a
Shearing Strain,
γ
[image:3.595.315.543.71.295.2] [image:3.595.60.287.74.301.2] [image:3.595.315.542.354.582.2] [image:3.595.59.287.360.590.2]After unloading, PE almost returns to the value before loading as shown in Fig. 11. It was also similar onV. When the phase transformation in changing from the solid to the liquid occurs, rapid change is shown inPEandV. In general, anelastisity is generated by the relaxation or the trans-formation. The above numerical results support that the anelastic behavior in amorphous solid occurs because of the transformation rather than the relaxation. Since the amount of the increment inPEandV is quite small, the transformation could occur locally.
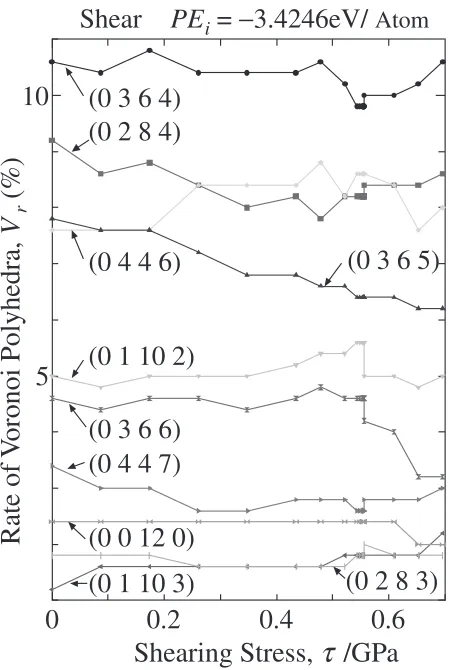
[image:4.595.59.282.70.295.2]3.3 Voronoi polyhedra analysis
Figure 13 shows relation between the rate of voronoi polyhedra to total voronoi polyhedra (500 samples) and
T
ensile Stress,
σ
/GP
a
Tensile Strain,
ε
Fig. 8 The stress–strain curves in the crystal under the tensile loading and unloading.
Shearing Stress,
τ
/GPa
Shearing Strain,
γ
(100), [010]
[image:4.595.315.542.75.303.2]Fig. 9 The stress–strain curves in the crystal under the shearing loading and unloading.
Table 1 Modulus of longitudinal elasticity (Young’s modulus) and modulus of transverse elasticity (modulus of rigidity) obtained using by the MD simulation in the crystalline Cu model.
Modulus of longitudinal elasticity Modulus of transverse elasticity
Tensile Es Eo Es/Eo Shearing plane Gs Go Gs/Go direction GPa GPa (%) and direction GPa GPa (%)
[100] 63.7 66.7 95.5 (100)–[010] 78.7 75.2 104.7
[110] 130.7 130.3 100.3 Polycrystal — 48.3 —
[111] 191.6 191.1 100.3
Polycrystal — 129.8 —
Es,Gs: Modulus obtained by MD simulations.
Eo,Go: Modulus obtained by Experiments.6Þ
0
0.01
0.02
0.03
0
0.4
0.8
1.2
Shear
PE
i=
−
3.4246 eV
.
Atom
-1Shearing Strain,
γ
Shearing Stress,
τ
/GP
[image:4.595.58.281.348.581.2]a
Fig. 10 The stress–strain curves in the amorphous model under the shearing loading and unloading with small increment.
0
0.2
0.4
0.6
0.8
−
3.425
−
3.424
Shear
PE
i=
−
3.4246 eV
.
Atom
-1Potential Ener
gy
,
PE
/eV Atom
-1
[image:4.595.312.538.363.575.2]Shearing Stress,
τ
/GPa
.
[image:4.595.46.292.668.765.2]shearing stress . The larger ten voronoi polyhedra at
¼0MPa are picked up, and the variations of these voronoi polyhedra in loading process are indicated in this Figure. In the region where the strain rapidly increases, some voronoi polyhedra rates, e.g.(0 3 6 6) and (0 11 0 2), decrease or increase rapidly, however, other voronoi polyhedra vary gradually, e.g. (0 3 6 5) and (0 0 12 0). Hence the transformation during loading process is not fully clarified by this voronoi polyhedra analysis.
4. Conclusions
MD simulation was performed to analyze anelastic behav-ior in Cu amorphous solid during loading-unloading process in tension/shearing deformation. The obtained results are as follows.
(1) A clear anelastic deformation was shown under the shearing stress, while it didn’t occur under tensile stress. This result was in good agreement with the experimental data obtained from tension and torsion test for bulk glassy alloys.
(2) Abrupt variations in potential energy and atomic volume in the region where the shearing strain increas-ed rapidly were confirmincreas-ed through the simulation with small stress increment. This indicates that a local phase transformation which is related to anelastic deformation occurs in this region.
Acknowledgement
This work was founded by a Grant-in-Aid for Scientific Research (A) from the Japan Society for the promotion for Science and a Grant-in-Aid for Scientific Research on Priority Areas (Material Science of Bulk Metallic Glasses) from the Ministry of Education, Culture, Sports, Science and Technology, and was performed under the inter-university cooperative research program of Metallic Glasses Research Centre, Institute for Materials Research, Tohoku University.
REFERENCES
1) T. Masumoto: Sci. Rep. RITUA-26(1977) 1625.
2) K. Fujita, A. Inoue, Tao Zhang and N. Nishiyama: Mater. Trans.43
(2002) 1957–1960.
3) M. W. Finnis and J. E. Sinclair: Philos. Mag. A50(1984) 45–55. 4) M. Parinello and A. Rahman: J. Appl. Phys.52(1981) 7182–7190. 5) S. Nose and M. L. Klein: Mol. Phys.50(1983) 1055–1076.
6) R. W. Hertzberg:Deformation and Fracture Mechanics of Engineering
Materials, (JOHN WILEY & SONS, 1989) pp. 7–15.
0.5
0.6
12.6696
12.6698
12.67
V
olume,
V/
Ang
Atom
Shear
PE
i=
−
3.4246
eV
.
Atom
-1
3-1
Shearing Stress,
τ
/GPa
[image:5.595.57.280.74.282.2].
Fig. 12 The relationship between the volume and shearing stress.
0
0.2
0.4
0.6
5
10
Shear
PE
i=
−
3.4246eV/
Atom
(0 3 6 4)
(0 2 8 4)
(0 4 4 6)
(0 3 6 5)
(0 1 10 2)
(0 3 6 6)
(0 4 4 7)
(0 0 12 0)
(0 1 10 3)
(0 2 8 3)
Rate of
V
oronoi Polyhedra,
V
r(%)
Shearing Stress,
τ
/GPa
[image:5.595.58.283.329.664.2]