Texture Analysis and Properties of Rapidly Solidified Ti
52Ni
38Cu
10Shape Memory Alloy
Venky Saravanan
1, Anak Khantachawana
2and Shuichi Miyazaki
2 1Makino Asia Pte Ltd., 2 Gul Avenue, Singapore Jurong, 629649
2Institute of Materials Science, University of Tsukuba, Tsukuba 305-8573, Japan
Texture of Ti52Ni38Cu10rapidly solidified ribbons was investigated. Characterization of some of the properties such as transformation temperatures, deformation behavior, transformation strain, microstructure etc. was also carried out for the rapidly solidified ribbons in as-spun condition and after heat-treatment at 1073 K. The transformation temperatures of the ribbon specimens are found to be less than those of ingot specimens. spun ribbons were found to be slightly amorphous in nature, while after heat-treatment they became completely crystalline. As-spun and heat-treated ribbons show strongh200ifiber texture. From the thermomechanical studies it was observed that the hysteresis of the heat-treated ribbon specimen decreased whereas the transformation strain and the transformation temperatures showed an increase with increase in stress.
(Received December 1, 2003; Accepted December 26, 2003)
Keywords: titanium-nickel-copper, shape memory effect, rapid solidification, texture, transformation strain
1. Introduction
Ti-Ni shape memory alloys are of commercial importance due to their formability, high recovery and biocompatibil-ity.1–5) The addition of even very small concentrations of many third elements to Ti-Ni results in a large change inMs
temperature. In contrast, substitution of a large concentration of Cu does not change the Ms temperature significantly.
Among the many elements, Cu was found to be the most effective element to improve the pseudoelasticity. Moreover, alloys with more than 20 at% Cu have a substantially narrower hysteresis and have higher yield strength than binary alloys.6)The narrower hysteresis of Ni-Ti-Cu alloys
has practical importance. Applications requiring a short response time on thermal cycling are easier to realize with such narrow hysteresis alloys.
Rapidly solidified ribbons provide fine grained structures with minimum processing steps thereby reducing the cost. Moreover, rapidly solidified ribbons have the edge over deposited thin films due to their controlled composition. The strain recoverable by shape memory effect, namely, shape memory strain, depends on crystal orientation. In practical polycrystalline materials, crystallographic textures accord-ingly influence the shape memory effect, resulting in planar anisotropy of shape memory strain. Higher shape memory strains at certain directions can be made possible by developing the most favorable preferred orientations through texture control. It is very important to study the texture of the rapidly solidified ribbon specimens in order to obtain maximum transformation strain in the desired direction for microactuator applications. So far very few results have been published on rapidly solidified Ti-Ni shape memory
al-loys7–11) and no systematic study has been performed to
explore the nature of texture. In this paper, we explore the nature of texture in rapidly solidified Ti52Ni38Cu10 shape
memory ribbons with the aid of pole figures and orientation distribution functions.
2. Experimental
A Ti52Ni38Cu10 alloy ingot was prepared by arc melting
utilizing high pure metals (99.7 mass%Ti, 99.99 mass%Ni and 99.99 mass%Cu) on a water-cooled copper hearth under argon atmosphere. The ingot was inverted and melted six times in order to increase the homogeneity. The ingot was cut into small pieces with spark-cutting machine. The oxide layers of the cut alloy pieces were mechanically cleaned with emery papers and later chemically with solution of HF:HNO3:H2O (1:4:5). The alloy was rapidly quenched in
an argon atmosphere using a melt spinning machine where the mother alloy was induction melted in a quartz crucible and ejected with a pressurized argon gas out of a 0.4 mm orifice onto a copper roller (diameter of 200 mm) rotating at a surface velocity of 42 ms1 (4000 rev min1). Ribbons of
[image:1.595.304.548.731.784.2]15mm thickness and 1mm width were produced. The chemical composition of the mother ingot and the rapidly solidified ribbons were measured using Electron Probe Micro Analysis (EPMA). The measured values are listed in Table 1. The transformation temperatures of the ingot and the melt spun ribbon specimens after heat-treatment at 1073 K for 3.6 ks were measured through a Differential Scanning Calorimeter (DSC) under helium atmosphere. The heating and cooling rate of the specimens during the DSC measure-ment was maintained at 10 K/min. The X-ray measuremeasure-ments of textures were carried out on a fully automatic texture goniometer using CuKradiation. Pole figures of the three crystal planes (200), (110) and (211) were determined through the texture measurement. The transformation strains at various cut angles were calculated utilizing crystallite
Table 1 Chemical composition of ingot and as-spun ribbon. Element/at%
Ti Ni Cu Si
Specimen
Ingot 51.33 38.50 10.17 0.00 Ribbon 51.15 38.59 9.64 0.62 Special Issue on Materials and Devices for Intelligent/Smart Systems
orientation distribution function (ODF) measured by the X-ray diffraction method for the ribbon in the as-spun condition and after heat-treatment at 1073 K for 3.6 ks. 2-scan was performed on ribbons at 373 K in the as-spun condition and after the heat-treatment in order to find the nature of the specimen (crystalline or amorphous).
The changes in transformation strain with temperature variation during a thermal cycling were measured under different stresses with the help of a thermomechanical analyzer. Measurement of strain vs. temperature relation-ships were performed on ribbon specimens in as-spun condition and after heat-treatment at 1073 K for 3.6 ks. From these studies, the variation of transformation temperatures, plastic strain, degree of strain recovery etc. were measured under various stress conditions when they were subjected to thermal cycling. In the present study, the specimens were thermally cycled in the range between 150 K and 373 K with the heating and cooling rate of 10 K/min. The change in internal structure of the specimens and the development of other phases during the preparation and the heat-treatment was observed through a transmission electron microscope (TEM).
3. Results and Discussion
3.1 Chemical analysis
From the EPMA analysis, the composition of the ingot and ribbon specimens of Ti52Ni38Cu10 (at%) observed are
tabulated in Table 1 below:
3.2 Differential scanning calorimetry
DSC measurement was performed to detect the trans-formation temperatures of the ingot and ribbon specimens after heat-treatment at 1073 K for 3.6 ks. Figures 1(a) and (b) show the DSC curves of the Ti52Ni38Cu10ingot specimen and
rapidly solidified Ti52Ni38Cu10 melt spun specimen after
heat-treatment at 1073 K for 3.6 ks. They represent typical DSC curves of stress free Ti52Ni38Cu10specimens in which
an exothermic peak (M) corresponding to the transformation
of austenite to martensite occurs on cooling and an endothermic peak (A) corresponding to the reverse
trans-formation of martensite to austenite occurs during heating. Determined in the figure are also the onset (As andMs) and
finish (Af andMf) temperatures. The ribbon specimens in the
as-spun condition do not show any DSC signals which may be due to the amorphous nature of the specimen as observed through XRD studies. The transformation temperatures (in K) are listed in Table 2.
From the above table, it can be observed that the transformation temperatures of the ribbon specimen are well below those of the ingot specimen. It is recognized that the grain boundaries can act as barriers to the martensitic transformation as a result of extra energy required for complimentary shear during the process.12) Thus a fine
grained rapidly solidified ribbon with a larger portion of grain boundary area would be expected to posses a lowerMsthan
the coarse grained ingot specimen. This view is supported by the present DSC results.
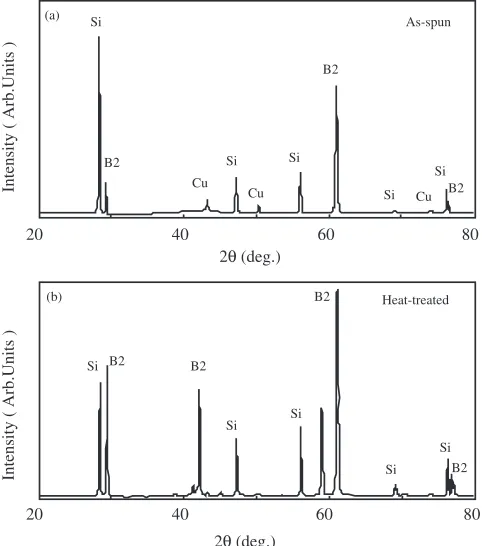
3.3 X-ray diffraction 3.3.1 2-scan
Figures 2(a) and (b) represent the intensity vs.2plot for as-spun and heat-treated Ti50Ni38Cu10ribbons. The
measure-ment was carried out at 373 K in order to ensure that the specimens are completely austenite (B2 high temperature phase). From Fig. 2(a) it can be observed that the as-spun specimen is partially amorphous. After heat-treatment at 1073 K for 3.6 ks, the specimen became completely crystal-line which was shown in Fig. 2(b).
3.3.2 Texture analysis
Data of diffraction from three crystal planes (200), (110) and (211) were used to determine three corresponding pole
330 340 350 360 370 Temperature /K
Mf M s
0.13W/g
As Af
M*
A*
(a)
cooling
heating
Ti 52Ni38Cu10 (Ingot)
Heat-flow
250 300 350
Temperature /K
Heat-flow
0.13W/g
A* M s Mf
As As
(b) Ti 52Ni38Cu 10
(Ribbon)
cooling M*
heating
[image:2.595.310.549.73.484.2]Fig. 1 DSC curves of (a) ingot and (b) ribbon specimens after heat-treatment at 1073 K for 3.6 ks.
Table 2 Transformation temperatures of ingot and ribbon heat-treated at 1073 K for 3.6 ks.
Transformation temperature/K
Ms Mf As Af Specimen
Ingot 341 335 344 350
[image:2.595.305.548.562.615.2]figures. Utilizing the three pole figures, a crystallite orienta-tion distribuorienta-tion funcorienta-tion (ODF) was derived. On the basis of texture information, transformation strains were calculated along various directions between the spun direction (SD) (throughout this paper the term rolling direction (RD) is replaced by spun direction (SD)) and the transverse direction (TD) in order to estimate the anisotropy of the transformation strain. Here, anisotropy of transformation strain is defined as a difference between the maximum and the minimum of transformation strains obtained from various cut angles.
Figure 3(a) and (b) show the (110), (200) and (211) pole figures of as-spun and heat-treated Ti52Ni38Cu10 ribbons
respectively. The center of the pole figures corresponds to the direction normal to the specimen surface (ND). The (110) pole figure shows how theh110i axis density distributes in the specimen coordinate system SD-TD-ND. From the (110) pole figure of the as-spun Ti52Ni38Cu10ribbon, it can be seen
that the h110i axis density distribution was measured in a region within75from ND. A strong axis density appears
around 45 from ND. This suggests that some of the crystal
planes with45 apart from {011} locate on the rolling or
spinning plane. The (200) pole figure measured in the specimen reveals that an extremely high axis density peak is located along the ND. The (211) pole figure shows that slightly high axis density peaks are located along circles at
35 and 65 from ND. From these pole figures it is
observed that the {100}, {200}, {300} planes are located preferentially along the spun plane in both as-spun and the heat-treated ribbon specimens.
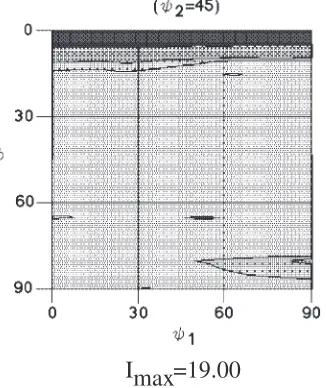
Figure 4 shows a2 ¼45section of ODF for the as-spun Ti50Ni38Cu10 ribbon as an example. The result reveals a
texture similar to a fiber texture with an axis aroundh001i
which is consistent with Fig. 3. However, it is different from
the {110}h110itype which is observed in rolled Ti-Ni bulk plates.13,14)
3.4 Transformation strain
Figure 5 represents the calculated transformation strain as a function of angle from the spun direction for as-spun and heat-treated ribbon specimens. Detailed explanation regard-ing the calculation of transformation strain is explained elsewhere.14)The overall transformation strain of the as-spun
specimen is found to be higher than that of the heat-treated specimen. For the as-spun ribbon specimen, the transforma-tion strain increases mainly from 10 to 70 after which it
becomes almost stable and attains a maximum at 90. In the
case of the ribbon specimen heat-treated at 1073 K for 3.6 ks, the transformation strain increases mainly from 30 to 90 and attains a maximum at 90. The transformation strain anisotropy of the as-spun and heat-treated specimens are 5.28% and 3.54%, respectively.
3.5 TEM analysis
The bright field image of the as-spun ribbon is shown in Fig. 6 which represents the crystallized area showing the individuality of grains. It is seen from the figure that the grain size is very small (20-100 nm). Figure 7 shows a portion of the as-spun ribbon. The corresponding diffraction patterns measured from the regions A and B represented in Figs. 8(a) and (b). From Fig. 8(a) it is evident that region A of Fig. 7 represents the crystallized area. The diffraction pattern of the region B shown in Fig. 8(b) represents a halo-ring corre-sponding to amorphous. Thus, both amorphous and crystal-lized areas exist together in as-spun ribbons. The bright field image of a ribbon heat-treated at 1073 K for 3.6 ks is shown in Fig. 9 which represents crystallized grains. It can be seen that the grain size grow up to 80100nm after heat-treatment. It is also noted that amorphous area can not be observed after heat-treatment.
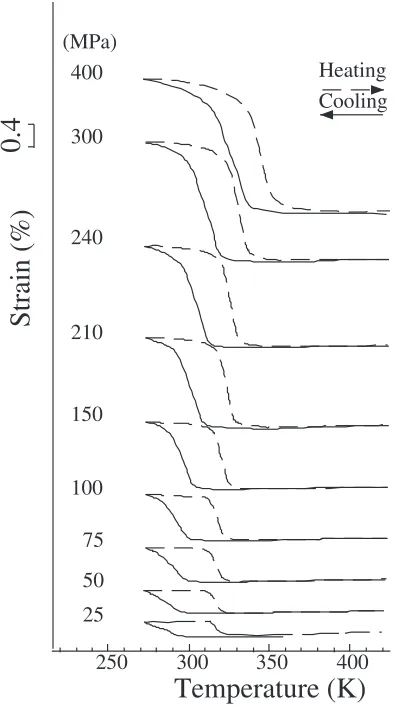
3.6 Thermo mechanical analysis
Thermomechanical studies were carried out to clarify the stability of shape memory characteristics associated with both the martensitic transformation and the reverse trans-formation upon repeated cooling and heating, respectively, under various constant stresses. The applied stress was changed variously in order to investigate the effect of stress on the cyclic shape memory behavior. During the tests, the specimens were fully transformed and reverse transformed by varying the temperatures between below the transforma-tion finish temperature (Mf) and above the reverse
trans-formation finish temperature (Af).
The method how to evaluate quantitatively the shape memory characteristics is explained in the following. Figure 10 shows the strain vs. temperature curves represent-ing shape memory behavior associated with the reverse transformation (from B19 to B2 phase) during heating and the martensitic transformation (B2 to B19 phase) respective-ly.Ms,Mf,AsandAfare abbreviations of the temperatures for
martensitic transformation start, martensitic transformation finish, reverse transformation start and reverse transforma-tion finish, respectively. From these studies, it is found that transformation temperatures, plastic strain, degree of
recov-20 40 60 80
2θ (deg.)
As-spun (a)
Intensity ( Arb.Units )
Si B2 Cu Cu Cu Si Si Si Si B2 B2 80 60 40 20
2θ (deg.)
Intensity ( Arb.Units )
Heat-treated (b)
Si B2 B2
Si Si
B2
Si Si
B2
[image:3.595.49.290.73.346.2]ery etc. vary depending on loading condition. In the present studies, the specimens were thermally cycled in the range of 150 to 373 K with the heating and cooling rate of 10 K/min. The results shown in Fig. 10 are plotted in detail in Figs. 11, 12 and 13. The change in the transformation temperaturesAs, Af,MsandMf in the ribbon specimen after heat-treatment at
1073 for 3.6 ks are shown in Fig. 11. All the transformation temperatures increase gradually with increasing applied stress.
The hysteresis decreases with increase in stress as shown in Fig. 12. The plastic strain was observed to be very small.
(a) As-spun
{110}
{200}
{211}
{110}
{200}
{211}
Imax=4.30
Imax=49.80
Imax=2.50
Imax=4.00
Imax=109.10
Imax=2.00
(b) 1073K, 3.6ks
Fig. 3 Pole figures of ribbon specimens in (a) as-spun condition and (b) after heat-treatment at 1073 K for 3.6 ks.
Imax=19.00
Fig. 4 2¼45section of crystallite distribution function of an as-spun ribbon.
0 20 40 60 80
Angel /deg.
As-spunHeat-treated
7.60 7.80 8.00 8.20 8.40
Strain / %
(SD) (TD)
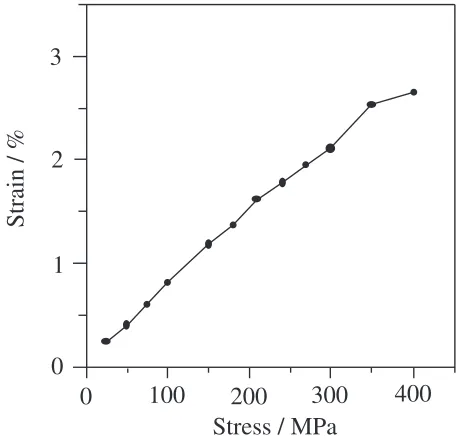
[image:4.595.77.521.79.441.2] [image:4.595.90.253.475.669.2] [image:4.595.317.542.480.681.2]Therefore, the forward transformation strain is almost the same as the reverse transformation strain. Figure 13 repre-sents change in forward transformation strain as a function of stress. The transformation strain increases linearly with increase in stress.
4. Conclusions
Ti52Ni38Cu10 ribbons were successfully prepared by rapid
solidification process. They show excellent shape memory
effect after heat-treatment. The following conclusions were made from the results obtained in the present study:
(1) The transformation temperatures of the ingot specimens were found to be higher than those of the melt spun ribbon specimen after heat-treatment at 1073 K for 3.6 ks.
(2) X-ray diffraction measurement revealed that the as-Fig. 6 Bright field image of an as-spun ribbon.
Fig. 7 Bright field image showing crystallized region A and amorphous region B in an as-spun ribbon.
(a)
(b)
Fig. 8 Diffraction patterns (a) and (b) corresponding to regions A and B, respectively, in Fig. 7.
Fig. 9 Bright field image of a ribbon heat-treated at 1073 K for 3.6 ks.
250
300
350
Temperature (K)
400
25
50
75
100
150
210
240
300
400
(MPa)
Heating
Cooling
Strain (%)
[image:5.595.56.283.73.251.2]0.4
[image:5.595.313.540.73.256.2] [image:5.595.55.284.287.472.2] [image:5.595.330.527.300.656.2] [image:5.595.52.286.524.619.2]spun specimen was in amorphous state and becomes crystalline after heat-treatment.
(3) Pole figure measurements revealed a strongh200ifiber texture both in as-spun and heat-treated specimens. (4) Crystallite orientation distribution functions also
indi-cated a strongh200ifiber texture.
(5) Transformation strain calculated based on the texture information depends on angle from the spun direction. The overall transformation strain of the as-spun ribbon specimen is higher than that of the heat-treated ribbon. (6) TEM results of the as-spun specimen shows the presence of both crystallized and amorphous regions and those of heat-treated specimen show crystallized region.
(7) Strain vs. temperature relationships show that the the transformation temperatures increase and the trans-formation temperature hysteresis decreases with
in-creasing applied stress and the transformation strain increases with increasing applied stress.
Acknowledgments
One of the authors VS, wishes to acknowledge the World Laboratory, Switzerland for providing financial assistance by means of scholarship, which enabled him to study at University of Tsukuba from 1999 to 2000 for a year. This work was also partially supported by the Grants-in-Aids for Fundamental Scientific Research (Kiban A (1999-2001) and Kiban A (2002-2004) from the Ministry of Education, Culture, Sports, Science and Technology, Japan.
REFERENCES
1) S. Miyazaki, in: T. W. Duerig, K. N. Melton, D. Stockel and C. M. Wayman (Eds.): Engineering Aspects of Shape Memory Alloys, (Butterworth-Heinemann Ltd., Stoneham, MA, 1996) pp. 394–413. 2) S. Miyazaki and K. Otsuka: ISIJ Int.29(1989) 353–377. 3) Y. Oshida and S. Miyazaki: Corrosion Eng.40(1991) 1009–1025. 4) S. Miyazaki, Y. Ohmi, K. Otsuka and Y. Suzuki: J. Phys. (France)43
(1982) C4-255.
5) W. J. Moberly and K. N. Melton: Engineering Aspects of Shape Memory Alloys, (Butterworth-Heinemann Ltd., Stoneham, MA, 1996) pp. 46–57.
6) O. Mercier and K. N. Melton: Metall. Trans.10A(1979) 387–389. 7) M. Igharo and J. V. Wood: Mater. Sci. Eng.98(1988) 443–447. 8) H. Inoue, N. Miwa and N. Inakazu: Act. Mater.44(1996) 4825–4834. 9) A. Khantachawana, K. Yamazaki and S. Miyazaki: Mater. Sci. Forum
394–395(2002) 495–498.
10) A. Khantachawana, K. Yamazaki, H. Hosoda and S. Miyazaki: Trans. MRS-J26[1](2001) 193–196.
11) Y. Furuya, M. Matsumoto, H.S. Kimura and T. Masumoto: letter Mater. Sci. Eng. A147(1991) L7–L12.
12) J. H. Mulder, P. E. Thoma and J. Beyer: Z. Metallk.84(1993) 501–508. 13) H. J. Bunge: Texture Analysis in Materials Science, (Butterworths,
London, 1982).
14) S. Miyazaki, V. H. No, K. Kitamura, A. Khantachawana and H. Hosoda: Int. J. Plasticity16(2000) 1135–1154.
M s M f A s A f
0 100 200 300 400
Stress / MPa 280
320 360 400
Transformation temperature / K
[image:6.595.312.542.71.291.2]500
Fig. 11 Transformation temperatures as a function of stress in a heat-treated ribbon.
15 20 25 30 35
0 100 200 300 400
Hysteresis / K
[image:6.595.56.290.74.290.2]Stress / MPa
Fig. 12 Stress dependence of temperature hysteresis in a heat-treated ribbon.
0
100
200
300
400
Stress / MPa
3
2
1
0
Strain / %
[image:6.595.63.278.338.524.2]