Current scientific knowledge concerning funda-mental problems of soil compaction in the surface layer and in the deep layer using farm machinery indicates that it is also necessary to focus research on the effects of vehicles and machines in the depth of 0.4 up to 0.5 m (Morgan et al. 1993, Grečenko 2002). Compaction of agricultural soils results in increased soil bulk density (Mckibben 1971, Wells and Burt 1984, Ngunjiri and Siemens 1993), struc-tural changes in porosity (Borůvka et al. 2002), decreased hydraulic conductivity (Wood et al. 1993) and air permeability (Freitag 1971, Kunnemann and Wittmuss 1976). Soil bulk density is one of the most frequently used measures of compac-tion. Dry bulk density is determined by the value of weight (mass) of dry matter in a soil sample that occupies a core of known volume. The core sampling method usually determines bulk density (Abu-Hamdeh and Al-Jalil 1999).
Pressing the core sampler into the soil usually avoids the vibration that causes fracturing, but soil may be displaced in front of the core due to compression if the static loading rate exceeds the rate at which soil can enter into the core sampler (Blake and Hartge 1986, Rogers and Carter 1987). Hammering, compared with hydraulically press-ing, the core sampler into the soil appears to cause more distortion within the soil core, which increases variability (Stone 1991).
The purpose of this project is to design an efficient sampler, which allows comparison of disturbed and
undisturbed soil samples. That is to provide the possibility of applying the results for further experi-ments in the soil compaction sphere as well.
MATERIAL AND METHODS
Objectives
Using a portable soil sampler with defined di-ameter and depth of drill. It is possible to collect an exact volume of soil. Moisture and bulk density of the dry soil in defined depth of soil profile is calculated from wet soil sample weight and dry soil sample weight. The leading guideline is a change of bulk density of soil depending on the depth of the soil profile and soil moisture content, which is used to analyse current soil profile conditions.
The soil sampler is supposed to meet these re-quirements:
– to transport it to any place in the field
– the possibility of replacing the drilling heads in compliance with existing soil conditions – to regulate the depth of drilling
– to empty the drilling head
Soil sampler description
In March 2001 a team of researchers from Department of Automobiles and Tractors of
A new soil core sampler for determination bulk density
in soil profile
P. Prikner, F. Lachnit, F. Dvořák
Czech University of Agriculture in Prague, Czech Republic
ABSTRACT
The portable soil core sampler was engineered for gradual sampling of soil profile in the depth up to 0.5 m, which ensures extraction of the whole sample volume of soil profile in determinable depth. The portable soil core sampler was compared with the professional soil probe Eijkelkamp P1.31 (Eijkelkamp Agrisearch Equipment, Netherlands) in field conditions. The portable sampler was compared with the physical soil sample rings in laboratory conditions to eliminate all of possible restrictive aspects affecting the procedure of measurement. The portable soil core sampler with inner diameter 71 mm, depth 120 mm enables gradually take samples of soil profile by step of 50 mm and is able to detect possible local extremes. On the other hand a soil probe is not able to reach desired accuracy in taking of a soil sample. Values measured from a soil probe approximately taken by step of 150 mm are inaccurate. The values of bulk density of both sampling methods were variable at significant interval from 40 into 80 kg/m3. Different values could be caused by soil profile condition and by the use of different sampling methods. The design of a portable soil sampler should be of assistance in fast and precise soil profiling sample collection, which is required to determine bulk density of the soil, its variance depending on moisture content in soil compaction determining criteria.
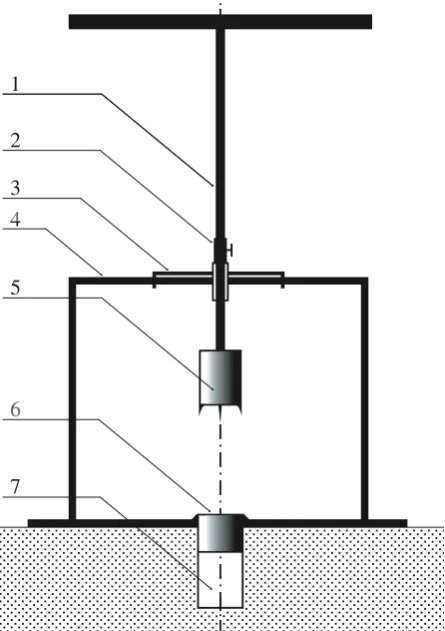
Technical Faculty of CUA in Prague, have started to develop a portable soil sampler (Figure 1) for gradual sampling of soil profiles in the depth up to 0.5 m, which ensures extraction of the whole sample volume of soil profile in random depth.
The major parts of the portable soil sampler as-sembly were made of steel because of its durability and resistance. Main component and resistance: Main component (4), which is fixed to support plate by fixing nails. Rotating handle (1) with drill-ing head (5) (Figure 2) were with inner diameter 71 mm, depth 120 mm, in auxiliary firming sleeve (3) which (6) ensures perpendicular direction of drilling together with guide sleeve. These parts are fastened into a supporting frame. The change of depth of the soil profile drill 0–100 mm is provided by an adjustable sleeve (2). The drilled out volume of sample of soil profile is designated (7).
Plots ground and soil
First series of measurements was carried out at the testing ground of Czech University of Agriculture in Prague-Suchdol. Soil compaction has already
been measured in the past years therefore it is pos-sible to compare the obtained results. Soil is well conditioned, because it was thoroughly cultivated by lightweight mechanization.
The second series of measurements was carried out at the testing ground of Department of Plant Production of Czech University of Agriculture in Uhříněves. The soil was cultivated by lightweight mechanization.
The third series of experiments was carried out at the testing ground of four agricultural enterprises (Veseličko, Opařany, Vlastiboř, Studené). Those soils were sandy and very stony, that’s why they are cultivated by special technologies to minimize soil cultivation.
The fourth series of measurements was car-ried out in the laboratory of Czech University of Agriculture in Prague-Suchdol. The soil was well conditioned and homogenous.
[image:2.595.68.291.62.378.2]All tested soil profiles were Luvisols. Figure 1. Scheme of portable soil sampler (for legend see
text)
[image:2.595.301.527.69.265.2] [image:2.595.308.533.601.738.2]System of measurement and sample collection
Over 300 disturbed soil samples were collected using the Portable Soil Sampler and another 300 undisturbed samples were collected using the professional probe sampler Eijkelkamp P1.31 to compare both devices. The set consisted of two components: riverside auger, which levels and prepares the drill hole bottom and a special ring holder (model 07.53.SA) where the sample ring is fastened in (analogy of physical sample ring).
The soil samples were collected in unloaded soil layers (Figure 3). The probe sampler enabled us to collect soil sample approximately every 0.15 m in regard to necessary adjustments of the drilled soil profile. In order to obtain precisely analysed results, depths of soil profile collection were set up to: 0.15, 0.30, 0.45 m. The soil sampler was drilling soil layers gradually every 50 mm up to a predefined depth. Having used the probe we collected samples each 0.15 m up to approximately 0.45 m.
Laboratory conditions enable us to collect soil samples approximately every 0.10 m in regard of height model soil profile 0.35 m. In order to obtain the precisely analysed results, the depths of soil profile collection were set up to: 0.10, 0.20, 0.30 m. In routine work of the field experiment, four replicates were used and two replicates were used in the laboratory.
The collected soil was immediately placed in alu-minum dishes, oven dried at 105°C for 24 hours after weighing and then weighed again. Dry bulk density in dry sample ρd was determined and com-pared at the same parameter ρdp (probe) and ρds
(soil sampler).
The experiments were statistically analysed as Multiple-Sample comparison and Regression Analysis over and from between both sampling
methods depending on depth soil profiles. Statgraphics® Plus for Windows version 3.1 was
used for statistical processing of achieved data. Statistical significance is stated at the 0.05 levels for estimating the means and standard errors. The statistical significance is stated at the 0.10 levels for regression analysis.
RESULTS AND DISCUSSION
DATA SET CHARACTERIZATION
The values of bulk density (Figures 4–7) and total averaged moisture content (Table 1) from experiments over the years 2002/2003 are shown. The values of the average error in dry bulk density are in Table 2. Soil profile compaction was also detected by electronic penetrometer into depths 0.45–0.50 m. Penetration resistance had been per-formed before the collecting of samples. The values reached by penetration resistance served only as comparative values (Figure 8). Each point on the curves and value in the tables represent the aver-age of eighteen replicates.
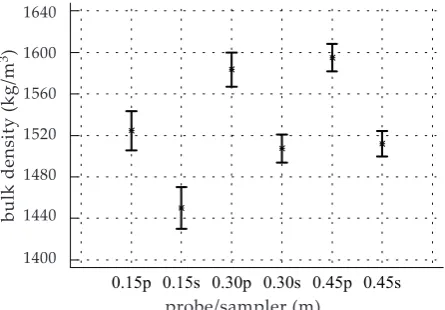
[image:3.595.308.531.562.717.2]A) Measurements conducted in Prague-Suchdol
(Figure 4)
Due to profile inequality or soil tamping in sample rings, dry bulk density values of samples collected by the probe Eijkelkamp ρdp in depths of 0.45 m show a few extreme values in the soil profile.
Samples collected from a depth of 0.30 m were influenced by variability of the soil profile, dry bulk density values measured by the probe Eijkelkamp was in various locations increased.
probe/sampler (m)
Figure 4. Means and standard errors of bulk density in Suchdol
Figure 5. Means and standard errors of bulk density in Uhříněves
probe / sampler [m] 0.15p 0.15s 0.30p 0.30s 0.45p 0.45s 1400 1440 1480 1520 1560 1600 bu lk d en si ty (k g/ m 3 )
[image:3.595.69.292.565.724.2]In depths of 0.15 m the soil was relatively soft and a few local extremes caused by the soil pro-file inequalities were reported. Differences in values of the dry bulk density were approved in the surface layers, which is fluently getting even into depths.
B) Measurements conducted in Prague-Uhříněves
(Figure 5)
Values of probe ρdp are significantly higher than values of soil sampler ρds, which could be a result of a raise in bulk density caused by mechanical ef-fects of soil abrasion in the sample ring in depths of 0.45 m.
The influence of inequality of the soil profile was significantly expressed in the samples collected from depth of 0.30 m. The dry bulk density ρdp of probe Eijkelkamp increased locally in 3 collected samples compared to samples collected by the sampler.
Dry bulk density values measured by probe Eijkelkamp and dry bulk density values meas-ured by soil sampler in depth of 0.15 m indicated significant extremes in measured values, caused by the different sampling techniques.
C) Measurements conducted at farms (Figure 6)
[image:4.595.69.288.69.228.2] [image:4.595.310.529.69.212.2]Stony parcels significantly influenced dry bulk density values measured by the probe Eijkelkamp Figure 7. Means and standard errors of bulk density in labora-tory conditions
Figure 6. Means and standard errors of bulk density in agri-cultural enterprises in Southern Bohemia
probe / sampler [m]
0.10p 0.10s 0.20p 0.20s
1300 1340 1380 1420 1460 1500 1540
bu
lk
d
en
si
ty
(k
g/
m
3 )
probe/sampler (m) physical ring / sampler [m]
0.10p.r. 0.10s 0.20p.r. 0.20s 0.30p.r. 0.30s 1400
1440 1480 1520 1560 1600
bu
lk
d
en
si
ty
(k
g/
m
3 )
physical ring/sampler (m)
Table 1. A total averaged moisture content (%) of tested soil profiles
A B C D
probe sampler probe sampler probe sampler probe sampler
21.96 21.85 21.75 21.23 20.27 19.55 23.22 22.85
A = Suchdol, B = Uhříněves, C = agricultural enterprises in Southern Bohemia, D = laboratory conditions
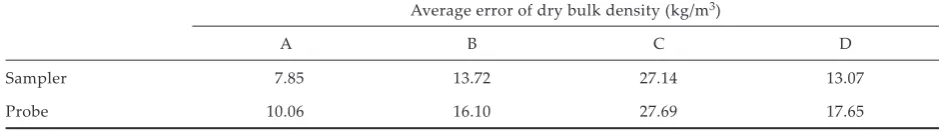
Table 2. Averaged error of bulk density (kg/m3) of tested soil profiles
Average error of dry bulk density (kg/m3)
A B C D
Sampler 7.85 13.72 27.14 13.07
Probe 10.06 16.10 27.69 17.65
A = Suchdol, B = Uhříněves, C = agricultural enterprises in Southern Bohemia, D = laboratory conditions
bu
lk
d
en
si
ty
(k
g/
m
3)
bu
lk
d
en
si
ty
(k
g/
m
3)
1600
1560
1520
1480
1440
1400 1540
1500
1460
1420
1380
1340
[image:4.595.65.540.541.592.2] [image:4.595.61.532.678.745.2]and by the soil sampler in all depths. Within these conditions, using a soil sampler is not conven-ient.
D) Measurements conducted in laboratory conditions (Figure 7)
The laboratory experiments were carried out to compare each of the sampling methods and to eliminate all of the possible restrictive aspects af-fecting the procedure of measurement. There were different values of dry bulk density measured in depths of 0.10–0.20 m in laboratory conditions because of different sampling techniques. Those differences were becoming equal depending on the depth. Bulk density values simulated perfect existing conditions.
These differences of measured values of both sampling techniques could be caused by soil profile conditions and the variance of moisture content in soil profiles (Håkansson 1990, Stone 1991). The experiments showed that the sampling methods of
undisturbed soil samples evoked a compression effect in the core samples because of the friction between soil elements and walls of the probe rings. This negative effect caused an increase of bulk density in the soil samples.
STATISTICAL EVALUATION
Analysis of the variance was used for data processing. It was necessary to test the null hy-pothesis that the standard deviations of achieved data by soil probe and soil sampler were of the same value. The P-values from Cochran’s test and Bartlett’s test were lower than 0.05, however, the analysis of variance showed statistically important differences between tested collections in a 95% confidence level.
The correlated linear model of relationship between the sets of data was tested. R-Squared values of this model were higher than for other alternative models. The values of correlation co-efficients are shown in Table 3. In default of the
0.00 0.05 0.10 0.15 0.20 0.25 0.30 0.35 0.40 0.45 0.50
0 2 4 6 8 10 12 14 16
A B C Penetration resistance [MPa]
[image:5.595.143.454.67.250.2]Depth [m]
Figure 8. Penetration resistance of soil profiles
A = Suchdol, B = Uhříněves, C = agricultural enterprises in Southern Bohemia
Table 3. Correlation between bulk density measured by both sampling methods
Depth Correlation coefficient
A B C D
0.15 (0.10)D 0.49* 0.62* 0.12 0.14
0.30 (0.20)D 0.15 0.54* 0.60* 0.62*
0.45 (0.30)D 0.60* 0.44* – 0.90*
A = Suchdol, B = Uhříněves, C = agricultural enterprises in Southern Bohemia, D = laboratory conditions
Ddepth in laboratory conditions, *significantly level 0.05
Penetration resistance (MPa)
D
ep
th
(m
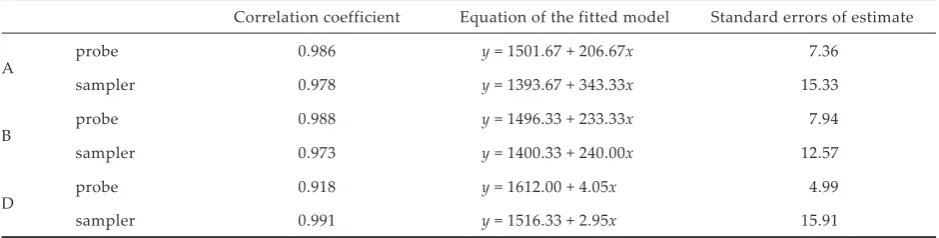
[image:5.595.64.535.643.728.2]measured data the value from Southern Bohemia is not calculated. There is the possibility to ex-plain the lower values of soil sampler’s correla-tion coefficient by the changing soil properties on all the locations. Results of Regression Analysis of dependence of bulk density on depth, linear model (90% higher confidence level) are shown in Table 4.
Although a variety of sampling techniques signifi-cantly affected the observed values of bulk density, the effect of the variations in number of soil profiles was generally greater than the effect of the sampling techniques encountered in these experiments. For that reason all tested factors can have statistically significant influence on the measurement based on soil sampling. The soil probe compared with it is the portable soil sampler; however, it appears to cause more distortion of soil core.
When selecting a suitable method of soil collec-tion it is necessary to consider that the use of a soil probe does not provide a 100% filled sample ring extraction from soil profile and thus the error of measurement is not constant. Use of a drill and probe in stony soils is inappropriate. Measured values are not reliable there.
Acknowledgement
We grateful acknowledgement to Milena Dvo-řáková and Ivo Ivanov, Department of Foreign Languages of CUA, for their being helpful with the final language revision.
REFERENCES
Abu-Hamdeh Nidal H., Al-Jalil Hamin F. (1999): Hydrau-lically powered soil core sampler and its application to soil density and porosity estimation. Soil Tillage Res., 52: 113–120.
Blake G.H., Hartge K.H. (1986): Bulk density. In: Klute A. (ed.): Methods of soil analysis. Am. Soc. Agron. 2nd ed. Agron. No. 9 (Part I): 363–375.
Borůvka L., Valla M., Donátová H., Němeček K. (2002): Vulnerability of soil aggregates in relation to soil prop-erties. Rostl. Výr., 48: 329–334.
Freitag D.R. (1971): Methods of measuring soil compac-tion. In: Barnes K.K. et al. (eds.): Compaction of agri-culture soils, ASAE Monogr., St. Joseph, MI: 47–103. Grečenko A. (2002): Farmland protection through tyre
load rating. Abstr. Proc. 5th Int. Conf. Problems of agricultural and forestry engineering, SGGW, War-saw: 103–104.
Håkansson I. (1990): A method for characterizing the state of compactness of the plough layer. Soil Till. Res., 16: 105–120.
Kunnemann D., Wittmuss H. (1976): Soil structure defined by air permeability. ASAE Pap. No. 76-1515, St. Joseph, ML.
Mckibben E.G. (1971): Introduction. In: Barnes K.K. et al. (eds.): Compaction of agriculture soils, ASAE Monogr., St. Joseph, MI: 3–6.
Morgan M.T., Holmes R.G., Wood R.K. (1993): A system for measuring soil properties in the field. Soil Tillage Res., 26: 301–325.
Ngunjiri G.M., Siemens J.C. (1993): Tractor wheel traf-fic effects on corn growth. ASAE Pap. No. 93-1110. St. Joseph, ML.
Rogers J.S., Carter C.E. (1987): Soil core sampling for hydraulic conductivity and bulk density. Soil Sci. Soc. Am. J., 51: 1393–1394.
Stone J.A. (1991): Core sampling technique for bulk density and porosity determination on a clay loam soil. Soil Till. Res., 21: 377–383.
Wells L.G., Burt E.C. (1984): Response on selected soils to power tires at disparate moisture conditions. ASAE Pap. No. 84-1546. St. Joseph, ML.
Wood R.K., Reeder R.C., Morgan M.T., Holmes R.G. (1993): Soil physical properties as affected by grain cart traffic. Trans. ASAE, 36: 11–15.
[image:6.595.63.533.93.212.2]Received on September 25, 2003 Table 4. Regression analysis of dependence of bulk density (kg/m3) on depth (m), linear model (90% higher confidence level)
Correlation coefficient Equation of the fitted model Standard errors of estimate
A probe 0.986 y = 1501.67 + 206.67x 7.36
sampler 0.978 y = 1393.67 + 343.33x 15.33
B probe 0.988 y = 1496.33 + 233.33x 7.94
sampler 0.973 y = 1400.33 + 240.00x 12.57
D probe 0.918 y = 1612.00 + 4.05x 4.99
sampler 0.991 y = 1516.33 + 2.95x 15.91
ABSTRAKT
Nový půdní vrták pro zjišťování objemové hmotnosti půdního profilu
Přenosný půdní vrták byl sestrojen pro postupné odebírání půdních vzorků z hloubky až 0,5 m a k vyjmutí celého objemu půdního vzorku z profilu ve stanovené hloubce. Přenosný půdní vrták byl v polních podmínkách porovná-ván s profesionální půdní sondou Eijkelkamp P1.31 (Eijkelkamp Agrisearch Equipment, Holandsko). V laboratorních podmínkách byl přenosný půdní vrták testován s Kopeckého fyzikálními půdními válečky kvůli vyloučení všech pravděpodobných faktorů ovlivňujících metodu měření. Přenosný půdní vrták s vnitřním průměrem 71 mm a výš-kou 120 mm umožnil odebírat postupně vzorky z půdního profilu po 50 mm, takže byly odhaleny i případné lokální extrémy. Půdní sonda nedosáhla požadované přesnosti měření, půdní vzorky byly odebírány přibližně po 150 mm a naměřené hodnoty měly velký rozptyl a byly nepřesné. Významné rozdíly v porovnávaných hodnotách objemo-vých hmotností byly zjištěny v rozmezí od 40 do 80 kg/m3. Tyto rozdíly mohly být způsobeny změnami půdního profilu a použitím různé odběrové metody. Navržený přenosný půdní vrták by měl přispět k rychlému a přesnému odebírání půdních vzorků, které je požadováno při určování objemové hmotnosti půdy. Právě změna suché objemové hmotnosti půdy v závislosti na její vlhkosti je určujícím kritériem pro stanovení zhutnění půd.
Klíčová slova: půda; půdní vrták; zhutnění půdy; půdní profil
Corresponding author: