Magnetic Properties and Phase Transformations of Bulk Amorphous Fe Based Alloys Obtained by Different Techniques
8
0
0
Full text
(2) Bulk Amorphous Fe-Based Alloys: Properties and Phase Transformation. sequent consolidation in form of discs with 10 mm diameter and different thickness exhibit a coercivity which is one order of magnitude higher compared to the as-spun amorphous ribbon, but it can be decreased by annealing. Hence, not only the alloy composition but also the processing route have a strong influence on glass formation as well as on the resulting soft magnetic properties of the material. This also holds for the possibility to produce bulk amorphous Fe-based alloys in shapes suitable for magnetic applications. Consequently, this work focuses on the crystallization behavior, the magnetic properties for Fe65.5 Cr4 Mo4 Ga4 P12 C5 B5.5 and Fe77 Al2.14 Ga0.86 P8.4 C5 B4 Si2.6 bulk glass-forming alloys prepared by slow cooling from the melt or by melt spinning combined with crushing of the ribbons by ball milling and subsequent consolidation. 2. Experimental Procedure The preparation of the amorphous Fe65.5 Cr4 Mo4 Ga4 P12 C5 B5.5 and Fe77 Al2.14 Ga0.86 P8.4 C5 B4 Si2.6 alloys was done in several steps. First, master alloy ingots were obtained by induction melting using Fe–B, Fe–C, Fe–Ga, Fe–P prealloys and pure elements like Mo (99.4% purity), Cr (99.95% purity), Fe (99.9% purity), Al (99.95% purity), Si (99.99% purity) or crystalline B (99.99% purity). Induction melting of Fe with B, Fe with C (99.9% purity) and Fe with Ga (99.7% purity) allowed to produce the respective pre-alloys. By mechanical alloying of Fe powder (99.9% purity, less than 10 microns particle size) with amorphous red P (99% purity, less than 100 microns particle size) in SPEX 8000 ball mill using hardened steel balls and vial and a 3:1 ball-to-powder weight ratio, consolidation of the resulting powders by cold pressing and subsequent induction melting the pre-alloy, was obtained the Fe–P pre-alloy. The handling of the elements, the ball milling as well as the powder, compaction and the melting were performed under protective atmosphere (argon, purity 99.99%). Amorphous rods (diameter of 1.5, 2, 2.5 and 3 mm, length of 70 mm) and ribbons (width of 10 mm and thickness of 0.03 mm) were prepared from the master alloy with nominal composition Fe65.5 Cr4 Mo4 Ga4 P12 C5 B5.5 . The rods were obtained by induction melting under argon atmosphere at a pressure of 80 kPa and subsequent injection into a cylindrical copper mold under an applied pressure of 3·105 Pa. The amorphous ribbons were prepared by single-roller melt spinning on a copper wheel under argon flow at 24 m·s−1 tangential velocity of the wheel. Using the same device, Fe77 Al2.14 Ga0.86 P8.4 C5 B4 Si2.6 amorphous ribbons of 10 mm in width and 0.02 mm in thickness were prepared using a wheel speed of 21 m·s−1 . Some parts of these ribbons were cut into small pieces, ball-milled and subsequently compacted to discs of 10 mm in diameter and 3 mm in thickness. The milling experiments were done in a Retsch PM 4000 planetary ball mill under an argon atmosphere using hardened steel balls and vials and the ball-to-powder weight ratio was 15:1. The rotation velocity of the mill was 250 revolutions per minute. The sample handling was performed in a glove box under purified argon atmosphere (<1 ppm O2 and H2 O). The consolidation of the resulting powders into bulk samples was done in an unaxial hot press under a vacuum of. 1967. 10−3 Pa. The powder was heated at 0.67 K·s−1 to the consolidation temperature, held isothermally at this temperature and compacted at a pressure of 500 MPa. The sample was held isothermally in the press under the applied load for 2 min. The compacting temperatures were chosen to be in the temperature range of the supercooled liquid region. The oxygen content of the powders after milling was checked by hot extraction using a C436 LECO analyser. Because the presence of oxides can have a negative influence in order to prepare bulk amorphous alloys, we also checked the oxygen content of the master alloys and prealloys. This revealed very low values: 50 ppm for Fe65.5 Cr4 Mo4 Ga4 P12 C5 B5.5 and Fe77 Al2.14 Ga0.86 P8.4 C5 B4 Si2.6 , 180 ppm for Fe–P and 130 ppm for the other pre-alloys, respectively. The amorphous structure of the samples was checked by X-ray diffraction (XRD) experiments with Co–Kα radiation (λ = 0.17889 nm) using a Phillips PW 3020 diffractometer. Because the diameter of the Fe65.5 Cr4 Mo4 Ga4 P12 C5 B5.5 rods was rather small, the samples for XRD measurements were prepared by crushing the rods into small pieces and bonded into amorphous resin in order to have good resolution. The thermal stability, i.e. the glass transition, the extension of the supercooled liquid region and the crystallization, was examined by differential scanning calorimetry (DSC), using a Netzsch DSC 404 for Fe65.5 Cr4 Mo4 Ga4 P12 C5 B5.5 amorphous ribbons and rods and a Perkin-Elmer DSC 7 for Fe77 Al2.14 Ga0.86 P8.4 C5 B4 Si2.6 amorphous ribbons and compacted samples. The glass transition temperature Tg and the crystallization temperature Tx were measured as the onset temperatures of the glass transition and the crystallization events, respectively, during heating with a constant rate of 0.67 K·s−1 . The extension of the supercooled liquid region, defined as the difference between the glass transition temperature and the crystallization temperature, ∆Tx = Tx − Tg was also calculated. Additionally, for the Fe65.5 Cr4 Mo4 Ga4 P12 C5 B5.5 alloy the melting temperature Tm defined by the liquidus temperature Tliq at the onset of solidification upon cooling with a constant rate of 0.17 K·s−1 was measured using the Netsch DSC 404. For Fe77 Al2.14 Ga0.86 P8.4 C5 B4 Si2.6 amorphous alloys, penetration measurements in the supercooled liquid region were carried out by parallel plate rheometry in a Perkin-Elmer TMA7 analyser with quartz penetration probe as parallel plates in an argon atmosphere at a heating rate of 0.67 K·s−1 . The applied static force was 2.6 N. The isothermal annealing experiments were done in a tin-bath furnace. The crystallization behavior during heating and subsequent cooling from the melt of glassy Fe65.5 Cr4 Mo4 Ga4 P12 C5 B5.5 rods were observed by in-situ X-ray diffraction measurements in transmission configuration, using a high intensity highenergy monochromatic synchrotron beam (λ = 0.01304 nm) at the ESRF Grenoble. The rods were cut into pieces of 15 mm length and sealed into fused silica tubes under a vacuum of 10−3 Pa. The as-prepared samples were fast induction-heated with a rate of 2–5 K·s−1 up to the melting point, overheated and cooled down with 20 K·s−1 , i.e. a cooling rate not sufficient to retain an amorphous phase, with acquisition of X-ray patterns at each 2 s during the all process. The magnetic properties of the samples were also investigated. The coercive force, Hc , was measured using a Foerster.
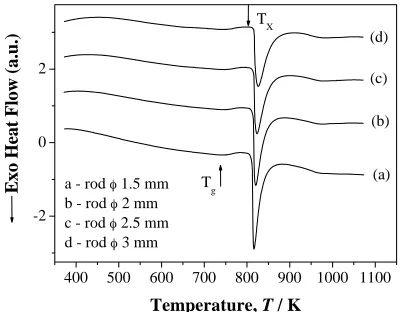
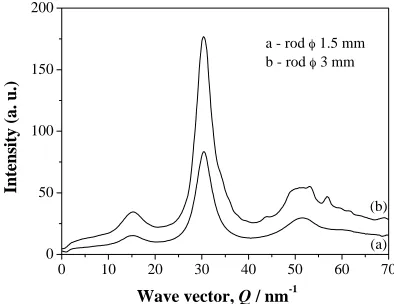
(3) 1968. M. Stoica et al.. Koerzimat with premagnetizing field pulses of 2000 A·cm−1 , the saturation polarization, Js , was measured by a vibrating sample magnetometer (VSM) under a maximum DC magnetic field of 15000 A·cm−1 and the behavior of magnetization versus applied magnetic field was determined by a B–H loop tracer which allows a continuous variation of the magnetic field between −200 and 200 A·cm−1 . 3. Results and Discussion 3.1 Bulk amorphous Fe65.5 Cr4 Mo4 Ga4 P12 C5 B5.5 rods and ribbon 3.1.1 Thermal characterization The thermal stability of amorphous Fe65.5 Cr4 Mo4 Ga4 P12 C5 B5.5 rods prepared by copper mold casting is shown in Fig. 1. The DSC scans reveal a glass transition starting at Tg , followed by a distinct supercooled liquid region and crystallization starting at Tx (the onset temperatures of glass transition and crystallization are marked by arrows in the figure). The values for Tg , Tx and ∆Tx = Tx −Tg for the different specimens are summarized in Table 1, together with the melting temperatures Tm , measured as the onset of solidification upon cooling. We used these temperatures to calculate the ratio Tg /Tm . Its value of about 0.59 is characteristic for alloy systems with good glass forming ability.18, 23) The glass transition temperature and the crystallization temperature increase slowly with increasing rod diameter, whereas the extension of the supercooled liquid region ∆Tx = 60±1 K remains almost constant. For the ribbon, ∆Tx = 66 K and the glass transition starts at 743 K, i.e. about 10 ± 3 K earlier in comparison with the rods (750 K for the rod with 1.5 mm diameter or 757 K for the rod with 3 mm in diameter, respectively). The glass. Exo Heat Flow (a.u.). TX. (d). 2. (c) (b). 0. -2. a - rod b - rod c - rod d - rod 400. 500. (a). Tg. 1.5 mm 2 mm 2.5 mm 3 mm 600. 700. 800. transition temperature, as well as the crystallization temperature, increase monotonically with increasing diameter of the rods, and their values are about 30 K higher than the data reported by Shen and Schwarz15) for this type of Fe-based bulk amorphous alloys obtained by water quenching. These differences in thermal stability between the meltspun ribbons and the rods of different diameter cannot be attributed simply to a different degree of relaxation obtained by the different cooling rates realized during melt spinning and copper mold casting. Rather they point to slightly different actual compositions of the glass obtained by the different synthesis conditions and the decreasing cooling rate of the melt with increasing diameter of the rods. Such compositional variations may arise if at least the rods with larger diameter are not fully amorphous but contain some crystalline primary precipitates wich may form due to not sufficient cooling rate for complete glass formation upon casting. 3.1.2 Structural characterization The XRD patterns (λ = 0.17889 nm), taken in the reflection configuration for crushed as-cast samples, are presented in Fig. 2. Generally, the patterns display a broad maximum centered around 2θ = 51◦ which is characteristic for an amorphous phase. However, the XRD experiments do not rule out the possible existence of a small volume fraction of nanoscale crystalline precipitates, which may be present in the glassy matrix. For example, there are additional diffraction peaks with weak intensity superimposed on the broad diffraction maximum of the amorphous phase for the cast rod with 3 mm diameter (curve d in Fig. 2). This points to the formation of crystalline precipitates coexisting with the glass, which agrees well with the conclusions drawn from the DSC results. The X-ray diffraction measurements in transmission configuration, using a high intensity high-energy monochromatic synchrotron beam (λ = 0.01304 nm) at the ESRF Grenoble showed clearly the presence of another crystalline phase(s) coexisting with the amorphous matrix. Figure 3 presents a comparison of patterns taken in this geometry, for the fully amorphous as-cast 1.5 mm rod and for the as-cast 3 mm rod with precipitates. The fully amorphous sample exhibits only two broad diffraction maxima centered around 31 nm−1 and 53 nm−1 , respectively. The first peak centered around of 15 nm−1 corresponds to the sample holder. In contrast, the XRD pattern for the 3 mm diameter rod (curve b in Fig. 3) a - rod 1.5 mm b - rod 2 mm c - rod 2.5 mm d - rod 3 mm e - ribbon (e). 900 1000 1100 600. Fig. 1 The DSC curves measured at a heating rate of 0.67 K·s−1 for amorphous Fe65.5 Cr4 Mo4 Ga4 P12 C5 B5.5 samples with different thickness. Table 1 Thermal stability data for Fe65.5 Cr4 Mo4 Ga4 P12 C5 B5.5 glassy alloys with different thickness measured at 0.67 K·s−1 heating rate. Sample. Tg /K. Tx /K. ∆Tx /K. Tm /K. Tg /Tm. Ribbon Rod φ 1.5 mm Rod φ 2 mm Rod φ 2.5 mm Rod φ 3 mm. 743 750 753 755 757. 809 811 814 815 817. 66 61 61 60 60. 1256 1251 1248 1250 1251. 0.59 0.59 0.60 0.60 0.60. Intensity (a. u.). Temperature, T / K. 400. (d) (c). 200. (b) (a) 0 20. 30. 40. 50. 60. 70. 80. 90. Diffraction Angle, 2 Fig. 2 XRD scans for bulk amorphous Fe65.5 Cr4 Mo4 Ga4 P12 C5 B5.5 as-cast rods and ribbon..
(4) Bulk Amorphous Fe-Based Alloys: Properties and Phase Transformation. displays additional diffraction peaks at 43.9, 51.6, 53.1, 56.8, 59.5, 61.9 and 68.9 nm−1 , respectively. This clearly proves the presence of crystalline inclusions in this specimen. The peaks with the wave vectors Q of 43.9, 53.1, 61.9 and 68.9 nm−1 correspond to the bcc phase characteristic for α-Fe. The other peaks at 51.6, 56.8 and 59.5 nm−1 are characteristic for a Fe3 C-type structure. Scanning electron microscopy (SEM) images taken from the cross-section of the as-cast 3 mm diameter rod (not showed here) reveal a dendritic structure for the crystalline inclusions with a dendrite size of 60– 70 µm. Most likely, the crystals form by primary precipitation upon cooling from the melt. Figure 4 shows the XRD patterns recorded in transmission geometry, for the as-cast 3 mm rod taken at different temperatures, i.e. for the as-cast material at room temperature, in the molten state at 1448 K and during cooling at 1313 K, where the alloy is still melted but may contain some clusters/inclusions (according to the DSC measurements the melting temperature is around 1251 K-see Table 1). In the molten state at 1313 K as well as at room temperature (Figs. 4(a) and (c)), there appears the same crystalline Fe3 C-type phase besides the amorphous phase. Obviously, the casting temperature plays an important role for obtaining a completely amorphous alloy. The alloy must be overheated until all the clusters/inclusions are melted (curve b in Fig. 4). Judging from 200 a - rod 1.5 mm b - rod 3 mm. the in-situ XRD measurements, the optimum casting temperature is around 200 K above the liquidus temperature, and at the same time must not be too high in order to retain a proper cooling rate. The XRD patterns for the 2.5 mm in diameter sample taken in-situ during heating with a rate of 5 K·s−1 , melting above Tliq and subsequent cooling with 20 K·s−1 are presented in Fig. 5. The successive patterns correspond to different temperatures, starting from the amorphous phase at room temperature, crystallized above Tx , melted, overheated and crystallized after fast cooling. The sample consists of a single amorphous phase at room temperature (curve a in Fig. 5). At 1013 K (curve b), the sample is completely crystalline. The peaks correspond to bcc α-Fe, fcc γ -Fe and Fe3 C-type structure. Above this temperature, the peaks corresponding to fcc γ -Fe (curve c) prevail. Besides, intermetallic compounds of the form (Fe, Cr, Mo, Ga)x (P, B, C)100−x may form, which have not been clearly identified, yet. At 1488 K, the crystalline structure disappears completely and all the clusters/inclusions are completely melted (curve d). The curve e in Fig. 5 corresponds to the crystalline state formed after cooling. The pattern is similar to that shown in curve c, and corresponds mainly to fcc γ -Fe phase, which is probably due to the retention of the austenitic phase by carbon. The peaks corresponding to the Q wave vector for the Fe3 C-type structure do not match the relative distribution of the peak intensity. For clarity, in the patterns presented in Fig. 5 only the peaks corresponding to bcc α-Fe and fcc γ -Fe are marked. 3.1.3 Magnetic measurements Table 2 summarizes the values of the coercive force Hc and of the saturation polarization Js for as-cast amorphous rib-. 100 800. - bcc -Fe - fcc -Fe. 50 (b) (a). 0 0. 10. 20. 30. 40. 50. Wave vector, Q / nm. 60. 70. -1. Intensity (a. u.). Intensity (a. u.). 150. 1969. 600. (e) (d). 400. (c) 200. Fig. 3 Transmission XRD patterns of glassy Fe65.5 Cr4 Mo4 Ga4 P12 C5 B5.5 alloys for: (a) a rod with 1.5 mm diameter and (b) a rod with 3 mm diameter, respectively.. (b) (a). 0 0. Intensity (a. u.). 150 (c). 100. (b) 50. (a). 10. 20. 30. 40. 50. Wave vector, Q / nm. 60. 20. 30. 40. 50. 60. 70. -1. Fig. 4 Transmission XRD patterns of glassy Fe65.5 Cr4 Mo4 Ga4 P12 C5 B5.5 alloys recorded in-situ at different temperatures: (a) at room temperature, (b) melted at 1448 K and (c) melted at 1313 K.. 70. 80. 90. -1. Fig. 5 The crystallization of amorphous Fe65.5 Cr4 Mo4 Ga4 P12 C5 B5.5 investigated by in-situ measurements for a rod with a diameter of 2.5 mm: (a) at room temperature, (b) at 1013 K, (c) at 1273 K, (d) overheated to 1488 K and (e) crystalline at room temperature after cooling. Table 2 Magnetic data for Fe65.5 Cr4 Mo4 Ga4 P12 C5 B5.5 glassy alloys with different thickness. Sample. 0 0. 10. Wave vector, Q / nm. a - as-cast at 300 K b - melted at 1448 K c - melted at 1313 K. 200. Ribbon Rod φ 1.5 mm Rod φ 2 mm Rod φ 2.5 mm Rod φ 3 mm. Coercivity Hc /A·m−1. Saturation polarization Js /T. 1.7 5 3 9 62. 0.82 0.81 0.77 0.78 0.78.
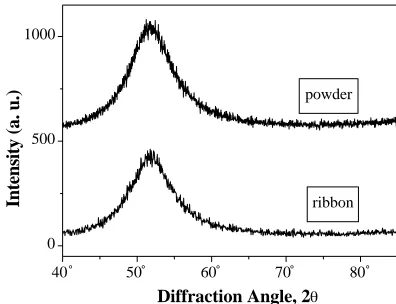
(5) 1970. M. Stoica et al. 6000 4000. b. 1000. a - ribbon b - rod 1.5 mm. 2000. Intensity (a. u.). Magnetization, M / Acm. -1. a. 0 -2000 -4000. powder 500. ribbon. -6000 -50. 0. 50. Applied Magnetic Field, H / Acm. 0. 100 -1. Fig. 6 The M–H loops for as-cast amorphous Fe65.5 Cr4 Mo4 Ga4 P12 C5 B5.5 samples with different diameters: (a) 1.5 mm and (b) 2 mm.. bons and rods without crystalline inclusions. The values are different for samples with different shape or diameter. The lowest coercivity value of 1.7 A·m−1 is found for the ribbon and the coercivity increase to 9 A·m−1 for the 2.5 mm diameter rod. However, the coercivity does not increase monotonically with increasing diameter of the rods, i.e. does not depend on the geometry of the sample, but is probably most sensitive to residual stress induced during the casting and to crystalline inclusions. For the as-cast rod with 3 mm diameter, which is not fully amorphous, the coercivity increases to 62 A·m−1 and it is expected to depend on the volume fraction of crystalline inclusions. The values of the saturation polarization are in the range of 0.77–0.82 T for the as-cast samples and were calculated using the estimated density value of 7057 kg·m−3 . The values are of the same order as the reported literature data for this type of amorphous alloys.15) Figure 6 presents a comparison of the M–H hysteresis loops for an amorphous rod with 1.5 mm diameter and a ribbon for an maximum applied field of 100 A·cm−1 . The magnetization at 80 A·cm−1 for both sample are near the same value around 6200 A·cm−1 , which correspond to a value of 0.77 T for polarization. The main errors that appear during the magnetic determination are due to the difficulties to estimate precisely the rather small cross-section of the ribbon. 3.2 Bulk amorphous Fe77 Al2.14 Ga0.86 P8.4 C5 B4 Si2.6 discs 3.2.1 Milling induced changes of thermal, structural and magnetic properties In order to prepare bulk amorphous samples, in a first step melt spinning was used to produce amorphous Fe77 Al2.14 Ga0.86 P8.4 C5 B4 Si2.6 ribbons which were then crushed into small pieces and subsequently ball-milled. The process of ball milling induces internal mechanical stress in the material and produces surface roughness. Accordingly, the thermal, structural and magnetic properties of the resulting powder are different from those of the initial melt-spun ribbon. Figure 7 compares the X-ray diffraction patterns for the ribbon and for the 1 h ball-milled powder. In both cases only the diffuse halo typical for an amorphous phase and no peaks for crystalline phases are found. Thus, one can suppose that no massive crystallization occurs during milling. The width of the temperature region ∆Tx during which the sample is in the supercooled liquid state is influenced by ball-. 40. 50. 60. 70. 80. Diffraction Angle, 2 Fig. 7 XRD patterns for Fe77 Al2.14 Ga0.86 P8.4 C5 B4 Si2.6 ribbon and ball-milled powder. 2. Exo Heat Flow (a. u.). -100. Tg 0. Tx Tc -2. 500. 600. 700. 800. Temperature, T/ K Fig. 8 DSC curves for Fe77 Al2.14 Ga0.86 P8.4 C5 B4 Si2.6 melt-spun ribbon (solid line) and ball-milled powder (dotted line) taken at a heating rate 0.67 K·s−1 . The characteristic temperatures Tg and Tx are also indicated. The small endothermic reaction at about 630 K is attributed to the Curie temperature Tc .. milling. Figure 8 shows DSC curves recorded at a heating rate 0.67 K·s−1 for Fe77 Al2.14 Ga0.86 P8.4 C5 B4 Si2.6 melt-spun ribbon and ball-milled powder. For the ribbon, the supercooled liquid region spreads over about 40 K (Tg ≈ 732 K, Tx ≈ 772 K), whereas ∆Tx = 35 K (Tg ≈ 733 K, Tx ≈ 768 K) in the case of the powder. This is due to the increase of the oxygen content upon ball milling which promotes crystallization of the powder.24, 25) The initial ribbon reveals an oxygen content of 0.04 ± 0.01 at%, whereas the ball-milled powder contains about 0.08 ± 0.01 at% of oxygen. Hence, after ball milling for 1 h the oxygen content doubled. The limiting values of the ∆Tx temperature region are important for compaction because of the material softening which starts at temperatures above Tg . Figure 9 shows the penetration for Fe77 Al2.14 Ga0.86 P8.4 C5 B4 Si2.6 ribbon and ball-milled powder as a function of temperature recorded in the Perkin-Elmer TMA7 analyser at a constant heating rate 0.67 K·s−1 . Above glass transition temperature the distinct contraction of the sample (i.e. penetration of the probe) occurs due to decrease of the viscosity in this temperature region. The diminution of the viscosity in the supercooled liquid state allows to consolidate dense bulk samples because of the easy deformation and working processes in this region.26, 27) The ball milling-induced stress causes significant differences in coercivity (Hc ) between the melt-spun ribbon and.
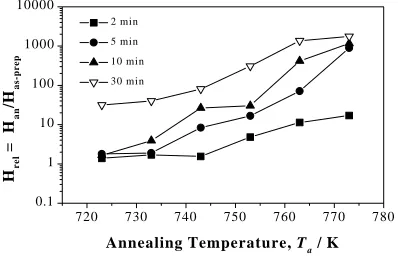
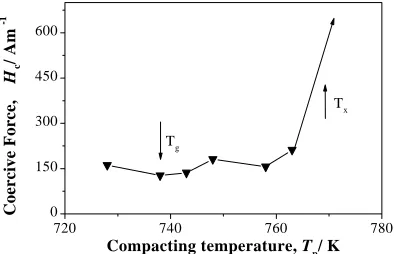
(6) Bulk Amorphous Fe-Based Alloys: Properties and Phase Transformation. 1971. 10. 0.165. H rel = H an /H as-prep. Penetration (a. u.). 2 min. 0.160 0.155 0.150 0.145 0.140 0.135 200. 30 min. 1. 0.1 710 300. 400. 500. 600. 700. 800. 900. Te mperature , T / K. Fig. 9 TMA scan of Fe77 Al2.14 Ga0.86 P8.4 C5 B4 Si2.6 ribbon (solid line) and ball-milled powder (dotted line) as the functions of temperature recorded at a constant heating rate of 0.67 K·s−1 . 10000 2 min 5 min. 1000. H rel = H an/H as-prep. 5 min 10 min. 10 min 30 min. 100 10 1 0.1 720. 730. 740. 750. 760. 770. 780. Annealing Temperature, T a / K. Fig. 10 Coercive force of Fe77 Al2.14 Ga0.86 P8.4 C5 B4 Si2.6 ribbon as a function of annealing temperature Ta for different annealing times (2, 5, 10 and 30 min).. the ball-milled powder. After melt-spinning a relatively low coercivity of 5–10 A·m−1 is found, which is typical for as-quenched ribbons.2) The coercivity increases strongly even after short ball milling for 1 h to a value of about 2200 A·m−1 . This increase of Hc values after ball milling can be attributed to microstructural changes (as a contribution of surface irregularities etc.) of the amorphous material induced by the milling process.21) Mechanical treatment of Fe77 Al2.14 Ga0.86 P8.4 C5 B4 Si2.6 amorphous material affects its soft magnetic properties and causes an increase of coercivity, similar as it was shown for mechanically alloyed Fe-TMbased alloys.28) It was found that in the early stage of ball milling of an amorphous phase, shear bands are formed which hinder the domain wall motion.21) In the case of low oxygen content in ball-milled powder, the pinning of domain walls at oxides as the reason for increased coercivity can be excluded.21) A large coercivity relaxation of ball-milled powder is obtained by annealing at elevated temperatures which will be discussed in the next section. 3.2.2 Annealing experiments The coercivity of ribbon and powder can be changed by annealing at elevated temperatures. Figures 10 and 11 show the changes of coercivity for the ribbon and the ball-milled powder obtained by annealing at elevated temperatures (Ta ) for four different times (2, 5, 10 and 30 minutes) and 7 different temperatures ranging from 713 K up to 773 K. Annealing of the ribbons for 2 min does not significantly change the Hc values for temperatures up to Ta = 743 K. 30 minutes of annealing at 723 K increases Hc by one order of magnitude:. 720. 730. 740. 750. 760. 770. 780. Annealing Temperature, T / K. Fig. 11 Coercive force of Fe77 Al2.14 Ga0.86 P8.4 C5 B4 Si2.6 powder as a function of annealing temperature Ta for different annealing times (2, 5, 10 and 30 min).. from 5–10 A·m−1 (= Has−prep ) to 96 A·m−1 . This indicates the presence of some crystals in the sample. Annealing at 763 K (which is close to Tx ) for 30 minutes leads to an increase of Hc to 8155 A·m−1 , which reveals a rather advanced crystallization of the sample. Finally, at this temperature even a short annealing for 2 minutes causes a Hc increase by about one order of magnitude from 5 to 70 A·m−1 . In the case of powder one observes a different behaviour. Annealing of ball-milled powder for 2 and 5 minutes at rather low temperatures between 713 K and 753 K reduces the coercive force from 2200–2500 A·m−1 (= Has−prep ) by a factor of 10. However, the resulting values of about 250 A·m−1 are still one order of magnitude higher than for the melt-spun ribbon (Hc = 5–10 A·m−1 ). Annealing for longer time (10, 30 min) or at higher temperatures (753–773 K) causes even higher Hc values than for the as-milled powder. This is due to the beginning of crystallization of the initially amorphous powder. Annealing of the amorphous as-milled powder at the crystallization temperature, Tx ≈ 763 K, for 30 minutes leads to almost complete crystallization and Hc around 7538 A·m−1 . 3.2.3 Compacted samples As was mentioned before, annealing of ball-milled powder leads to a reduction of Hc values which are rather high for the as-milled powder. Accordingly, one can prepare bulk samples with good soft magnetic properties, by combination of pressing and heating (hot pressing). The time and the temperature are most important parameters employed for hot pressing. Both should be kept in the region where one can prevent crystallization and prepare bulk samples with amorphous structure and good soft magnetic properties. The consolidation time is limited by the incubation time for crystallization and the consolidation temperature (Tp ) is selected from the range of the supercooled liquid region. As was mentioned before, in the case of powder the supercooled liquid region becomes narrower compared to the ribbon but the stability against crystallization is still sufficient for successful consolidation of amorphous bulk specimens. Figure 12 displays the coercivity of bulk samples as a function of the compacting temperature Tp . The characteristic temperatures Tg and Tx of the powder determined at a heating rate of 0.67 K·s−1 are also indicated. Coercivity values of 120–140 A·m−1 are found in the temperature regime of the supercooled liquid (see Table 3). The lowest coercivity of about 100 A·m−1 is achieved at 718 K which is the compact-.
(7) M. Stoica et al.. that the maximum thickness for glass formation of cylinders by copper mold casting is about 3 mm16, 30) and for the ring shape bulk amorphous samples: an outer diameter of 10 mm, an inner diameter of 6 mm and a thickness of 1 mm.12). Coercive Force, H c/ Am. -1. 1972. 600 450 Tx 300. 4. Summary. Tg 150 0 720. 740. 760. 780. Compacting temperature, Tp/ K Fig. 12 Coercive force of bulk amorphous Fe77 Al2.14 Ga0.86 P8.4 C5 B4 Si2.6 samples as a function of compacting temperature Tp . Tg and Tx are the characteristic temperatures determined from the DSC scan recorded for Fe77 Al2.14 Ga0.86 P8.4 C5 B4 Si2.6 powder at a heating rate of 0.67 K·s−1 . Table 3 Coercivity of bulk amorphous Fe77 Al2.14 Ga0.86 P8.4 C5 B4 Si2.6 samples. Compaction temperature, Tp /K. Coercive force, Hc /A·m−1. 718 723 728 738 743 748 758 763. 106 127 161 127 136 181 156 212. Magnetization, M/ Acm. -1. 900 600 300 0 -300 -600 -900 -150. -100. -50. 0. 50. 100. Applied Magnetic Field, H/ Acm. 150 -1. Fig. 13 M–H hysteresis loop of a bulk amorphous Fe77 Al2.14 Ga0.86 P8.4 C5 B4 Si2.6 disc with diameter of 10 mm and height of 3 mm.. ing temperature lower then Tg (= 738 K). For higher temperatures than Tx the coercivity of bulk samples increases drastically. A similar behaviour was reported by Schlorke-de Boer et al.21) for Fe72 Al5 P11 C6 B4 Ga2 bulk samples with the lowest coercivity of about 30 A·m−1 . Figure 13 shows the hysteresis loop recorded for a compacted sample with 10 mm diameter and a height of 3 mm as a typical exemple. On can observe the hysteresis loop typical for porous material, where the mixture of nonmagnetic and magnetic particles is present.29) By combination of annealing and consolidation of ballmilled powder at elevated temperatures is possible to prepare Fe-based bulk amorphous specimens with different shapes and higher dimensions in comparison with the samples prepared by copper molt casting. By Inoue et al. was reported. Amorphous multicomponent iron-based alloys with good soft magnetic properties were obtained in bulk form either directly using copper mold casting or by hot pressing of ball-milled amorphous powder. Because for Fe65.5 Cr4 Mo4 Ga4 P12 C5 B5.5 amorphous alloys the glass transition temperature Tg exceeds 748 K, this ferromagnetic glass is sufficiently stable for applications that require a continuous operation at high temperatures. Such alloys can be cast directly in bulk specimens if some conditions are fulfilled, i.e. low impurity content and proper casting temperature. The critical cooling rate is lower in comparison with classical FeB alloys, but higher than for Zr-based or Pd-based alloys.31) This fact limits the thickness of the sample13) and the maximum diameter of the rods obtained by copper mold casting reached 3 mm. The casting temperature plays an important role in order to obtain the amorphous phase. The presence of crystalline clusters/inclusions in the melt that can be centres for heterogeneous crystallization must be avoided. The coercivity of the fully amorphous alloy in rod form is lower than 10 A·m−1 . In the presence of crystalline inclusions, the Hc value increases at 62 A·m−1 and depend on the volume fraction and dimension of the crystalline inclusions. The existence of a small volume fraction of nanoscale crystalline precipitates is not detectable in XRD experiments in reflection configuration. For Fe77 Al2.14 Ga0.86 P8.4 C5 B4 Si2.6 amorphous ribbons, mechanical treatment (ball milling) of the amorphous material influences its soft magnetic properties and causes an increase of the Hc value. The significant increase of coercivity after ball milling is due to the stress field introduced by ball milling as well as to the increased oxygen content in the powders. There is a quite large coercivity relaxation of the ball-milled amorphous powders after annealing at elevated temperatures. Because of the elevated oxygen content after milling and the contribution of surface irregularities to the total coercivity,21) a difference of about one order of magnitude is still present between the Hc values of powder and ribbon. By combination of annealing and consolidation of ball-milled powder at temperatures in the supercooled liquid region bulk amorphous specimen can be prepared with significantly larger dimensions than in the case of the mold-cast samples. The lowest coercive force obtained for the samples compacted in the supercooled liquid region is about 120 A·m−1 , which is about one order of magnitude higher than for the initial melt-spun amorphous ribbon. Acknowledgements The authors thank to Dr. Wolfgang Löser, Dr. Albert Güth, Dr. Nicole Schlorke-de Boer for stimulating discussions and to Heiko Schulze and Maik Peschel for technical assistance. This work was supported by the EU within the framework of the RTN-Network on bulk metallic glasses (HPRN-CT-2000-.
(8) Bulk Amorphous Fe-Based Alloys: Properties and Phase Transformation. 00033) and partly by grant Vega 1/8305/01. REFERENCES 1) 2) 3) 4) 5) 6) 7) 8) 9) 10) 11) 12) 13) 14) 15) 16) 17). A. Inoue and J. S. Gook: Mater. Trans., JIM 37 (1996) 32–38. A. Inoue and J. S. Gook: Mater. Trans., JIM 36 (1995) 1282–1285. A. Inoue: Mater. Sci. Eng. A226–228 (1997) 357–363. T. Mizushima, A. Makino and A. Inoue: IEEE Trans. Mag. 33 (1997) 3784–3784. T. Mizushima, A. Makino and A. Inoue: J. Appl. Phys. 83 (1998) 6329– 6331. A. Inoue, A. Murakami, T. Zhang and A. Takeuchi: Mater. Trans., JIM 38 (1997) 189–196. T. Mizushima, A. Makino and A. Inoue: Mater. Sci. Eng. A226–228 (1997) 721–725. A. Inoue, H. Koshiba, T. Zhang and A. Makino: Mater. Trans., JIM 38 (1997) 577–582. A. Inoue and J. S. Gook: Mater. Trans., JIM 36 (1995) 1180–1183. H. S. Chen: Rep. Prog. Phys. 43 (1980) 353–360. N. Schlorke, J. Eckert and L. Schultz: J. Phys. D: Appl Phys. 32 (1999) 855–861. T. Mizushima, K. Iskarashi, S. Yoshida, A. Makino and A. Inoue: Mater. Trans., JIM 40 (1999) 1019–1022. A. Inoue, T. Zhang and A. Takeuchi: Appl. Phys. Lett. 71 (1997) 464– 466. A. Gebert, J. Eckert and L. Schultz: Acta Mater. 46 (1998) 5475–5482. T. D. Shen and R. B. Schwarz: Appl. Phys. Lett. 75 (1999) 49–51. A. Inoue, A. Makino and T. Mizushima: J. Appl. Phys. 81 (1997) 4029– 4031. A. Inoue, A. Kato, T. Zhang, S. G. Kim and T. Masumoto: Mater. Trans., JIM 32 (1991) 609–616.. 1973. 18) Y. He, T. Shen and R. B. Schwarz: Metall. Mater. Trans. A 29 (1998) 1795–1804. 19) J. Eckert, N. Schlorke, C. A. R. T. Miranda and L. Schultz: Synthesis and Processing of Light Weight Mettalic Materials II ed. C. M. WardClose et al., (Warrendale: The Minerals Metals and Materials Society, 1997) pp. 383–394. 20) M. Seidel, J. Eckert, H.-D. Bauer and L. Schultz: Mater. Sci. Forum 119 (1996) 225–227. 21) N. Schlorke-de Boer, R. Schäfer, J. Eckert and L. Schultz: submitted to J. Appl. Phys. 22) N. Schlorke-de Boer: Metallische Massivgläser auf Fe–Al–P–C–B– (Ga-) Basis und Verbundmaterialien mit Mg–Y–Cu-Glas Matrix, Ph. D. Thesis, Technical University Dresden 2001. 23) R. B. Schwarz and Y. He: Mater. Sci. Forum 235–238 (1997) 231–240. 24) J. Eckert: Mater. Sci. Forum 3–12 (1999) 312–314. 25) J. Eckert, N. Mattern, M. Zinkevitch and M. Seidel: Mater. Trans., JIM 39 (1998) 623–632. 26) N. Schlorke, J. Eckert and L. Schultz: Synthesis and Properties of Bulk Mettalic Mg–Y–Cu Lightweight Alloys Produced By Mechanical Alloying and Prapid Quenching, ed. B. L. Mordike and K. U. Kainer (Werkstoff-Informationsgesellschaft: Magnesium Alloys and their Applications, Frankfurt, 1998) pp. 533–538. 27) B. Weiß and J. Eckert: Mater. Sci. Forum 343–346 (2000) 129–134. 28) Ch. Kuhrt and L. Schultz: J. Appl. Phys. 71 (1992) 1896–1900. 29) E. Kneller: Ferromagnetismus, (Springer-Verlag Berlin, 1962) pp. 102– 105. 30) A. Inoue: Mater. Sci. Eng. A304–306 (2001) 1–10. 31) A. Inoue and K. Hashimoto (Eds.): Amorphous and Nano-crystalline Materials, Preparation, Properties and Applications, (Springer, 2001) pp. 4–7..
(9)
Figure
+2
Related documents