Effect of Cu and Zr Additions on the Superplastic Behavior of 6061 Aluminum Alloy
8
0
0
Full text
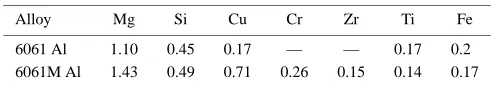
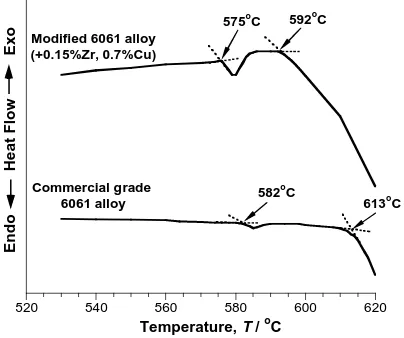
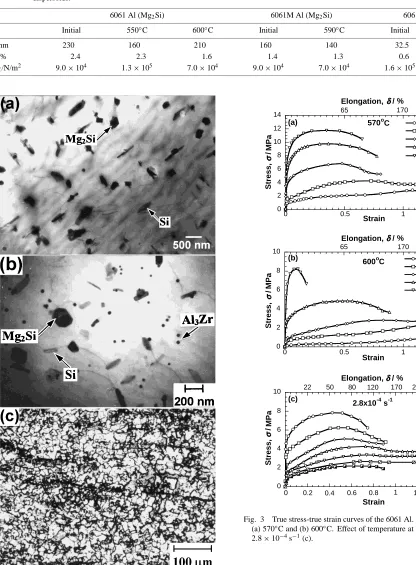
(2) Effect of Cu and Zr Additions on the Superplastic Behavior of 6061 Aluminum Alloy. sectional dimensions of 5 mm × 1 mm and 5 mm × 3 mm, respectively. The mechanical characterization methods have been reported previously.9, 10) The heat of fusion of these alloys was determined by using differential thermal analysis (DTA) which was performed with a 15.2 mg specimen of the 6061 Al and a 10.6 mg specimen of the 6061M Al. Samples were heated to 670◦ C at a rate of 10◦ C·min−1 in air by using a Rigaku analyzer (Model Thermoflex). Pure indium (99.99%), tin (99.9%) and zinc (99.99%) were used to calibrate the DTA equipment. The heat of fusion, ∆H , was calculated as ∆H = K × F/G. (1). where K is equipment constant, F is peak area taking from experimental curve and G is sample weight. Cavitation was measured within the sample body to avoid the effect of surface diffusion. For this purpose, the surface layer with ∼ 0.5 mm thickness was eliminated by mechanical polishing. The central areas of the specimens strained up to ε = 1.1 and areas of specimens strained up to failure (located 5 mm from the fracture surface) were examined. Details of microstructural examinations by optical metallography and transmission electron microscopy as well as a cavitation study were also described previously.9, 10) 3. Experimental Results 3.1 Differential thermal analysis DTA curves for the 6061 Al and the 6061M Al are shown in Fig. 1. The onset temperatures for melting were determined by the intersection of the two dotted lines indicated in Fig. 1. It is evident that for both alloys there exists a temperature interval between the incipient melting point, Ti (a small amount of liquid phase is formed) and the solidus temperature, Ts (extensive melting occurs). Thus there exists the temperature interval, Ti –Ts , in which a small amount of liquid phase is present in the microstructure. Presumably, the liquid phase formed at Ti is segregated at the triple junctions and along grain boundaries.11) The incipient melting point Ti (∼ 575◦ C) in the 6061M Al is 7◦ C less than that for the 6061 Al (∼ 582◦ C). The solidus temperature Ts (∼ 592◦ C) for the. o. 592 C. Commercial grade 6061 alloy. 3.2 Initial microstructure Typical microstructures of the 6061 Al and the 6061M Al after homogenization are shown in Fig. 2(a) and (b) respectively. An analysis of dispersoids in thin foils was reported early.9, 10) It was shown that Zr additions resulted in the formation of Al3 Zr dispersoids with an average size of about 30 nm in the 6061M Al (Fig. 2(b)).9, 10) Their volume fraction is about 0.6 pct (Table 3). Al3 Zr particles were enriched by silicon.10) As a result, the volume fraction of Al3 Zr dispersoids is, at least, twice as high as that given by the binary phase diagram even assuming that all Zr is present in dispersoids.10) In the initial state of the 6061M Al the volume fraction (∼ 1.4%) and size (∼ 140 nm) of Mg2 Si-particles are less than those in the 6061 Al (Fig. 2, Table 3). No significant changes in volume fraction and sizes of these particles were revealed after static annealing at T ≤ 590◦ C in the 6061M Al (Table 3).10) In contrast, static annealing of the 6061 Al resulted in partial dissolution of the Mg2 Si-phase and elemental silicon particles. In the 6061M Al the volume fraction and size of Al3 Zr dispersoids remained virtually unchanged during static annealing at T > Ti (Table 3).10) For instance, volume fraction of Al3 Zr dispersion particles in the 6061M Al was ∼ 0.5% after static annealing at 590◦ C for 14 hours (Table 3).10) Coarse α-AlFeSi particles with irregular shape and having a size of ∼ 2 µm are present in the initial structure of both alloys.10) Their morphology and size are similar in both grades of the 6061 aluminum. The TMP resulted in the formation of a uniform microstructure with an average grain size of 13.5 µm (Fig. 2(c)) in the 6061 Al and 11.2 µm in the 6061M Al.9, 10). o. 582 C. o. 613 C. Endo 520. 6061M Al is 21◦ C less than that for the 6061 Al with standard chemical composition (613◦ C). It is noted that Ti for the 6061 Al matches exactly with the melting point for an ingot-metallurgy 6061 Al reported previously.12, 13) It is apparent that the reduced melting point in the 6061M Al can be caused by a progressive dissolution of alloying additions with increasing temperature, resulting in a weak exothermic reaction at T ≤ 575◦ C followed by an endothermic reaction. The heat of fusion of extensive melting for the 6061 Al and the 6061M Al are very similar (Table 2). The heat of fusion for partial melting of the 6061 Al is significantly less than that for the 6061M Al (Table 2).. 3.3 Superplastic behavior Typical true stress-true strain (σ –ε) curves for the commercial 6061 aluminum alloy at 570◦ C, at which the material is entirely in the solid state, and 600◦ C, which is higher than Ti , are presented in Figs. 3(a) and (b), respectively. Re-. Heat Flow. Exo. o. 575 C Modified 6061 alloy (+0.15%Zr, 0.7%Cu). 2393. Table 2 Heat of fusion for extensive melting, ∆Hs , heat of fusion for partial melting, ∆Hi , and volume fraction (V ) of a liquid phase (approximately) in partial melting state for the two grades of the 6061 aluminum alloy. 540. 560. 580. 600. 620. o. Temperature, T / C. Fig. 1 DTA curves for the 6061 Al and 6061M Al. The arrows indicate the incipient melting points, Ti , and solidus temperatures, Ts .. Alloy 6061 6061M. ∆Hs /J/g. ∆Hi /J/g. V /%. 247.4 249.6. 0.23 2.76. 0.1 1.1.
(3) 2394. R. Kaibyshev, F. Musin, D. Gromov, T. G. Nieh and D. R. Lesuer Table 3 The Zener drag pressure (PZ ) calculated for Al3 Zr and Mg2 Si particles and average size (d) and volume fraction (V ) of these dispersoids. 6061 Al (Mg2 Si). d/nm V /% PZ /N/m2. 6061M Al (Mg2 Si). Initial. 550◦ C. 600◦ C. 230 2.4 9.0 × 10⁴. 160 2.3 1.3 × 10⁵. 210 1.6 7.0 × 10⁴. 6061M Al (Al3 Zr). Initial. 590◦ C. Initial. 590◦ C. 160 1.4 9.0 × 10⁴. 140 1.3 7.0 × 10⁴. 32.5 0.6 1.6 × 10⁵. 24.4 0.5 1.8 × 10⁵. /%. Elongation,. / MPa. 350. 570oC. (a). 12. Stress,. 170. 65. 14. -5. -1. 7.0x10 s -4 -1 2.8x10 s -3 -1 1.4x10 s -3 -1 7.0x10 s -2 -1 2.8x10 s. 10 8 6 4 2 0. 0. 0.5. Elongation,. / MPa Stress,. 170. (b). 350. o. -5. 7.0x10 -4 1.4x10 -4 2.8x10 -3 1.4x10 -3 7.0x10. 600 C. 8 6. -1. s -1 s -1 s -1 s -1 s. 4 2 0. 0. 0.5. 50. (c). 1. Strain. Elongation, 22. 10. / MPa. 1.5. /%. 65. 10. Stress,. 1. Strain. 80. 120 -4. 2.8x10 s. 1.5. /% 170. 230. 395. 305 o. 500 C o 525 C o 550 C o 570 C o 590 C o 600 C o 610 C. -1. 8 6 4 2 0 0. 0.2. 0.4. 0.6. 0.8. 1. 1.2. 1.4. 1.6. Strain. Fig. 3 True stress-true strain curves of the 6061 Al. Effect of strain rate at: (a) 570◦ C and (b) 600◦ C. Effect of temperature at an initial strain rate of 2.8 × 10⁻⁴ s−1 (c).. Fig. 2 TEM observations of the 6061 Al (a) and 6061M Al (b); optical micrograph of the microstructure in the 6061 Al after the two-step TMP (c).. sults are reported for strain rates ranging from 7 × 10⁻⁵ to 2.8 × 10⁻² s−1 . Figure 3(c) shows the σ –ε curves at an initial strain rate of 2.8 × 10⁻⁴ s−1 and temperatures ranging from 500 to 610◦ C for the 6061 Al. The σ –ε curves for the 6061M Al were reported earlier;9, 10) the typical curves are depicted. in Fig. 4. It is seen that the effects of temperature and strain rate on the trend of the changing stress with increasing strain is similar for both alloys (Figs. 3 and 4).9, 10) This effect was described earlier in detail.9, 10) It should be noted that in the 6061 Al alloy, secondary strain hardening was found only in the partial melted state at ε̇ ≤ 2.8 × 10⁻⁴ s−1 (Fig. 3(b)). At the same time, in the 6061M Al alloy, significant secondary strain hardening takes place after steady-state flow both below and above the incipient melting point, Ti , (Fig. 4) at low strain rates.9, 10) It should be emphasized that secondary strain.
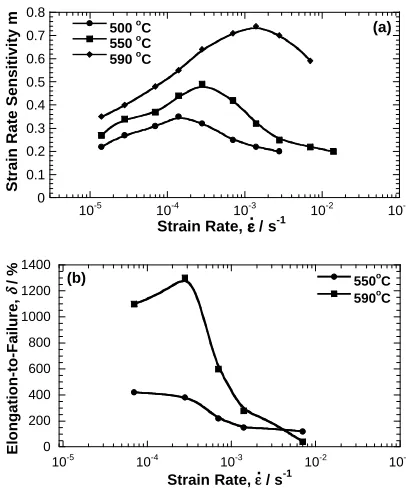
(4) Effect of Cu and Zr Additions on the Superplastic Behavior of 6061 Aluminum Alloy o. 640 -4. 2.8x10 s. 12. 1120. -1. o. 8 6. 1. 4. 0.1. 2. 10-5. 10-4. 1. 0.5. 1.5. 2. 2.5. -1. Fig. 4 Typical true stress-true strain curves of the 6061M Al. 16. 6061 6061M. 14 12 10 8 6. (b). 0.7. o. 550 C o 570 C o 590 C o 600 C o 610 C. 0.6 0.5 0.4 0.3 0.2 0.1 0. 10-5. 10-4. 10-3 .. -1. 580. 600. 620. o. Temperature, T / C. Fig. 5 Effect of temperature on flow stress taken at a true strain of 0.4 for two grades of the 6061 aluminum alloy.. hardening starts in the 6061 Al at strains which are significantly less than those in the 6061M Al. Notably the uniform deformation visible within the gauge length occurs in both materials at all temperatures and strain rate examined.4, 9, 10) In both alloys, an increase in temperature (Fig. 5) or a decrease in strain rate (Figs. 3, 4, 6(a)) results in a decrease in flow stress and a reduction in initial work hardening. It is seen that at T ≤ 550◦ C, the flow stress for the 6061 Al is less than that for the 6061M Al (Fig. 5). This effect can be attributed to dispersion strengthening by Al3 Zr particles. At higher temperatures, the flow stress for the 6061 Al becomes higher than that for the 6061M Al. The flow stress in the 6061 Al is about 2 times the flow stress in the 6061M Al at 590◦ C (Fig. 5). Figure 6 shows the effects of initial strain rate on the mechanical properties of the 6061 Al. The flow stress taken at a true strain of ∼ 0.15 is plotted as a function of initial strain rate on a double logarithmic scale in Fig. 6(a). The variation of strain rate sensitivity, m, and elongation-to-failure, δ, with strain rate is shown in Figs. 6(b) and (c), respectively. For comparison, the coefficient of strain rate sensitivity, m, and elongation-to-failure, δ for the 6061M Al are plotted as a function of initial strain rate in Fig. 7. It is seen that increasing temperature, which results in partial melting, has a significantly stronger influence on the mechanical behavior of the 6061M Al than the 6061 Al (Figs. 6 and 7).9, 10) Both aluminum alloys exhibit a sigmoidal relationship between flow stress and strain rate (Fig. 6(a)),9, 10) which is typical for superplastic behavior7, 8) and corresponds with three regions of superplastic deformation.7, 8) For the 6061 Al, the strain rate at which the highest m value occurs, decreases by a factor of two-from 2.8×10⁻⁴ at 550◦ C to 1.4×10⁻⁴ s−1 at 610◦ C (Fig. 6(b)); the highest m value increases from 0.45 to 0.7 (Fig.. /% 560. 300. 350. (c). 10-1. o. 570 C o 600 C. 250 200 150 100 50 0. 10-5. 10-4. 10-3. Strain Rate,. .. 10-2. 10-1. -1. /s. Fig. 6 Variation of flow stress, σ , taken at a true strain of 0.15, (a); the coefficient of strain rate sensitivity, m, (b); elongation-to-failure, δ, (c) with strain rate for the 6061Al.. Strain Rate Sensitivity m. 540. 0.8. o. (a). 500 C o 550 C o 590 C. 0.7 0.6 0.5 0.4 0.3 0.2 0.1 0. 10-5. 10-4. 10-3.. Strain Rate, /%. 520. -1. 10-2. 10-1. /s. 1400 1200. Elongation-to-Failure,. 500. 400. Elongation-to-Failure,. 2. 10-2. /s. Strain Rate,. 480. 10-1. 0.8. 4 0 460. 10-2. /s. 3. Strain. Strain Rate Sensitivity m. 0. / MPa. 10-3.. Strain Rate,. 0. Stress,. (a). 570 C o 590 C o 600 C o 610 C. 10. 1910. 500 C o 550 C o 570 C o 590 C. 10. Stress,. / MPa. /%. 350. / MPa. 170. Stress,. Elongation, 65. 14. 2395. (b). o. 550 C o 590 C. 1000 800 600 400 200 0 10-5. 10-4. 10-3. .. Strain Rate, / s. 10-2. 10-1. -1. Fig. 7 Variation of the coefficient of strain rate sensitivity, m, (a); elongation-to-failure, δ, (b) with strain rate for the 6061M Al..
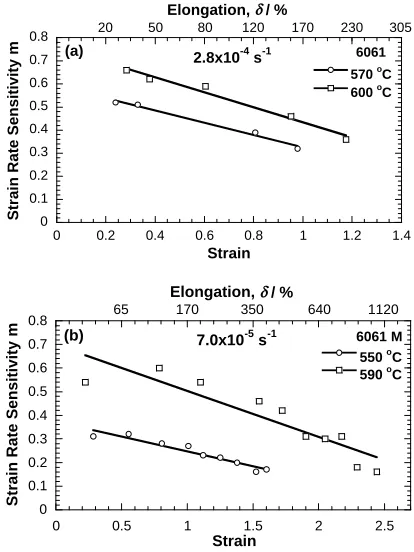
(5) /%. 1400 1200. TS. 6061 6061M. 1000. (a). Ti. 800 600 400. Ti. TS. 200 0 480. 500. 520. 540. 560. 580. 600. o. 620. Strain Rate Sensitivity m. Temperature, T / C 1. (b). -4. 2.8x10 s. -1. 0.8 0.6 0.4 6061 6061M. 0.2 460. 480. 500. 520. 540. 560. 580. o. 600. 620. Temperature, T / C. Fig. 8 Effect of temperature on elongation-to-failure, δ, (a) and m value (b) at ε̇ = 2.8 × 10⁻⁴ s−1 for the both alloys. Arrows indicate partial melting (Ti ) and solidus temperatures (Ts ).. Elongation, Strain Rate Sensitivity m. 6(b)). In contrast, for the 6061M alloy an increase in temperature from 550 to 590◦ C results in a factor of ten increase in the strain rate, at which the highest value of the m coefficient is observed,9, 10) (Fig. 7(a)). The optimal strain rate region (i.e. Region 2) for superplasticity, in which m ≥ 0.33,7, 8) expands from 2.8×10⁻⁵ –1.4×10⁻³ s−1 to 1.4×10⁻⁵ –7×10⁻³ s−1 .9, 10) As a result, increasing temperature results in higher m values throughout the entire strain rate region in the 6061M Al. For the 6061 Al, at ε̇ ≥ 2.8 × 10⁻³ s−1 the m value appears to be insensitive to temperature. For low strain rates (Region 1), increasing temperature results in minor increases in the m value. Therefore, for the 6061Al, partial melting has very little influence on deformation mechanisms observed at high strain rates. In the entirely solid state the δ value exhibits a maximum at the slowest strain rate and decreases with increasing strain rate for the both alloys (Figs. 6(c) and 7(b)). In addition, the ductilities of both alloys are essentially the same. For the 6061 Al, partial melting results in a slight increase in elongation-to-failure at ε̇ < 10−3 s−1 , and a pronounced decrease in ductility at higher strain rates (Fig. 6(c)). A poorlydefined peak in the elongation-to-failure can be distinguished at ε̇ = 1.4 × 10⁻⁴ s−1 and 600◦ C (Fig. 6(c)). In contrast, partial melting of the 6061M Al highly enhances ductility and results in the appearance of a well-defined maximum in δ value at ε̇ = 2.8 × 10⁻⁴ s−1 (Fig. 7(b)). For instance, at 550◦ C, the maximum m value is about 0.5 at ε̇ = 2.8 × 10⁻⁴ s−1 and elongation-to-failure is 420% at ε̇ = 7 × 10⁻⁵ s−1 , and, at 590◦ C, the highest value of elongation-to-failure (1300%) is observed at ε̇ = 2.8 × 10⁻⁴ s−1 , which corresponds with m = 0.65. Therefore, in the partial melted state the values of elongation-to-failure of the 6061M Al are significantly higher than those of the 6061Al. Notably, a decrease in tensile ductility at ε̇ ≥ 7 × 10⁻³ s−1 with increasing temperatures higher than Ti is also observed in the 6061M Al. In Fig. 8, the elongation-to-failure, δ, and m value at ε̇ = 2.8 × 10⁻⁴ s−1 are plotted as a function of temperature for both alloys, in which the highest ductilities were attained in the partial melted state. However, in the 6061M Al, the δ value increases sharply at temperatures above Ti (Fig. 8(a)). In the 6061Al, a gradual increase in ductility also takes place with increasing temperature at T ≤ 600◦ C (Fig. 8(a)). Notably, at T ≤ 550◦ C, the m values are essentially similar for both alloys (Fig. 8(b)). At T > 550◦ C, the strain rate sensitivity in the 6061M Al is higher than that in the 6061Al. It is apparent that increased elongation-to-failure in the 6061Al in the partial melted state is attributed to gradual increase in the m value. No significant enhancement of elongation-tofailure by partial melting takes place in the 6061Al. The δ values for the 6061Al below and above Ti are very similar. Increasing temperature in the partial melted state at T ≥ 600◦ C leads to only slightly decreased ductility (∼ 170% at 610◦ C) (Fig. 8(a)). At 620◦ C, failure occurs with limited plastic flow. Since the solidus temperature is below 613◦ C, reduction of ductility is apparently associated with the presence of massive liquid phase. In both alloys, the total elongation drops dramatically at the solidus temperature, Ts , as macroscopic melting starts to occur (Fig. 8(a)). The ductility drops despite the fact that the m value approaches unity (Fig. 8(b)). In the both alloys, the coefficient of strain rate sensitivity. Elongation-to-failure,. R. Kaibyshev, F. Musin, D. Gromov, T. G. Nieh and D. R. Lesuer. 20. 0.8. 50. 80. (a). 0.7. /%. 120 -4. 2.8x10 s. 170. 230. -1. 305. 6061 o. 570 C o 600 C. 0.6 0.5 0.4 0.3 0.2 0.1 0 0. 0.2. 0.4. 0.6. 0.8. 1. 1.2. 1.4. Strain. Elongation, Strain Rate Sensitivity m. 2396. 65. 0.8. 170. (b). 0.7. /%. 350 -5. 7.0x10 s. 640 -1. 1120 6061 M o 550 C o 590 C. 0.6 0.5 0.4 0.3 0.2 0.1 0 0. 0.5. 1. 1.5. 2. 2.5. Strain. Fig. 9 Effect of strain on the coefficient of strain rate sensitivity, m, for both 6061 aluminum alloys. (a) for the 6061Al at 570 and 600◦ C, ε̇ = 2.8 × 10⁻⁴ s−1 ; (b) for the 6061M Al at 550 and 590◦ C, ε̇ = 7.0 × 10⁻⁵ s−1 .. tends to decrease with strain below and above the incipient melting point (Fig. 9). Degradation in the m value with strain occurs in the 6061 Al with higher rate (Fig. 9(a)) compared with the 6061M Al (Fig. 9(b))..
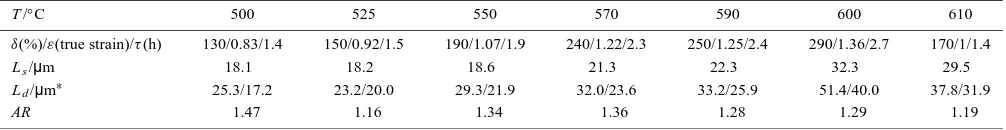
(6) Effect of Cu and Zr Additions on the Superplastic Behavior of 6061 Aluminum Alloy. 2397. Table 4 Grain size measurements in the 6061 Al after superplastic deformation at ε̇ = 2.8 × 10⁻⁴ s−1 in the grip and gauge sections. T /◦ C δ(%)/ε(true strain)/τ (h) L s /µm L d /µm∗ AR ∗ the. 500. 525. 550. 570. 590. 600. 610. 130/0.83/1.4 18.1 25.3/17.2 1.47. 150/0.92/1.5 18.2 23.2/20.0 1.16. 190/1.07/1.9 18.6 29.3/21.9 1.34. 240/1.22/2.3 21.3 32.0/23.6 1.36. 250/1.25/2.4 22.3 33.2/25.9 1.28. 290/1.36/2.7 32.3 51.4/40.0 1.29. 170/1/1.4 29.5 37.8/31.9 1.19. numerator and denominator are the grain sizes measured in the tension/transverse directions. Table 5 Grain size measurements in the 6061M Al after superplastic deformation at ε̇ = 2.8 × 10⁻⁴ s−1 in the grip and gauge sections.. T /◦ C L s /µm L d /µm∗ AR ∗ the. 500. 525. 550. 570. 590. 600. 17.6 18/13.7 1.3. 18.8 18.5/14.7 1.26. 20.5 21.6/18.0 1.2. 21.9 25.2/21.4 1.18. 21.3 32.0/26.0 1.23. 26.4 — —. numerator and denominator are the grain sizes measured in the tension/transverse directions.. 3.4 Microstructural evolution The microstructural evolution at ε̇ = 2.8×10⁻⁴ s−1 of both alloys was studied under conditions of static annealing (grip section) and dynamic annealing (i.e. gauge section). Grain sizes observed after static annealing (L s ), dynamic annealing (L d ) and the grain aspect ratio (AR) are summarized in Tables 4 and 5. The 6061 Al samples were pulled to failure, but the 6061M Al samples were strained to ε = 1.1 (equivalent time of static annealing is 2 h.). However, the exposure times (τ ) at temperature were essentially same for the both alloys and the annealing conditions. It is noted that static annealing produces a similar grain size in the both alloys (Tables 4 and 5), despite the aforementioned difference in the phase composition. Significant static grain growth occurs at 500◦ C and results in an average grain size of about 18 µm. Further temperature increase results in slightly additional static grain growth. Notably, no significant additional grain growth occurs above the incipient melting temperatures, Ti , relative to temperatures below Ti . In the 6061Al, extensive static grain growth starts to occur at 600◦ C (Table 4). Thus, both alloys exhibit superplastic behavior despite the fact that the alloys have a relatively coarse (∼ 20 µm) initial grain size. Superplastic deformation results in significantly higher grain growth in the 6061 Al as compared to that in the 6061M Al (Tables 4 and 5). It is seen that the 6061 Al exhibits the low stability of fine grains under superplastic deformation (Table 4). In comparison, the ∼ 20 µm grains are essentially stable in the 6061M Al (Table 5).10) In addition, in the temperature range 550–600◦ C having extensive superplastic deformation, the grain aspect ratio in the 6061M Al, defined as the ratio of the grain dimension in the tension direction to that in the transverse direction, is less than that in the 6061 Al. The lower AR values can be associated with a higher contribution of grain boundary sliding (GBS) to the total deformation.7, 8) This result suggests that the microstructure of 6061M Al evolves during superplastic deformation in a manner typical for deformation dominated by GBS in the temperature interval 550–590◦ C. Both concurrent grain growth and an increase in the grain aspect ratio with strain during superplastic deformation are expected to reduce the likelihood of GBS and thus superplastic elongation in the 6061 Al.. Table 6 Average cavity size (A), cavity aspect ratio (CAR), and cavity volume fraction (V ), for the 6061 Al deformed at ε̇ = 2.8 × 10⁻⁴ s−1 to ε = 0.9. T /◦ C. 550. 570. 600. 610. A/µm∗. 12.1/10.2 1.2 3.2. 14.7/12.4 1.2 4.1. 12.3/9.2 1.3 1.4. 19.7/12.9 1.5 3.9. CAR V /%. ∗ the numerator and denominator are the grain sizes measured in the tension/ transverse directions.. 3.5 Characterization of cavitation The cavitation resulting from superplastic deformation in tension was measured on specimens of the 6061 Al strained to ε = 0.9 at a strain rate of 2.8 × 10⁻⁴ s−1 and different temperatures. The cavitation in these samples was then determined metallographically. The average cavity size (A), cavity aspect ratio (CAR), and porosity volume fraction (V ) for the 6061 Al are represented in Table 6. These results can be compared with cavitation data for the 6061M Al. Samples of the 6061M Al were strained to ε = 1.1 at the similar strain rate.9, 10) Relative to the 6061M Al,9, 10) the 6061 Al exhibits significantly increased cavitation at all temperatures examined despite the decreased strain at which the characterization of cavitation was carried out. Also, partial melting hinder cavitation in the 6061 Al, significantly, as well as in the 6061M Al. In both alloys, cavity sizes as well as the volume fraction of cavities are less in the partially melted state than those in the solid state.9, 10) 4. Discussion Table 7 shows optimal temperature of superplastic deformation, Tsp , for the both alloys with initial grain size after TMP, di , and strain rate, ε̇, at which highest values of elongation-to-failure, δ, and the coefficient of strain rate sensitivity, m, have been obtained. Melting points of the two grades of the 6061 aluminum alloy are represented by Ti , which is the incipient melting temperature, and Ts , which is the solidus temperature. It is seen that the 6061 Al exhibits moderate superplastic properties near the incipient melting temperature. Additions of Zr and Cu to this alloy greatly en-.
(7) 2398. R. Kaibyshev, F. Musin, D. Gromov, T. G. Nieh and D. R. Lesuer Table 7. Alloy 6061 Al 6061M Al. Superplastic properties and thermal stability for the both 6061 aluminum alloys. di /µm. Tsp /◦ C. ε̇/s−1. δ/%. m. Ti /◦ C. Ts /◦ C. 13.5 11.2. 600 590. 1.4 × 10⁻⁴ 2.8 × 10⁻⁴. 350 1300. 0.6 0.65. 582 575. 613 592. hance the superplastic characteristics. Two features of superplastic behavior for both 6061 alloys can be discussed. (i) The 6061 aluminum alloys with different chemical compositions exhibit superplasticity below and above the incipient melting temperature even with an initial relatively coarse-grained structure. However, the best superplastic properties of the 6061 aluminum alloy occur in the partially melted state (Table 7), i.e. within the temperature interval of Ti –Ts . (ii) Partial melting enhances ductility and strain rate sensitivity. No significant effect of partial melting on the optimal strain rate for superplasticity was noticed. This characteristic results from the fact that high superplastic ductility in the partially melted state is attributed to a lower cavitation level, which is, in turn, associated with enhanced accommodation for GBS.10) At strain rates higher than ∼ 10−2 s−1 , the partial melting leads to a drop in the elongation-to-failure. 4.1 The role of Zr Details of calculation of Zener drag pressure was reported early,10) and data obtained for both alloys are summarized in Table 3. It is seen that the Zener drag pressures, PZ , evaluated for Al3 Zr and Mg2 Si particles differ by over a factor of two. It is apparent that the restraining force, which originates from Mg2 Si particles, can provide high stability of microstructure under static annealing in both alloys. As a result, the grain sizes evolved after static annealing in both alloys are essentially similar at T ≤ 590◦ C. However, this Zener drag is not sufficient to provide stability of microstructure under superplastic deformation. As a result, in the 6061 Al alloy, superplastic deformation is accompanied by extensive grain growth, which leads to reducing m value during superplastic deformation that limits superplastic ductility. Mg2 Si particles are not effective for inhibiting dynamic grain growth, especially in the temperature interval of Ti –Ts at low strain rates. It was previously established9, 10) that high microstructure stability (grain size ∼ 20 µm) of the 6061M Al in the temperature interval Ti –Ts is responsible for the enhancement of superplastic properties. It seems that this stability is provided by Zener drag pressure originated from Al3 Zr dispersoids. The fine Al3 Zr particles effectively restrict grain growth in the 6061M Al during superplastic deformation.9, 10) Thus, in the 6061M Al the dynamic grain growth occurs at a much lower rate as compared to that in 6061 Al due to the presence of Al3 Zr dispersoids. As a result, 6061M Al can exhibit increased ductility in the entirely solid state range, and superior superplastic properties in the temperature range of Ti –Ts . It is worth noting that the ductility of the 6061M Al is also limited by grain growth during superplastic deformation.10) The grain coarsening results in the termination of steady-state of superplastic deformation and establishment of. secondary hardening stage.10) However, this transition does not occur until the grain size is less than ∼ 30 µm (at ε ≥ 2)10) permitting significant plasticity in 6061M Al prior to fracture. It is apparent that the difference between flow stresses for 6061M Al and 6061 Al at T > 550◦ C is also associated with the enhanced stability of microstructure in the 6061M Al during superplastic deformation. This statement is supported by the difference in the m value at T > 550◦ C (Fig. 8(b)). Evidently, GBS under a low shear stress in 6061M Al results in a high contribution to total elongation. 4.2 The role of Cu Since no remarkable dissolution of Al3 Zr dispersoids was found at 590◦ C (Table 3),10) the increment in the heat fusion for the 6061M Al containing enhanced amount of Cu can only be attributed to the melting of a copper-bearing phase, for instance a pseudo-ternary eutectic phase such as CuMgAl2 , which can present primarily in the triple junctions and grain boundaries.12, 14–16) The volume fraction of a liquid phase resulted from the partial melting can be approximately evaluated from the ratio between the heat fusion for partial melting and the heat fusion for extensive melting17) resulting in completely liquid state. The volume fractions of a liquid phase at the end of partial melting are listed in Table 2 for both grades of 6061 aluminum alloy. It is seen that in the 6061M Al the volume fraction of liquid phase in the partial melting state in the temperature interval of Ti –Ts is ∼ 1% that is higher by a factor of 10 than the amount of liquid phase in the 6061 Al. It seems that the 1% is optimal amount of liquid phase to suspend cavitation in the 6061 aluminum alloy. This amount of liquid phase is enough to provide proper accommodation for grain boundary sliding12–16, 18) during superplastic deformation in the temperature interval of Ti –Ts . Notably the essentially similar amount of liquid phase for the optimum superplasticity of Si3 N4p(1 µm) /Al–Mg–Si composite was reported in work,17) in which the optimal volume fraction of a liquid phase was estimated to be in range from 0.6 to 1.8%. In the 6061 Al, the volume fraction of liquid phase formed at Ti is too small (∼ 0.1%). This amount of liquid phase can not provide proper accommodation of GBS. As a result, cavitation takes place in the 6061 Al yielding fracture at a moderate elongation (≤ 350%). It should be noted that large elongations in 6061M Al were not obtained when the temperature was more then Ts , as shown in Fig. 8(a). This indicates that a much larger volume fraction of liquid does not contribute to large elongations.19) Increasing volume fraction of liquid phase at 600◦ C about two times (Fig. 1) leads to dramatically drop of superplastic properties in the 6061M Al. It may be associated with intergranular decohesion at grain boundaries. Thus, there exists the optimum volume fraction of liquid phase (∼ 1%) for achieving high superplastic properties in.
(8) Effect of Cu and Zr Additions on the Superplastic Behavior of 6061 Aluminum Alloy. the temperature interval from incipient melting point, Ti , to solidus temperature, Ts . 5. Conclusions (1) Superplasticity was observed in 6061 Al thermomechanical processed to produce a uniform structure with an average grain size of 13.5 µm. It was shown that the 6061 alloy exhibited superplasticity at ε̇ = 7 × 10⁻⁵ s−1 with a high elongation-to-failure of 310% at 570◦ C (solid state), and with a maximum tensile elongation of 350% at 600◦ C and ε̇ = 1.4 × 10⁻⁴ s−1 (partial liquid state). (2) Static grain growth in 6061 Al results in a relatively coarse-grained structure (∼ 20 µm). This structure exhibits high stability under static annealing but becomes unstable under superplastic deformation, and dynamic grain growth limits the superplastic elongation of 6061 Al. (3) A 0.15%Zr addition to 6061 Al results in the formation of Al3 Zr dispersoids, which stabilizes the microstructure under superplastic deformation and results in enhanced superplastic ductility. A 0.7%Cu addition to 6061 alloy results in an increased amount of liquid phase at the incipient melting temperature which suspend cavitation during superplastic deformation. These two factors allow the achievement of superior superplastic properties (elongation-to-failure of ∼ 1300%) in the partial-liquid state. Acknowledgements This work was performed under the auspices of the U.S. Department of Energy by the Lawrence Livermore National Laboratory under contract No. W-7405-Eng-48. REFERENCES 1) E. Kovacs-Cseteny, T. Torma, T. Turmezey, N. Q. Chinh, A. Juhasz and I. Kovacs: J. Mater. Sci. 27 (1992) 6141–6145.. 2399. 2) L. P. Troeger and E. A. Starke, Jr.: Mater. Sci. Eng. A277 (2000) 102– 113. 3) L. P. Troeger and E. A. Starke, Jr.: Mater. Sci. Eng. A293 (2000) 19–29. 4) T. G. Nieh, R. Kaibyshev, F. Musin and D. R. Lesuer: Superplasticity and Superplastic Forming, ed. by A. K. Ghosh and T. R. Bieler (TMS, 1998) pp. 137–144. 5) K. Kannan, C. H. Johnson and C. H. Hamilton: Metall. Mater. Trans. 29A (1998) 1211–1220. 6) T. G. Nieh, L. M. Hsiung, J. Wadsworth and R. Kaibyshev: Acta Mater. 46 (1998) 2789–2800. 7) T. G. Nieh, J. Wadsworth and O. D. Sherby: Superplasticity in Metals and Ceramics, (Cambridge University Press, New York, 1996) pp. 10– 36. 8) O. A. Kaibyshev: Superplasticity of Alloys, Intermetallides and Ceramics, (Springer-Verlag, Berlin, 1992) pp. 12–54. 9) R. Kaibyshev, F. Musin, D. Gromov, T. G. Nieh and D. R. Lesuer: Scr. Mater. 47 (2002) 569–575. 10) R. Kaibyshev, F. Musin, D. Gromov, T. G. Nieh and D. R. Lesuer: Mater. Sci. Tech. (2002) (accepted for publication). 11) K. Higashi, T. G. Nieh, M. Mabuchi and J. Wadsworth: Scr. Metall. Mater. 32 (1995) 1079–1084. 12) W. Cubberly, H. Baker, D. Benjamin, P. Unterweiser, C. Kirkpatric, V. Knoll and K. Nieman: Metals Handbook, Ninth Edition. v.2 Properties and Selection: Nonferrous Alloys and Pure Metals, (American Society for Metals, Metals Park, Ohio, 1979) pp. 115–117. 13) M. Mabuchi and K. Higashi: Mater. Trans., JIM 35 (1994) 399–405. 14) J. Koike, M. Mabuchi and K. Higashi: Acta Metall. Mater. 43 (1995) 199–206. 15) M. Mabuchi and K. Higashi: Philos. Mag. Lett. 70 (1994) 1–5. 16) J. Koike, K. Miki, K. Maruyama and H. Oikawa: Philos. Mag. A. 78 (1998) 599–614. 17) M. Mabuchi, H. Iwasaki, H.-G. Jeong, K. Hiraga and K. Higashi: J. Mater. Res. 12 (1997) 2332–2336. 18) G. M. Pharr and M. F. Ashby: Acta Metall. 31 (1983) 129–136. 19) B. Baudelet, M. C. Dang and F. Bordeaux: Scr. Metall. Mater. 26 (1992) 573–578..
(9)
Figure
+4

Related documents
