INTRODUCTION
The main objective of the production of slaughter pigs is undoubtedly profit which is a function of the whole complex of characters, i.e. qualities characteriz-ing reproduction and production traits. As production traits of farm animals are the resultant of an additive effect of the genes, it is the quantitative qualities the manifestation and scope of which is influenced by the
genotype and environment. As a result, production traits may be improved both by genetic and non-ge-netic measures. As concerns the genon-ge-netic measures, we are able, thanks to new scientific disciplines such as genomics, biometrics, biotechnology etc., to con-centrate desirable genes in DNA and subsequently by dissection, if need be, to determine the loci con-taining the genes participating in the management and scope of production traits. This is the way how
Genotype impact on the economy of production
performance in pigs
Vliv genotypu na ekonomiku výkrmu prasat
M. ŠPRYSL, R. STUPKA, J. ČÍTEK
Czech University of Agriculture Prague, Czech Republic
Abstract: The test focussed on the evaluation of production traits, i.e. fattening performance and quantitative aspect of the carcass value in 4 genotypes of pigs by means of station tests. The tests included 288 hybrid pigs of the VEPIG and (LWd ×L) genotypes mated by hybrid-boars of (PN×D), (PN×H), (LWs×BL). The outcomes have proved the existence of marked genotype differences in the production traits and, consequently, also in the economics which means for the pig bre-eders in the current period a significant measure conducing to the improvement of the economics of pig breeding. As the best, there has been proved the VEPIG genotype of pigs, which has shown the best results in all qualities of the fattening performance and carcass value. This genotype has also reflected best its highest growth intensity in the formation of meat which has been manifested positively in the classification of slaughter pigs, i.e. the profit per a slaughter pig in the amount of 625 CZK. In contrast, the other combinations have shown a loss which in the (LWd×L) × (LWs×BL) genotypes amounted to 324.50 CZK, in (LWd×L) × (PN×D) 228 CZK and in (LWd×L) × (PN×H) 279 CZK. Therefore it has to be stated that a deliberate selection of a suitable genotype is of a vital importance in order to be able to face the current considerably unfa-vourable situation in pig breeding.
Key words: pig, genotype, production performance, testation, economy, profit formula
Abstrakt: Účelem pokusu bylo zhodnocení produkční užitkovosti, tedy výkrmnosti a kvantitativní stránky jatečné hodnoty 4 genotypů prasat pomocí staničních testů. Testy se uskutečnily u 288 ks hybridních prasat genotypů VEPIG a (LW×L) zapuštěných kanci plemen (PN×D), (PN×H), (BO×BL). Dosažené výsledky prokázaly existenci výrazných genotypových diferencí v produkční užitkovosti a tedy i v ekonomice, což pro chovatele v současném období znamená významné opatření vedoucí ke zlepšení ekonomiky chovů prasat. Prokázalo se, že se jako nejlepší jeví genotyp prasat VEPIG, který ve všech vlastnostech výkrmnosti a jatečné hodnotě prokázal nejlepší výsledky. Tento genotyp svou nejvyšší růstovou intenzitu rovněž nejlépe promítl do tvorby masa, což se pozitivně projevilo v zatřídění jatečných prasat, resp. v zisku na jatečné prase ve výši 625 Kč. Ostatní kombinace naopak vykázaly ztrátu. Ta u genotypů (LW×L) × (BO×BL) činila 324,50 Kč, (LW×L) × (PN×D) 228 Kč a (LW×L) × (PN×H) 279 Kč. Je tedy nutné konstatovat, že uváženým výběrem vhodného genotypu lze s úspěchem čelit současné značně nepříznivé situaci v chovu prasat.
Klíčová slova: prase, genotyp, produkční užitkovost, testace, ekonomika, zisková funkce
to purposefully immigrate valuable genes from one population into another and thus directly influence the gene manifestation. However, these measures cannot be successfully implemented without the use of the current methods evaluating production traits indirectly on the basis of biometric evaluation where information about the effects of genotypes is acquired from their average effects in populations and produc-tion traits are defined by them.
Both domestic and foreign hybridization programs offer a number of genotypes the production traits of which are associated with non-genetic factors. It depends on breeders and their knowledge what genotype they will choose in the given breeding, in order to achieve the required profitability. Guidance in their choice is provided by the tests of populations that are necessary both for the sphere of breeding and commercial rearing.
REVIEW OF LITERATURE
The choice of a suitable genotype for the particu-lar conditions of commercial breeding is a decisive step for pig breeders. Performance and suitability of various genotypes are verified by tests of popula-tions (Jakubec 1990), the aim of which is according to Moskal (1984,1986), Rao, Mc Cracken (1990, 1992) the acquisition of the biggest possible volume of ob-jective information about the tested populations of pigs on the basis of
– comparison of the chosen combination of breeds/ hybrids with other combinations of breeds/hybrids in all relevant indicators of production traits, – verification of the relative efficiency of individual
hybridization programs, thus initiating competition among pig breeders in terms of maximization of the breeding progress while observing the principle of mutual comparability of production traits which may be ensured by the application of definable conditions together with the choice of suitable biometric methods (Jakubec 1990).
The above given tests also provide pig breeders with the information about the influence of the selected line (Stupka, Šprysl 2003), sex (Stupka et al. 2004) and technique of feeding (Šprysl, Stupka 2003).
With regard to the fact that station tests of pig populations providing the breeding and scientific sphere with the findings for selection programs and hybridization are currently being cancelled, breeders may at present test their genotypes only in the standard conditions of test centres of the Czech University of Agriculture and the Central Control and Test Institute of Agriculture. With minimization of environmental
effects, they allow to determine the order of benefits of individual genotypes as well as maximum of pro-duction traits of the tested combinations of hybrids. This information is useful for breeders in the choice of the respective measures aimed at minimization of differences between the production traits of the given breeding and the production traits manifested by the selected genotype in the station test (Mc Phee et al. 1991; Cameron 1991). With regard to economics, it is the case of the determination of the scope of the genotype x environment interaction that is well known in pig breeding (Merks 1989; De Hear 1990; De Hear, De Vries 1993; Šprysl, Stupka 1990, 1991, 1992).
In order to ensure mutual comparability of internal factors influencing production traits, it is necessary to eliminate different environmental factors (Jakubec 1988; Cameron 1991; Mc Phee et al. 1991).
METHODS
Comparison of the production performance, i.e. fattening capacity and carcass value on the pig prof-itability with respect to the used genotype was the objective of the carried out test.
In the trial, the genotype VEPIG was tested (Danish service program based on LWd, L and D breeding and its´crossing) with recomended final hybrid pigs realized in the Czech Republic according to the Association of Pig Breeders in the Czech Republic
– (LWd×L) × (PN×D) – (LWd×L) × (PN×H) – (LWd×L) × (BO×BL)
All pigs were penned in pairs (barrow/gilt) accord-ing to the testaccord-ing-methodology of pure and hybrid-bred pigs.
The feeding was carried out ad-libitum according the Šimeček et al (2000) norm by the help of Duräumat self-feeders in three smooth-conversion phases where the feeding-mixtures (CFM) were fattened according to the followed receptures and figures (Table 1).
288 hybrid pigs were brought in the test-station at the average age of 83 ± 3 days (since their birth) and the average live weight 29.9 kg. The tested animals were sorted out into the following 4 groups (mother-father):
Group 1: 72 barrows and gilts of (LWd×L) × (PN×D) genotype at the average live weight 31.1 kg. Group 2: 72 barrows and gilts of VEPIG genotype at
the average live weight 25.1 kg.
Group 3: 72 barrows and gilts of (LWd×L) × (PN×H) genotype at the average live weight 30.0 kg. Group 4: 72 barrows and gilts of (LWd×L) × (LWs×BL)
For evaluation of fattening and growing performance, all pigs were weighted regularly weekly where the fol- lowing traits were monitored:
– average live weight (ALW) in kg – feeding conversion ratio (FCR) in kg – daily feed intake (DFI) in kg
– average daily weight gain (ADG) in g
When achieving the average live weight of ap-proximately 106 kg, pigs were slaughtered and real-ized within the SEUROP system by the ZP method (Vrchlabský, Palásek 1992; Pulkrábek 2001, etc.).
For carcass value determination, the following traits were monitored in each animal
– live weight (kg) – carcass weight (kg)
– lean meat share according ZP method (%) All obtained data were processed by common math-ematical and statistic methods and expressed in tables and figures. By the conclusion, the profitability of the test was evaluated with respect to group by the help of profit-formula (Poděbradský 1980; Župka 1992)
Zc = {c1y1 – [n1 x1 + n2 x2 + (n3 : x3) + A]} x r
while
r = 365 : (x2 + k) Zc = Z × r
where:
Zc = annual profit per capacity unit Z = profit per head
r = annual speed of turnover
c1 = average sales price per unit of production n1 = unit cost of compound feed
n2 = fixed costs per feeding day (in growing and fin ishing phase)
n3 = costs per sow and litter
A = costs of piglet treatment and feeding y1 = carcass weight
= live weight of slaughter pig = initial live weight of fattened pig x1 = quantity of consumed compound feed x2 = duration of fattening
= ADG from live weight y0 to live weight y1 of the slaughter pig
x3 = number of reared piglets per sow and litter k = number of days between two rounds of fattening.
Legend: LWd = Large White dam-breed (LW), L = Lan-drace breed, LWs Large White sire-breed (BO), BL = Bel-gian Landrace breed, D = Duroc breed, PN = Pietrain breed, H = Hampshire breed
RESULTS AND DISCUSSION
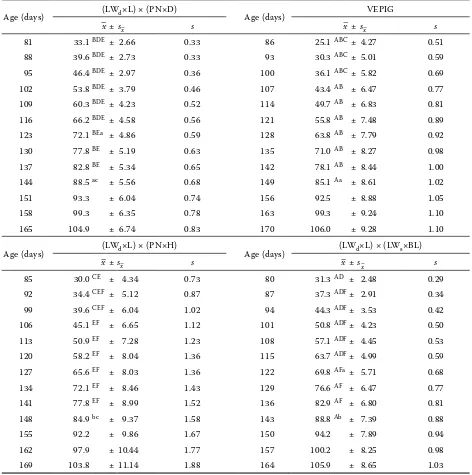
The analysis of the fattening performance charac-ters with regard to the genotype on the basis of the actually achieved values within the tests is presented in Table 2a–d and Figures 1a–d including the initial and/or final weight and age of pigs.
They show evidently that the VEPIG and (LWd×L) × (PN×H) pigs did not reach at the beginning of the test the recommended growth level (Guyokrma 1994). This fact has proved that there exist problems and reserves in the field of the respective commercial breeding of hogs. Figure 1a and Table 2a document that during 3–4 week, the tested animals of these genotypes got over the recommended lower limit and their weight in relation to age was ranging within the recommended scope until the end of the test. Other genotypes thanks to their initial weight copied the [(LWd×L) × (PN×H)] or got over the upper recom-mended growth intensity of [(LWd×L) × (LWs×BL)]. As concerns the progress of live weight in the course of the test, it may be stated that although age differ-ences between combinations were minimal (7-day cycle), the tested genotypes manifested significant weight differences between each other, namely ap-proximately until the age of 144 days or the weight of approximately 80 kg.
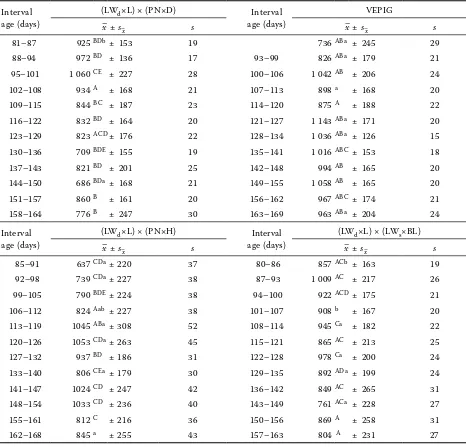
[image:3.595.65.287.83.377.2]If we evaluate the average daily weight gain (Table 2b and Figure 1b), the achieved values and the progress of weight gains show evidently that the growth intensity Table 1. Composition of feeding-mixtures (CFM)
Feeding period
less 35 kg 35–65 kg over 65kg Component (%)
Wheat 45.0 38.8 36.2
Barley 26.8 38.4 50.0
Soya meal 25.0 20.0 11.0
Premix 3.2 2.8 2.8
Total 100.0 100.0 100
Nutrient content
Crude protein (g/kg) 196.70 184.00 156.30
MEp (MJ/kg) 13.30 13.20 12.90
Fibre (g/kg) 39.84 38.76 40.75
LYZ (g/kg) 11.40 10.20 8.30
THRE (g/kg) 7.20 6.50 5.40
MET (g/kg) 3.20 2.90 2.40
Ca (g/kg) 7.20 6.80 6.10
P (g/kg) 5.50 5.40 4.60
2 0 1 2 (y y ):x
x � �� � �
1
y�
0 y�
Table 2a. Fattening capacity with respect to genotype ALW (kg)
Age (days) (LWd×L) × (PN×D) Age (days) VEPIG
x– ± sx– s x– ± sx– s
81 33.1BDE ± 2.66 0.33 86 25.1ABC ± 4.27 0.51
88 39.6BDE ± 2.73 0.33 93 30.3ABC ± 5.01 0.59
95 46.4BDE ± 2.97 0.36 100 36.1ABC ± 5.82 0.69
102 53.8BDE ± 3.79 0.46 107 43.4AB ± 6.47 0.77
109 60.3BDE ± 4.23 0.52 114 49.7AB ± 6.83 0.81
116 66.2BDE ± 4.58 0.56 121 55.8AB ± 7.48 0.89
123 72.1BEa ± 4.86 0.59 128 63.8AB ± 7.79 0.92
130 77.8BE ± 5.19 0.63 135 71.0AB ± 8.27 0.98
137 82.8BE ± 5.34 0.65 142 78.1AB ± 8.44 1.00
144 88.5ac ± 5.56 0.68 149 85.1Aa ± 8.61 1.02
151 93.3 ± 6.04 0.74 156 92.5 ± 8.88 1.05
158 99.3 ± 6.35 0.78 163 99.3 ± 9.24 1.10
165 104.9 ± 6.74 0.83 170 106.0 ± 9.28 1.10
Age (days) (LWd×L) × (PN×H) Age (days) (LWd×L) × (LWs×BL)
x– ± sx– s x– ± sx– s
85 30.0CE ± 4.34 0.73 80 31.3AD ± 2.48 0.29
92 34.4CEF ± 5.12 0.87 87 37.3ADF± 2.91 0.34
99 39.6CEF ± 6.04 1.02 94 44.3ADF± 3.53 0.42
106 45.1EF ± 6.65 1.12 101 50.8ADF± 4.23 0.50
113 50.9EF ± 7.28 1.23 108 57.1ADF± 4.45 0.53
120 58.2EF ± 8.04 1.36 115 63.7ADF± 4.99 0.59
127 65.6EF ± 8.03 1.36 122 69.8AFa ± 5.71 0.68
134 72.1EF ± 8.46 1.43 129 76.6AF ± 6.47 0.77
141 77.8EF ± 8.99 1.52 136 82.9AF ± 6.80 0.81
148 84.9bc ± 9.37 1.58 143 88.8Ab ± 7.39 0.88
155 92.2 ± 9.86 1.67 150 94.2 ± 7.89 0.94
162 97.9 ± 10.44 1.77 157 100.2 ± 8.25 0.98
169 103.8 ± 11.14 1.88 164 105.9 ± 8.65 1.03
Differences indicate by same type are statistically significant For P < 0.01 are used A, B, C, D, E , for P < 0.05 then a, b, c
Figure 1a. Average live weight (LW×L) × (PN×D)
VEPIG
(LW×L) × (PN×H) (LW×L) × (BO×BL)
Age (days)
0.0 2 0 .0 4 0 .0 6 0 .0 8 0 .0 10 0.0 12 0.0
7 5 95 11 5 1 35 1 5 5 1 7 5
A ge (d ays)
ALW
(kg)
(L W xL )x(P N xD ) V E P IG
[image:4.595.67.458.613.766.2]Table 2b. Fattening capacity with respect to genotype ADG (g) Interval
age (days)
(LWd×L) × (PN×D) Interval age (days)
VEPIG
x– ± sx– s x– ± sx– s
81–87 925BDb± 153 19 736ABa ± 245 29
88–94 972BD ± 136 17 93–99 826ABa ± 179 21
95–101 1 060CE ± 227 28 100–106 1 042AB ± 206 24
102–108 934A ± 168 21 107–113 898a ± 168 20
109–115 844BC ± 187 23 114–120 875A ± 188 22
116–122 832BD ± 164 20 121–127 1 143ABa ± 171 20
123–129 823ACD± 176 22 128–134 1 036ABa ± 126 15
130–136 709BDE± 155 19 135–141 1 016ABC ± 153 18
137–143 821BD ± 201 25 142–148 994AB ± 165 20
144–150 686BDa ± 168 21 149–155 1 058AB ± 165 20
151–157 860B ± 161 20 156–162 967ABC ± 174 21
158–164 776B ± 247 30 163–169 963ABa ± 204 24
Interval age (days)
(LWd×L) × (PN×H) Interval age (days)
(LWd×L) × (LWs×BL)
x– ± sx– s x– ± sx– s
85–91 637CDa± 220 37 80–86 857ACb ± 163 19
92–98 739CDa± 227 38 87–93 1 009AC ± 217 26
99–105 790BDE± 224 38 94–100 922ACD± 175 21
106–112 824Aab ± 227 38 101–107 908b ± 167 20
113–119 1045ABa ± 308 52 108–114 945Ca ± 182 22
120–126 1053CDa± 263 45 115–121 865AC ± 213 25
127–132 937BD ± 186 31 122–128 978Ca ± 200 24
133–140 806CEa ± 179 30 129–135 892ADa ± 199 24
141–147 1024CD ± 247 42 136–142 849AC ± 265 31
148–154 1033CD ± 236 40 143–149 761ACa ± 228 27
155–161 812C ± 216 36 150–156 869A ± 258 31
162–168 845a ± 255 43 157–163 804 A ± 231 27
Differences indicate by same type are statistically significant For P ≤ 0.01 are used A, B, C, D, for P ≤ 0.05 then a, b
Figure 1b. Average daily gain 500
600 700 800 900 1000 1100 1200
75 95 115 135 155 175
Age (days)
A
D
G
(g
) (LWxL)x(PNxD)
VEPIG
(LWxL)x(PNxH) (LWxL)x(BOxBL)
(LW×L) × (PN×D) VEPIG
[image:5.595.65.432.612.766.2]differs in the examined genotypes which is proved by the presented highly conclusive differences. It may be stated that the (LWd×L) × (PN×D) or (LWd×L) × (LWs×BL) genotype reaches its maximum at the begin-ning of the fattebegin-ning period approximately until the age of 100 or 130 days and subsequently the growth intensity decreases. On the other hand, the (LWd×L) × (PN×H) genotype shows until the age of 110 days the lowest growth intensity. Subsequently until the age of 155 days, it ranges between the standardized values for the meaty/super-meaty type (Šimeček et al. 2000) and then sharply falls. The genotype with the most intensive growth seems to be the commercial VEPIG product which despite its lowest initial weight exceeds by its growth intensity approximately from the age of 100 days the upper limit of the recommended norm. The achieved results prove the fact that most current hybrid combinations of pigs realized in the production sphere manifest their growth potential differently. This fact proves the necessity of regular tests of populations in the field of pig breeding (Moskal 1986, Hovorka 1989).
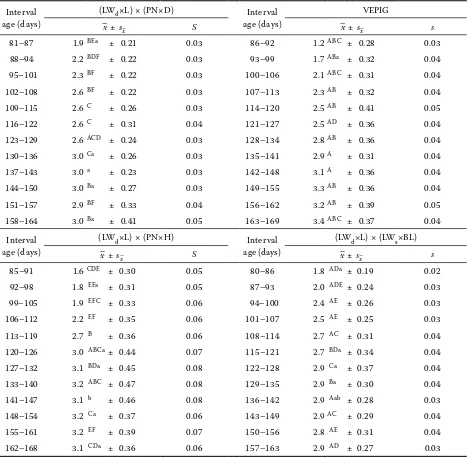
As concerns the intake ability of the animals, i.e. the average daily feed consumption, the Table and Graph 1c document that it ranges above the upper recommended limit which documents that the exam-ined genotypes do not show a lower intake ability as is currently presented (Dalby 1998). With regard to individual genotypes, it may be also stated that in the system of ad-libitum feeding the (LWd×L) × (LWs×BL) and (LWd×L) × (PN×D) genotypes record until the age of approximately 115 days the highest feed intake which is later surpassed by the (LWd×L) × (PN×H) pigs. The lowest intake ability in the monitored system of feed-ing is manifested by the VEPIG pigs whose feed intake ranges slightly above the upper recommended limit for the super-meaty type (Šimeček et al. 2000).
The evaluation in Table 2d and Figure 1d of feed conversion ratio in terms of the economics of fatten-ing constitutfatten-ing a significant cost item shows that in the course of the growth, significant differences were manifested in the monitored character in the tested genotypes. It is evident that with the excep-tion of the commercial VEPIG genotype, the feed conversion ratio ranges markedly above the limit recommended by the norm (Šimeček et al. 2000). The given graph further shows that the highest conver-sion in this respect was achieved by the (LWd×L) × (PN×D) genotype. The remaining genotypes range by their feed conversion ratio between the above given genotypes.
The total evaluation of the fattening performance characters of individual genotypes during the test is included in the following Table 3.
The evaluation of the examined combinations throughout the whole period of testing (Table 3) has proved within individual characters of the fattening performance statistically highly significant differences (P ≤ 0.001 or P ≤ 0.05), practically in all genotypes, with the exception of the daily feed consumption. It is evident that as concerns the order of advantageous-ness, the best in terms of the achieved daily weight gain (984 g) and feed conversion ratio (2.7 kg) is the commercial VEPIG product. The worst values were recorded in the (LWd×L) × (PN×D) genotype (3.20 kg, 850 g).
Table 4 evaluates the achieved standard of the quali-ties of the carcass value.
Table 4 shows that the highest meat share (57.05%) with the highest slaughter weight (106.2 kg) was achieved by the pigs of the VEPIG genotype. It is therefore obvious that as compared to other geno-types, this genotype manifested together with high growth intensity also an excellent formation of meat in the carcass. As concerns other genotypes (LWd×L) × (PN×D) and (LWd×L) × (PN×H), they achieve with a lower slaughter weight the meat share the average lower by 2%. Therefore it may be stated that they reflect their growth intensity to a lesser extent in the meat formation. The lowest values were recorded in the (LW×L) × (BO×BL) genotype which with an ap-proximately same final weight of 106 kg (as VEPIG) had the meat share in the amount of 55.21%.
Table 5 documents classification of pigs of the ex-amined genotypes into the quality grades.
The above mentioned table shows that the highest realization in the S quality grades was achieved by the VEPIG pigs (26.8%), even with a markedly higher slaughter weight in this category. The second highest realization (23.6%) in the given S grade was reached by the (LWd×L) × (LWs×BL) genotype, however, with an average carcass weight lower by 6.5 kg. This fact was proved similarly in E class in which the mentioned combinations again rank the highest. The evaluation of the frequency of the representation of slaughter pigs in U, R classes with regard to the genotype shows that the highest representation was achieved in these classes by the (LWd×L) × (PN×D) and (LWd×L) × (PN×H) genotypes. This fact has significantly in-fluenced the market prices per 1 kg of meat in the individual tested genotypes.
Table2c. Fattening capacity with respect to genotype DFI (kg) Interval
age (days)
(LWd×L) × (PN×D) Interval age (days)
VEPIG
x– ± sx– S x– ± sx– s
81–87 1.9BEa ± 0.21 0.03 86–92 1.2ABC ± 0.28 0.03
88–94 2.2BDF ± 0.22 0.03 93–99 1.7ABa ± 0.32 0.04
95–101 2.3BF ± 0.22 0.03 100–106 2.1ABC ± 0.31 0.04
102–108 2.6BF ± 0.22 0.03 107–113 2.3AB ± 0.32 0.04
109–115 2.6C ± 0.26 0.03 114–120 2.5AB ± 0.41 0.05
116–122 2.6C ± 0.31 0.04 121–127 2.5AD ± 0.36 0.04
123–129 2.6ACD ± 0.24 0.03 128–134 2.8AB ± 0.36 0.04
130–136 3.0Ca ± 0.26 0.03 135–141 2.9A ± 0.31 0.04
137–143 3.0a ± 0.23 0.03 142–148 3.1A ± 0.36 0.04
144–150 3.0Ba ± 0.27 0.03 149–155 3.3AB ± 0.36 0.04
151–157 2.9BF ± 0.33 0.04 156–162 3.2AB ± 0.39 0.05
158–164 3.0Ba ± 0.41 0.05 163–169 3.4ABC ± 0.37 0.04
Interval age (days)
(LWd×L) × (PN×H) Interval age (days)
(LWd×L) × (LWs×BL)
x– ± sx– S x– ± sx– s
85–91 1.6CDE ± 0.30 0.05 80–86 1.8 ADa ± 0.19 0.02
92–98 1.8 EFa ± 0.31 0.05 87–93 2.0 ADE ± 0.24 0.03
99–105 1.9 EFC ± 0.33 0.06 94–100 2.4 AE ± 0.26 0.03
106–112 2.2 EF ± 0.35 0.06 101–107 2.5 AE ± 0.25 0.03
113–119 2.7 B ± 0.36 0.06 108–114 2.7 AC ± 0.31 0.04
120–126 3.0 ABCa± 0.44 0.07 115–121 2.7 BDa ± 0.34 0.04
127–132 3.1 BDa ± 0.45 0.08 122–128 2.9 Ca ± 0.37 0.04
133–140 3.2 ABC ± 0.47 0.08 129–135 2.9 Ba ± 0.30 0.04
141–147 3.1 b ± 0.46 0.08 136–142 2.9 Aab ± 0.28 0.03
148–154 3.2 Ca ± 0.37 0.06 143–149 2.9AC ± 0.29 0.04
155–161 3.2 EF ± 0.39 0.07 150–156 2.8 AE ± 0.31 0.04
162–168 3.1 CDa ± 0.36 0.06 157–163 2.9 AD ± 0.27 0.03
[image:7.595.65.533.84.542.2]Differences indicated by same type are statistically significant For P < 0.01 are used A, B, C, D, E, F, for P < 0.05 then a, b
Figure 1c. Daily feed intake 1.0
1.5 2.0 2.5 3.0 3.5 4.0
75 95 115 135 155 175
Age (days)
D
FI
(k
g)
(LWxL)x(PNxD) VEPIG
(LWxL)x(PNxH) (LWxL)x(BOxBL) (LW×L) × (PN×D) VEPIG
Table 2d. Fattening capacity with respect to genotype FCR (kg) Interval
age (days)
(LWd×L) × (PN×D) Interval age (days)
VEPIG
x– ± sx– S x– ± sx– s
81–87 2.1Ca ± 0.44 0.05 86–92 1.9ADa ± 0.83 0.10
88–94 2.3Ca ± 0.35 0.04 93–99 2.0Aa ± 0.37 0.04
95–101 2.3CDa ± 0.49 0.06 100–106 2.1ABa ± 0.44 0.05
102–108 2.9A ± 0.58 0.07 107–113 2.6abA ± 0.50 0.06
109–115 3.3ab ± 1.21 0.15 114–120 2.9a ± 0.52 0.06
116–122 3.2Bb ± 0.63 0.08 121–127 2.2ABC ± 0.35 0.04
123–129 3.3B ± 0.77 0.09 128–134 2.7ABC ± 0.33 0.04
130–136 4.5BD ± 1.18 0.14 135–141 2.9ABC ± 0.47 0.06
137–143 4.4b ± 4.46 0.55 142–148 3.2ab ± 0.55 0.06
144–150 4.8BDa ± 2.22 0.27 149–155 3.1AB ± 0.45 0.05
151–157 3.5B ± 0.81 0.10 156–162 3.4A ± 0.56 0.07
158–164 4.1 ± 1.13 0.14 163–169 3.7 ± 0.86 0.10
Interval age (days)
(LWd×L) × (PN×H) Interval age (days)
(LWd×L) × (LWs×BL)
x– ± sx– S x– ± sx– s
85–91 2.8ABC ± 1.11 0.19 80–86 2.2BD ± 0.38 0.05
92–98 2.7ABC ± 1.12 0.19 87–93 2.1B ± 0.44 0.05
99–105 2.6BD ± 0.65 0.11 94–100 2.6AC ± 0.50 0.06
106–112 2.9b ± 0.81 0.14 101–107 2.8a ± 0.55 0.07
113–119 2.8b ± 0.76 0.13 108–114 3.0 ± 0.69 0.08
120–126 3.0Cab ± 0.71 0.12 115–121 3.3Aa ± 0.81 0.10
127–132 3.4Ca ± 0.77 0.13 122–128 3.1Aa ± 0.72 0.09
133–140 4.2CE ± 0.89 0.15 129–135 3.4ADE ± 0.77 0.09
141–147 3.2 ± 0.88 0.15 136–142 3.9a ± 1.68 0.20
148–154 3.2CD ± 0.70 0.12 143–149 4.2ACa ± 1.73 0.21
155–161 4.2AB ± 0.92 0.16 150–156 3.7 ± 2.08 0.25
162–168 4.1 ± 1.35 0.23 157–163 3.9 ± 1.70 0.20
Differences indicated by same type are statistically significant For P < 0.01 are used A, B, C, D, for P < 0.05 then a, b
1.0 1.5 2.0 2.5 3.0 3.5 4.0 4.5 5.0
75 95 115 135 155 175
Age (days)
FC
R
(k
g)
(LWxL)x(PNxD) VEPIG
(LWxL)x(PNxH) (LWxL)x(BOxBL)
Figure 1d. Feed conversion ratio (LW×L) × (PN×D)
VEPIG
[image:8.595.66.431.607.763.2]The economic indicators included in Table 6 doc-ument a significant difference between the tested genotypes. The best in terms of the amount of profit per 1 pig was the genotype of the VEPIG pigs. This genotype also manifested best its growth intensity with the lowest feed conversion into meat formation, which had a positive influence on the classification of the pigs into S, E classes. Other combinations showed loss in terms of profit per one pig which amounted in the (LWd×L) × (LWs×BL) genotypes to 324.50 CZK, in (LWd×L) × (PN×D) to 228 CZK and in (LWd×L) × (PN×H) to 279 CZK. With regard to the proved
[image:9.595.66.533.286.388.2]standard of the fattening performance characters and the carcass value, it is evident that the OL-38 (PN×D) a 68 (PN×H) hybrid combinations with hogs record a lower growth intensity with a high feed intake and feed conversion ratio. At the same time, they achieve a lower carcass lean meat share, which had a negative impact on both the classification and the profit gener-ated per 1 pig. As concerns the (LWd×L) × (LWs×BL) genotype, not even a relatively better classification of pigs into S, E classes had a positive effect and due to a lower average weight of the carcass it recorded the highest loss.
Table 3. Evaluation of the average values of the qualities of the fattening performance with regard to the test length (13 weeks)
Genotype FCR (kg) DFI (kg) ADG (g)
x– ± sx– s x– ± sx– s x– ± sx– s
(LWd×L) × (PN×D) 3.20BD ± 0.30 0.04 2.7 ± 0.18 0.02 850AD ± 73.49 9.05
VEPIG 2.75ABC ± 0.21 0.02 2.7 ± 0.29 0.03 984ABC ± 88.40 10.49
(LWd×L) × (PN×H) 3.10C ± 0.35 0.06 2.8 ± 0.29 0.05 901CD ± 107.02 18.09
(LWd×L) × (LWs×BL) 3.04AD ± 0.26 0.03 2.7 ± 0.23 0.03 890B ± 97.04 11.52
[image:9.595.63.537.456.560.2]Differences indicated by same type are statistically significant; for P < 0.01 are used A, B, C
Table 4. Overview of the qualities of the carcass value with regard to genotype
Genotype ALW (kg) Carcass weight (kg) Lean meat share (%)
x– ± sx– s x– ± sx– s x– ± sx– s
(LWd×L) × (PN×D) 104.9 ± 6.74 0.83 88.9 ± 6.92 0.85 55.16A ± 3.76 0.46
VEPIG 106.0A ± 9.28 1.10 89.1A ± 8.39 1.00 57.05A ± 3.17 0.38
(LWd×L) × (PN×H) 103.9AB± 11.14 1.88 85.8B ± 8.87 1.50 55.48 ± 4.84 0.82
(LWd×L) × (LWs×BL) 106.0B ± 9.47 1.12 84.1AB± 7.97 0.95 55.21 ± 4.39 0.52
Differences indicated by same type are statistically significant; for P < 0.01 are used A, B
Table 5. SEUROP (ZP) realization with resprect to genotype in tested pigs
Třída
(LWd×L) × (PN×D) VEPIG (LWd×L) × (PN×H) (LWd×L) × (LWs×BL)
n JUT (kg) % n JUT (kg) % n JUT (kg) % nN JUT (kg) %
x– x– x– x–
S 9 85.5 12.7 19 84.6 26.8 12 80.3 17.1 17 80.3 23.6
E 19 89.2 26.7 30 89.2 42.3 25 83.8 35.7 36 85.0 50.0
U 39 89.1 54.9 21 92.3 29.6 28 87.9 40.0 15 84.4 20.8
R 4 92.8 5.7 1 101.8 1.3 5 96.4 7.2 4 90.1 5.6
[image:9.595.64.533.631.770.2]It may be summarized that by a deliberate selection of a suitable genotype on the basis of tests of popula-tions, it is possible to influence considerably the results achieved within production breeding. Using suitable genotypes will represent for breeders at present but also in the future a significant tool conducing to the improvement of the economy of breeding.
CONCLUSION
The tests were performed in the Test and Experi-mental Centre of the Czech University of Agriculture in Prague. They focussed on the impact of the geno-type in 288 hybrid pigs of the (LWd×L) × (PN×D), (LWd×L) × (PN×H), (LWd×L) × (LWs×BL) and VEPIG genotypes. A uniform methodology was used in test-ing these pigs in order to determine the production traits, i.e. the qualities of the fattening performance and carcass value. In the conclusion, the results were evaluated by means of the profit function. The results show clearly that the proper selection of the genotype in the production of final pig hybrids for fattening is essential for the economics of pig fattening.
REFERENCES
Cameron N.D. (1991): Meat focus. Proceeding of 42. EAAP, Berlin, 9–2. 9., 6 p.
[image:10.595.67.532.84.273.2]Dalby J.A. (1989): Behaviour and choice feeding. Po-gress in Pig Science, Nottingham University Press: 183–207.
Table 6. Economic evaluation of the examined groups of pigs with regard to the genotype
Indicator/Genotype (LWd×L) × (PN×D) VEPIG (LWd×L) × (PN×H) (LWd×L) × (LWs×BL)
Number of pigs/group 71 71 70 72
Costs in CZK
– per 1 weaner 2 052.20 1 556.20 1 860.00 1 940.60
– for feed/1 pig in test 1 684.70 1 354.76 1 745.07 1 716.28
– overall costs/1pig 3 736.90 2 910.96 3 605.07 3 656.88
– 1 feeding day 41.06 31.99 39.61 40.18
– 1 kg of weight gain in test 52.04 35.98 48.85 49.02
Sales in CZK per 1 pig 3 508.70 3 536.51 3 326.07 3 332.38
Realized carcass-price 38.39 39.69 40.60 39.64
Profit/lost per 1 pig –228.20 625.55 –279.00 –324.50
The economy of the tested groups of pigs is based only on the price of a hog (62 CZK/1kg) and the inputs prices of CFM components set in advance (wheat 4.50 CZK, barley 4.20 CZK, soyameal 10.50 CZK, premix 27.00 CZK) and the market price of slaughter pigs (S – 42.86 CZK, E – 39.87 CZK, U – 37.09 CZK, R – 34.50 CZK).
De Hear L.C.M. (1990): Sire % protein x testing re-gime interactions in growing pigs. Animal Produc-tion, 51: 357–364.
De Hear L.C.M., De Vries A.G. (1993): Effect of geno-type and sex on the feed intake pattern of group housed growing pigs. Livestock Production Sci-ence, 36: 223–232.
Merks J.W.M. (1989): Genotype x environmental interactions in pig breeding programmes. IV. Ge-netic relations between performance in central test, on farm test and commercial fattening. Livestock Production Science, 22: 325–339.
Hovorka F. (1989): Faktory ovlivňující výkrmnost, jatečnou hodnotu a kvalitu masa u prasat. VŠZ Praha, AF, KCHPD, 150 p.
Jakubec V. (1990): Uplatnění biometrické genetiky ve šlechtění hospodářských zvířat. ČSAZ, Sborník ČSAZ, 133.
Jakubec V. (1988): Analýza metod testace populací se zřetelem na genetické efekty. Živočišná výroba, 34: 475–480.
Mc Phee C.P., Williams K.C., Daniels L.J. (1991): The effect of selection for rapid lean growth on the dietary lyzine and energy requirements of pigs fed to scale. Livestock Production Science, 27: 185–198.
Moskal V. (1984): Metodika testace prasat při hy-bridizaci v provozních podmínkách. VÚŽV, Praha-Uhříněves, 5 p.
Pavlů M., Vondráček E. (2003): Vepřové maso. Situ-ační a výhledová zpráva, MZe ČR, listopad, 57 p. Poděbradský Z. (1980): Ekonomické aspekty racionál-ních opatření v chovu prasat. Studijní Informace, Zemědělská Ekonomika, 1. ÚVTIZ, Praha. Pulkrábek J. (2001): Zajištění objektivního
zpeně-žování prasat systémem SEUROP – kontrolní me-chanismy. Proceedings Aktuální problémy chovu prasat, ČZU Praha: 14–20.
Rao D.S., McCracken K.J. (1990): Protein requirement of boars of high genetic potencial for lean growth. Animal Production, 51: 179–187.
Rao D.S., McCracken K.J. (1992): Energy x protein interaction in growing boars of high potential for lean growth. 2. Effect of chemical composition of gain and whole-body protein turn-over. Animal Production, 53: 83–93.
Sellier, P. (1976): The basis of crossbreeding in pigs. Livestock Production Science, 3: 203–226. Stupka R., Šprysl M. (2003): The effect of sire-C
po-sition on fattening economy in pigs. Agricultural Economics – Czech, 49 (4): 195–200.
Stupka R., Šprysl M.,Pour M. (2004): The impact of sex on the economics of pig fattening. Agricultural Economics – Czech, 50 (5): 217–222.
Šimeček K., Zeman L., Heger J. (2000): Potřeba živin a tabulky výživné hodnoty krmiv pro prasata. ČAZV, Pohořelice, 78 p.
Šprysl M., Stupka R. (1990): Provozní testace v užit-kovém chovu. DZZ, VŠZ Praha, AF.
Šprysl M., Stupka R. (1991): Polní testace – racio-na-lizační opatření v chovu prasat. Zemědělská ekonomika, 37 (7): 479–491.
Šprysl M., Stupka R. (1992): Provozní testace v užit-kovém chovu. Sborník ze semináře Chov pra-sat v podmínkách tržního hospodářství. Klatovy: 72–77.
Šprysl M., Stupka R.: The effect of feeding technolo-gies on economy of fattening pigs. Agricultural Economics – Czech, 49 (6): 17–22.
Vrchlabský J., Palásek J. (1992): Objektivizace třídění jatečných těl zvířat. ZZ, VÚVL Brno, 22.
Župka Z. (1992): Zisková funkce. Naučný slovník zemědělský. ZN Brázda, Praha: 387–388.
Arrived on 20th April 2004
Contact address:
Ing. Michal Šprysl, CSc., doc. Ing. Roman Stupka, CSc., Ing. Jaroslav Čítek, PhD., Česká zemědělská univerzita v Praze, Kamýcká 129, 165 21 Praha 6-Suchdol, Česká republika