It is to assume that the number of piglets produced in a herd per year is influenced by the structure of sow herd to a great extent. A higher percentage of sows at parities 3–5, i.e. at parities with the high-est number of piglets born, should lead to the total higher production of piglets compared to a herd with a higher culling rate and higher percentage of mated gilts and sows at parity 1 and 2.
According to the herd type 35–36% herd replace-ment is usually recommended. Higher replacereplace-ment is necessary in nucleus herds in order to achieve a faster transfer of genetic gain. On the contrary, the replacement of commercial herds should be lower so as the reproductive potential of sows would be
exploited as best as possible. High-producing sows should remain in the herd for a longer time. A great economic benefit from a longer use of sows in breed-ing was described by Pavlík and Kolář (1990).
A higher percentage of sows at higher parities, i.e. lower herd replacement, has a positive effect on herd management costs. Too high herd replace-ment requires much higher costs of gilt purchase. If the herd size is equal, i.e. if the number of sows is equal, the number of parities in a herd per year is given mainly by the herd turnover, i.e. by the percentage of gilts for herd replacement. The herd structure is determined by culling rates at the par-ticular parities.
Supported by the Ministry of Agriculture of the Czech Republic (Project No. MZE 002701404)
The relationship between culling rate, herd structure
and production efficiency in a pig nucleus herd
L. Houška
Institute of Animal Science, Prague-Uhříněves, Czech Republic
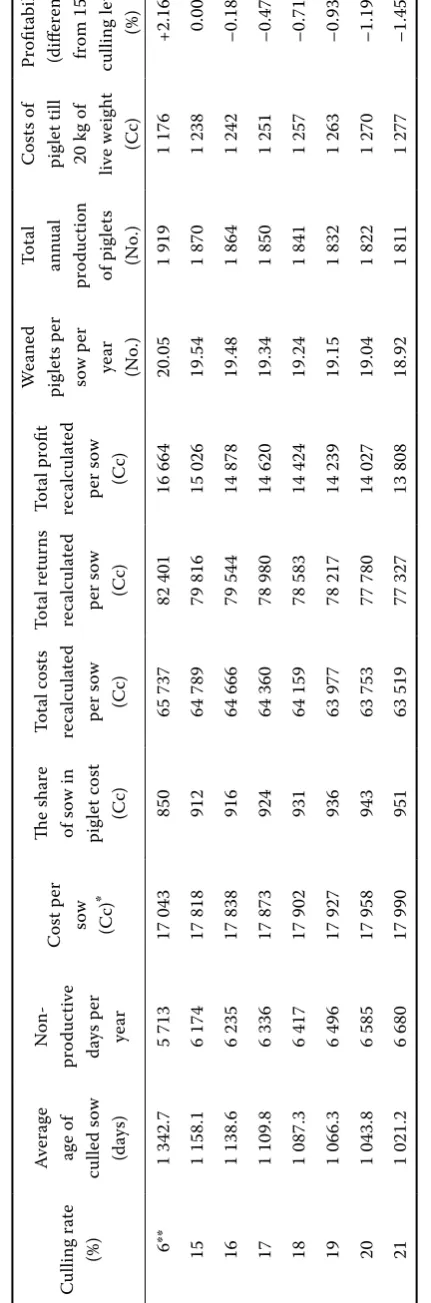
AbstrAct: Computer simulation of sow culling was run in a nucleus herd. The specified constant culling rate from 15 to 21% was simulated for all parities. The resultant different age structure of a herd was stud-ied from the aspect of piglet production and other production indicators. With increasing culling rate the percentage of mated gilts was increased in order to maintain the constant size of the sow herd. With 15% simulated culling, which required 17.09% of mated gilts, the percentage of sows at parity 1 and 2 and the percentage of sows at parities 3–5 were balanced (31.62% and 31.77%, respectively). Annual herd replacement was 37.62%. After five parities only a little more than a half (55.63%) of the total number of sows in the herd was removed. Similar results were obtained with 16% culling, which also made it possible to maintain the recommended herd structure. With higher culling rate parities 1 and 2 became dominant in the herd. With 21% culling and 19.84% of mated gilts the percentage of sows at parities 1 and 2 was 35.52% while it was only 29.90% at parities 3–5. Annual herd replacement amounted to 43.67%, and almost 70% of sows were removed after five parities in this case. With increasing culling rate the average age of sows removed from a herd decreased (1 158.1–1 021.2 days), the number of barren days in a herd per year increased (6 174–6 680 days) and the number of piglets weaned per sow per year decreased (19.54–18.92 piglets). At the same time, there was a decrease in total costs (64 789–63 519 Kč), returns (79 816–77 327 Kč) and profit (15 026–13 808 Kč) in the herd, as recalculated per sow per year, and profitability also decreased.
The ideal herd structure according to Carroll (1999) is as follows:
Sow parity 1 2 3 4 5 6 7 8
Sow percentage 17 16 15 14 13 11 10 < 4
In breeding practice in the Czech Republic the recommended herd structure according to Goliášová (2007) is as follows: 18–20% of mated gilts, the percentage of sows at parity 1 and 2 equals the number of sows at parities 3–5, amounting to 30–35%.
Morrow (1997) reported that after piglet wean-ing many producers usually culled 20–25% of sows for their low fertility and feet and legs disorders. This trend is maintained from parity 1 to parity 5. Following parity 5 a much higher percentage of sows is culled for their age and low performance, and this percentage increases to the highest parity, when all remaining sows are culled. Many produc-ers find it difficult to maintain the annual herd replacement in the recommended range of 35–36%. The author further indicates that, from the eco-nomic perspective, a sow should stay in the herd as long as the expected profit from its next litter is higher than the lifetime average of a replacement gilt. Most of the factors affecting culling rate are conscious decisions by management to change the parity profile of the herd.
It is also in agreement with conclusions of Ko-ketsu (2007), who stated that lower culling at lower parities led to higher longevity of sows. The author concluded at the same time that the longevity of sows did not contradict their high reproductive performance and both traits could be achieved simultaneously. With increasing parity of sow re-moval the number of produced piglets increases and the number of barren days decreases (Engblom et al., 2007).
Dijkhuizen et al. (1989) carried out an econom-ic evaluation of herds in Dutch conditions by the PorkCHOP programme. They reported a 50% an-nual culling rate of sows. The average productive lifespan of the sows is therefore about two years or four litters only. The programme helps producers to harmonise the actual need of sow culling and its economic impacts. The authors also confirmed the above-mentioned economic rule of sow culling: a sow of a particular age should be kept in the herd as long as its expected profit for the next parity (mar-ginal profit) is higher than the per parity lifetime average return from a replacement gilt (average
profit). The economic optimum lifespan is then the last parity with a positive difference between expected marginal profit of the present sow and average profit of the replacement gilt.
Čeřovský (2001) stated that the higher the culling rate and herd turnover, the higher the proportion of mated gilts. Higher culling, used mainly in pedigree herds, enables to achieve a faster transmission of genetic gain; on the other hand, the costs of gilt purchase for herd replacement increase and the production potential of sows cannot be exploited to a full extent. They are often culled before they reach the peak of fertility, i.e. the production of the largest litters at parities 3–5. The highest number of nursed piglets at parities 3–5 was also confirmed by Čechová and Tvrdoň (2002).
Dagorn and Aumaitre (1979) studied the reasons for sow culling. They reported that the system of sow culling had an influence on the length of far-rowing interval between parities, and subsequently on the average number of piglets weaned per pro-ductive sow per year that is the highest in sows removed at a high age. Other factors affecting sow reproduction were investigated by Bečková et al. (2005) and Humpolíček (2007). Li et al. (2008) dealt with some factors influencing total number of born piglets and number born alive. Lawlor and Lynch (2007) stated that the age structure of a herd was one of the factors influencing the litter size. Lucia et al. (2000) concluded that the relationship be-tween sow culling and reproductive performance of a herd had not been explained unambiguously until then. Appel et al. (1999) also studied culling strategy in great detail.
The objective of the present paper is to assess the influence of herd structure on the level of piglet production in a nucleus herd and to compare some production traits.
MAteriAl And Methods
the culling percentage the number of mated gilts was increased so that the total number of sows in a herd would remain the same, i.e. 100 sows. Total culling was considered in computations, without distinguishing unplanned culling (for reproduc-tion disorders, health reasons, etc.) and intenreproduc-tional culling (for production and breeding reasons). The constant culling rate from the first to the last parity is little probable in pig operations but it had to be used to maintain comparable conditions.
The EPOS programme (Houška et al., 2004; Houška, 2007) and/or its innovated version EPOS 8, v. 1.088, were used for the other computations. This programme was run to compare selected traits of a herd for different culling rates and for the respec-tive herd structures. Herd structures computed by the above-described method were used for com-putations.
The computation simulated the situation in a nu-cleus herd with the production of breeding gilts and young boars when the size of the basic herd is 100 sows and where gilts from own production are used for herd replacement and 100% insemination of sows and gilts is carried out. Litter sizes at pari-ties 2 to 8 were calculated by means of coefficients according to the first parity litter (Table 4). Zero culling is done in mated gilts that are a part of the stock herd. The proportion of unconceived gilts, re-moved without litter, is 4% and they are not included in the stock herd of sows but they are considered as a part of costs. Porkers not included in the rearing of breeding animals are fattened in the own facility.
In all compared variants all input parameters, ex-cept the compared selection intensity, were identi-cal. Table 4 shows the basic input characteristics of sow herd. As mentioned above, with each increase in the culling rate the percentage of mated gilts was increased to maintain the constant herd size. For comparison, besides the above-mentioned range of the studied culling rate (15–21%) the computation was done for the values of an optimum herd struc-ture (culling rate 6%) according to Carroll (1999). These equations were used in the programme to compute the costs of sows:
total costs for all sows’ lifetime NPPC1 (self-production of replacement gilts):
NPPC1 = VP0 × ((JDZ0 + JD0) × NDJP + 3 × NID × CID) +
AB i=2
+ VP(1) × (A0 + AI + ––––) +
∑
VP(i) × (A0 + i × (AI +2 MV+1
+ AB + AK) + (i – 1) × AJ + AV + 0.25 × AI)
(1st row … costs of gilts culled without conceiving,
2nd row… costs of culled mated gilts (conceived),
3rd row … costs of sows at ith parity, incl. AI costs
of 25% sows culled due to not conceiving) where:
VP0 = the number of gilts culled without conceiving VP(1) = culling percentage in mated gilts (conceived) VP(i) = number of sows culled after ith parturition
MV = parity at removal (maximal reached parity of the sow)
JDZ0 = days from purchase to 1st mating
JD0 = days from 1st mating to culling (in gilts culled
with-out conceiving)
NDJP = costs of barren gilt per day
NID = average number of AI doses/insemination CID = AI dose cost
A0 = costs per gilt from purchase to first conceiving (excl. the cost of insemination)
AI = average costs per conception of sow AB = total costs of gestation period per sow AK = total costs of nursing period per sow
AJ = costs of barren days from weaning to conceiving as depending on conception rate
AV = total costs per sow from last weaning to culling i = index (1 ... mated gilts, 2 ... 1st parity sows, etc.)
total costs of all sows per year NPPPCR1:
NPPC1
NPPCR1 = –––––––– × NN × 365 CNDP
total number of days spent in a herd (herd days) CNDP:
NN
CNDP = –––– × PP(1) × (JDZ1 + DB) –VP(1) × 100
DB i=3
× (JDZ1 + ––––) + VP(2) × (DDO + DVJ) +
∑
VP(i) ×2 MV+1
× (JDZ1 + i × (DB + DDO) + (i –1) × JD1 + DVJ)
1st row … mated gilts,
2nd row … 1st parity sows,
3rd row … sows at 2nd and higher parities
where:
NN = the herd size (number of sows and mated gilts in a herd)
PP(1) = percentage of mated gilts
JDZ1 = days from purchase to conception depending on conception rate
JD1 = average number of days from weaning to conception depending on conception rate
DB = gestation length (days)
resUlts And discUssion
The share of mated gilts designed for herd re-placement (out of the total number of sows in a herd) gives us space for the culling of sows after the particular parities. The higher the percentage of mated gilts, the higher culling rate may be used. On the contrary, the higher the culling rates at parities, the higher the percentage of mated gilts is neces-sary to maintain the herd size. It holds good that the sum of culled sows at all parities in a herd equals the number of gilts for herd replacement. It is ap-plicable to one production period (one parity), i.e. the number of mated gilts multiplied by herd turno-ver (by the number of production periods per year or the average number of litters per sow per year) indicates the total annual herd replacement.
Table 1 shows specified culling rate, percentage of sows at parities (herd structure), percentage of culled sows out of total number of culled ones and cumulative culling percentage. The average number of litters per sow per year was 2.19. The table documents that 17.09% of mated gilts allows for 15% culling in the particular parities while the percentage of sows at parity 1 and 2 (31.62%) ba-sically equals the percentage of sows at parities 3–5 (31.77%) and the annual herd replacement is 37.62%. After five parities the number of removed sows slightly exceeds a half (55.63%) of the total number of culled sows. The ratio of parities 1 and 2 to parities 3–5 is still positive for 16% culling rate.
It is derived from the table that a possible increase in the annual culling by 1% is conditioned by an about 0.5% increase in the number of mated gilts per reproductive cycle, multiplied by the number of litters per sow per year 2.19 (2.19 × 0.46 = 1).
The recommended herd structure according to Goliášová (2007), i.e. 18–20% of mated gilts and 30–35% of sows at parities 1 and 2 and also at pari-ties 3–5 at the same time, could be realised accord-ing to our simulation only with 15% cullaccord-ing, when these proportions of sows were equal. Considering the recommended range of annual herd replace-ment 35–40%, the culling rate must be 15–17% with 17–18% of mated gilts and/or sows at parity 1. If the culling rate is higher than 17%, the percentage of the group of parities 1–2 becomes dominant over the group of parities 3–5 and the herd replacement will also exceed the recommended level 40%. Cumulative culling rates are also high. However, it should be taken into account that our simulated regular culling rate from the first to the last but one parity will be replaced in pig operations by an increasing culling rate approximately since parity 3–4.
Investigations of the culling structure carried out by Dagorn and Aumaitre (1979) in commer-cial herds in France showed that 63–73% of sows in total were removed after parity 5. It would cor-respond to the regular culling rate 18% and more according to our computations.
There is a significant difference if we compare the increasing cumulative percentage of culled sows
1 2
3 4
5 6
7 815 16 17 1819
2021 0
2 4 6 8 10 12 14 16 18 20
Percentage of sows
Parity
Culli
intensit Figure 1. Parity structure of the herd according to culling intensity
Culling intensit
[image:4.595.66.390.513.759.2]C ha ra ct er Pa ri ty C lu st er ed p ar iti es H er d an nu al re pl ac em en t ra te m at ed gi lts 1 2 3 4 5 6 7 8 1 + 2 3 to 5 6 to 8 cu lli ng ra te (% ) 0 20 20 20 20 20 20 20 10 0 Pr op or tio n of so w s ( % ) 19 .3 8 19 .3 8 15 .5 0 12 .4 0 9. 92 7. 94 6. 35 5. 08 4. 06 34 .8 30 .2 6 15 .4 9 42 .6 4 Pe rc en ta ge o f t ot al c ul le d (N o. ) 0 20 .0 0 16 .0 0 12 .8 0 10 .2 4 8. 19 6. 55 5. 24 20 .9 7 C ul le d (c um ul at iv e pe rc en ta ge ) 0 20 .0 0 36 .0 0 48 .8 0 59 .0 4 67 .2 3 73 .7 9 79 .0 3 10 0 cu lli ng ra te (% ) 0 21 21 21 21 21 21 21 10 0 Pr op or tio n of so w s ( % ) 19 .8 4 19 .8 4 15 .6 8 12 .3 8 9. 78 7. 73 6. 11 4. 82 3. 81 35 .5 2 29 .9 0 14 .7 4 43 .6 7 Pe rc en ta ge o f t ot al c ul le d (N o. ) 0 21 .0 0 16 .5 9 13 .1 1 10 .3 5 8. 18 6. 46 5. 10 19 .2 0 C ul le d (c um ul at iv e pe rc en ta ge ) 0 21 .0 0 37 .5 9 50 .7 0 61 .0 5 69 .2 3 75 .6 9 80 .8 0 10 0 Ta bl e 1 to b e co nt in ue d
after five parities (Table 1) with the same indicator computed for an optimum structure and culling rate according to Carroll (1999) (Table 2). With such an optimum herd structure only 35.3% of sows would be removed after parity 5 and the cumulative percentage of culled sows would reach the same level as the studied variants of culling only after parity 7 (76.47% versus 67.94–80.80%).
Figure 1 illustrates the percentages of sows in the particular parities that decrease with ascend-ing parity. With the highest studied cullascend-ing rate the
initial proportion of mated gilts or 1st parity sows
is necessarily the highest but it decreases the most rapidly and the percentage of parity 8 sows is the lowest of all culling rates under study in this cull-ing rate type. On the other hand, with the lowest culling rate the necessary initial stock of sows is the lowest and this low rate allows for the highest percentage of sows until parity 8. In this case, the herd structure is markedly shifted toward higher percentages of sows at higher parities, i.e. of sows with litters of larger size. The herd structure is sub-stantially changed by different culling rates. These relations are also documented in Table 1.
The above-described trend is still more evident if different culling rates are compared in a situation when parities are grouped (parity 1 and 2, pari-ties 3–5 and paripari-ties 6–8, see Figure 2). Breeders’ organisations often use the herd structure divided into these groups following the recommendation of an appropriate herd structure. The graph illus-trates that the higher the culling rate in a herd is, the higher the initial number of mated gilts should be. It also clearly shows the superiority of parities 1 and 2 over the group of parities 3 to 5 in the case of higher culling rates. In other words, smaller lit-ters prevail over larger ones. The variant with 16% culling rate is a limit when both groups of parities are balanced.
With decreasing culling rate the percentage of sows at lower parities gradually decreases and, on the contrary, a still higher proportion of sows re-mains in the herd until the highest parity under observation.
[image:6.595.82.274.76.764.2]of sows culled after parity 1 (21%). The cumulative percentage indicates that the share of culled sows after five parities significantly rises with increasing culling rate.
If the same percentage of sows is culled at the particular parities, the percentage of removed sows (out of the total number of culls) gradually decreases because the same percentage is culled from a decreasing number of sows.
Although the same culling rate from parity 1 to the last parity is rather a hypothetical practice hardly re-alisable in pig operations, the above-described trends can be somehow useful for the practical application of different intensity of sow selection in a herd.
In an ideal herd structure presented by Carroll (1999) the mated gilts were not included in the sow stock in a herd. According to our computations the above-mentioned herd structure implies the fol-lowing culling rates after the particular parities:
Parity No. 1 2 3 4 5 6 7 8
Sow
percentage 17 16 15 14 13 11 10 < 4 Culling rate
after parity (%) 5.9 6.3 6.6 7.2 15.4 9 > 60 – Obviously, the culling rate is at a minimum level of about 6%. If mated gilts were included in the sow stock as it is usually done, with the same
cull-ing rate and on the assumption of zero cullcull-ing of mated gilts the herd structure would be as is shown in Table 2.
Such an ideal division of parities would mark-edly increase the sow percentage at higher parities. The percentage of sows at parities 3 to 5 parity is even higher than that at parities 1 and 2. The ratio of these two categories of litters (as distinguished by Čeřovský, 2001) would be markedly better, and consequently it would lead to a markedly higher number of produced piglets in a herd compared to the variants with usual culling rates.
With this ideal structure and culling rates a suf-ficient number of mated gilts (on the assumption of their zero culling) is only 14.5% out of the total number of sows in a herd. The annual herd replace-ment is less than 32% in this case, so it is lower than the herd replacement recommended as optimum by Goliášová (2007), i.e. 35–40%, or by Morrow (1997), i.e. 35–36%. Čeřovský (2001) recommended the herd replacement not to be lower than 30%, and on the other hand, it should not exceed 50%. The above-mentioned ideal herd structure according to Carroll (1999) is still consistent with this interval. Among the culling variants we tested in this study (Table 1) only the variant with 15% culling rate at the particular parities and 17% of mated gilts com-plies with these recommendations, i.e. the variant Mated
gilts 1st and2nd 3rd to
5th 6th to8th
15% 17%
19% 21%
0 5 10 15 20 25 30 35 40
Proportion of sows (%)
Parity
[image:7.595.67.402.82.361.2]Culling intensity ( Culling intensity (%)
Figure 2. Herd structure (clustered parities)
1st
3rd
5th 6th
8th
Ta bl e 2. C ul lin g ra te a nd p ro po rt io n of so w s a t p ar iti es [h er d tu rn ov er 2 .2 ; o pt im al h er d st ru ct ur e ac co rd in g to C ar ro ll (1 99 9) C ha ra ct er Pa ri ty C lu st er ed p ar iti es H er d an nu al re pl ac em en t ra te m at ed gi lts 1 2 3 4 5 6 7 8 1 + 2 3 to 5 6 to 8 cu lli ng ra te (% ) 0 5. 90 6. 30 6. 60 7. 20 15 .4 0 9. 00 60 .0 0 10 0. 00 Pr op or tio n of so w s ( % ) 14 .5 3 14 .5 3 13 .6 8 12 .8 1 11 .9 7 11 .1 1 9. 40 8. 55 3. 42 28 .2 1 35 .8 9 21 .3 7 31 .9 7 Pe rc en ta ge o f t ot al c ul le d (N o. ) 0 5. 90 5. 93 5. 82 5. 93 11 .7 7 5. 82 35 .3 0 23 .5 3 C ul le d (c um ul at iv e pe rc en ta ge ) 0 5. 90 11 .8 3 17 .6 5 23 .5 8 35 .3 5 41 .1 6 76 .4 7 10 0. 00 Ta bl e 3. C om pa ri so n of h er d ec on om ic c ha ra ct er is tic s u si ng d iff er en t c ul lin g le ve ls (1 00 so w s) C ul lin g ra te (% ) Av er ag e ag e of cu lle d so w (d ay s) N on - pr od uc tiv e da ys p er ye ar C os t p er so w (C c) * Th e sh ar e of so w in pi gl et c os t (C c) To ta l c os ts re ca lc ul at ed pe r s ow (C c) To ta l r et ur ns re ca lc ul at ed pe r s ow (C c) To ta l p ro fit re ca lc ul at ed pe r s ow (C c) W ea ne d pi gl et s p er so w p er ye ar (N o. ) To ta l an nu al pr od uc tio n of p ig le ts (N o. ) C os ts o f pi gl et ti ll 20 k g of liv e w ei gh t (C c) Pr ofi ta bi lit y (d iff er en ce fr om 1 5% cu lli ng le ve l) (% ) 6 ** 1 34 2. 7 5 71 3 17 0 43 85 0 65 7 37 82 4 01 16 6 64 20 .0 5 1 91 9 1 17 6 +2 .1 6 15 1 15 8. 1 6 17 4 17 8 18 91 2 64 7 89 79 8 16 15 0 26 19 .5 4 1 87 0 1 23 8 0. 00 16 1 13 8. 6 6 23 5 17 8 38 91 6 64 6 66 79 5 44 14 8 78 19 .4 8 1 86 4 1 24 2 –0 .1 8 17 1 10 9. 8 6 33 6 17 8 73 92 4 64 3 60 78 9 80 14 6 20 19 .3 4 1 85 0 1 25 1 –0 .4 7 18 1 08 7. 3 6 41 7 17 9 02 93 1 64 1 59 78 5 83 14 4 24 19 .2 4 1 84 1 1 25 7 –0 .7 1 19 1 06 6. 3 6 49 6 17 9 27 93 6 63 9 77 78 2 17 14 2 39 19 .1 5 1 83 2 1 26 3 –0 .9 3 20 1 04 3. 8 6 58 5 17 9 58 94 3 63 7 53 77 7 80 14 0 27 19 .0 4 1 82 2 1 27 0 –1 .1 9 21 1 02 1. 2 6 68 0 17 9 90 95 1 63 5 19 77 3 27 13 8 08 18 .9 2 1 81 1 1 27 7 –1 .4 5 *C ze ch c ro w ns ** cu lli ng ra te in cr ea se s a fte r 3
rd fa
rr
ow
in
[image:8.595.76.495.76.771.2] [image:8.595.276.492.102.755.2]recommended by breeders in the Czech Republic (Goliášová, 2007).
Culling after parity 1 and 2 is often so high that only a minimum number of sows in a herd reaches
[image:9.595.59.533.164.743.2]parities with the largest litters. It is to note that no unambiguous conclusion about the future performance of a sow can usually be drawn from performance at parity 1 and 2. Herd replacement
Table 4. The most important input values used for calculations in all variants of culling intensity
Input character Value
Herd size (sows and mated gilts) 100
Parity at removal 8
Percentage of gilts culled without conceiving (% of herd size but extra of stock herd) 4
Average age of gilt entering herd (days) 185
Days from entry to 1st mating 55
Percentage of sows conceived after 1st insemination 80
Percentage of sows conceived after 2nd insemination 15
Percentage of sows conceived after 3rd insemination 5
Average number of AI doses per 1 insemination 2.5
AI dose cost (Cc)* 130
Average litter size at 21st day (1st farrowing) 10
Average litter weight at 21st day (1st farrowing, kg) 58
coefficients for recalculation of litter size according to the 1st litter
Coefficient for 2nd litter 1.06
Coefficient for 3rd litter 1.11
Coefficient for 4th litter 1.13
Coefficient for 5th litter 1.14
Coefficient for 6th litter 1.12
Coefficient for 7th litter 1.08
Coefficient for 8th litter 1.08
Days to weaning 28
Days from weaning to conception (1st heat) 6
Gestation length (days) 115
Days from last weaning to slaughter 45
Fixed costs/day/barren sow (Cc) 20
Fixed costs/day/gestating sow (Cc) 25
Fixed costs/day/nursing sow (Cc) 38
Feed mixture consumption/barren sow/day (kg) 2
Feed mixture consumption/gestating sow/day (kg) 3
Feed mixture consumption/nursing sow/day (kg) 6
Cost/kg of feed mixture for barren and gestating sows (Cc) 4.38
Cost/kg of feed mixture for nursing sows (Cc) 5.53
is too high as a consequence of such culling, and the situation is just opposite to that described by Čeřovský (2001).
Table 3 shows economic indicators computed by the EPOS programme on the basis of simulat-ing a herd of 100 sows with different cullsimulat-ing rates. All data are computed as values per year. With the exception of culling rate, all other input data were on the same level in all culling variants under ob-servation (Table 4). The costs of a sow are based on the costs of all sows in a herd from which the returns per culled sows and unconceived gilts are deducted. The share of a sow in the costs of a pig-let is the cost of a sow divided by the number of weaned piglets. Recalculated costs, returns and profit are total costs, returns and profit in a herd per year recalculated per sow. As for profitability, only deviations from the basic level of profitability obtained with 15% culling rate are given.
Table 3 documents an obvious correlation be-tween the culling rate and average age of sows at their removal. With increasing culling rate the aver-age aver-age when sows were removed from a herd de-creased and the percentage of sows at most prolific parities 3 to 5 decreased contemporarily. It led to the lower production of piglets in a herd while the costs of a piglet until 20 kg of live weight rose as a result of the increased share of sows in these costs. With increasing culling rate the number of barren days in a herd also increased. Total costs, total re-turns and total profit in a herd recalculated per sow per year and profitability decreased. These figures confirm the conclusions of Koketsu (2007) about the relationship between the lower culling rate at earlier parities and higher longevity of sows. The 6% culling rate computed according to an ideal herd structure (Carroll, 1999) provided the most favour-able results in all characteristics in practice. Age of sows at removal was the highest in this case.
Our results confirm the conclusions of Engblom et al. (2007) that with increasing parity of sow re-moval the number of produced piglets also increas-es and the number of barren days decreasincreas-es.
conclUsion
Culling rate markedly changes the herd structure and the length of sow’s stay in a herd. With increas-ing cullincreas-ing rate the average age of sows in a herd de-creases, the number of weaned piglets per sow drops, total production of piglets is lower while the share
of a sow in the cost per piglet increases, and conse-quently, the cost per piglet until 20 kg of live weight rises. With increasing culling rate the total profit in a herd recalculated per sow per year decreases, and profitability is lower. Total costs and returns recalcu-lated per sow per year also decrease. The trend of an increase in the number of barren days of sows in a herd with increasing culling rate is confirmed.
With constant culling rate at all parities the rec-ommended positive ratio of parities 1 and 2 to pari-ties 3–5 can apparently be maintained only with 15–16% culling rate. This ratio becomes worse with increasing culling rate, sows of low parities become dominant in the herd and an increasingly higher percentage of sows is removed before they reach their production peak.
Although the constant culling rate from the first to the last parity is hardly practicable in pig opera-tions, the comparison of various culling rates may help to define such a herd structure that is the most suitable from the aspect of breeder’s plans.
reFerences
Appel L.J., Strandberg E., Danell B., Lundeheim N. (1999): Culling before testing in swine: identification of culling strategy and estimation of culling precision. Journal of Animal Science, 77, 1666–1678.
Bečková R., Daněk P., Václavková E., Rozkot M.(2005): Influence of growth rate, backfat thickness and meati-ness on reproduction efficiency in Landrace gilts. Czech Journal of Animal Science, 50, 535–544. Carroll C. (1999): Sow culling and parity profiles. In:
Proceedings of the Pig Farmers’ Conferences. Teagasc 1999, Longford, Ireland, 35–41.
Čechová M., Tvrdoň Z. (2002): An influence of different growth ability of Czech Large White gilts and Landrace gilts on their reproductive performance. Czech Journal of Animal Science, 47, 319–327.
Čeřovský J. (2001): Basic physiological and technological presumptions of pig reproduction In: Říha J., Čeřovský J., Matoušek V., Jakubec V., Kvapilík J., Pražák Č.: Re-production in Pig Breeding Operation. Rapotín, CR, 135. (in Czech)
Dagorn J., Aumaitre A. (1979): Sow culling: Reasons for and effect on productivity. Livestock Production Sci-ence, 6, 167–177.
Engblom L., Lundeheim N., Dalin A.M., Andersson K. (2007): Sow removal in Swedish commercial herds. Livestock Science, 106, 76–86.
Goliášová E.(2007): Pig Breeders Association in Bohemia and Moravia. Personal Communication.
Houška L. (2007): EPOS (FoxBase+ program for calcula-tion of economic efficiency of pig herd), version 1.063. Authorized software. Institute of Animal Science, Prague-Uhříněves, CR.
Houška L., Wolfová M., Fiedler J. (2004): Economic weights for production and reproduction traits of pigs in the Czech Republic. Livestock Production Science, 85, 209–221.
Humpolíček P., Urban T., Matoušek V., Tvrdoň Z. (2007): Effect of estrogen receptor, follicle stimulating hor-mone and myogenin genes on the performance of Large White sows. Czech Journal of Animal Science, 52, 334–340.
Koketsu Y. (2007):Longevity and efficiency associated with age structures of female pigs and herd manage-ment in commercial breeding herds. Journal of Animal Science, 85, 1086–1091.
Lawlor P.G., Lynch P.B.(2007): A review of factors influ-encing litter size in Irish sows. Irish Veterinary Journal, 60, 359–366.
Li F.E., Mei S.Q., Deng C.Y., Jiang S.W., Zuo B., Zheng R., Li J.L., Xu D.Q., Lei M.G., Xiong Y.Z. (2008): Associa-tion of a microsatellite flanking FSHB gene with repro-ductive traits and reprorepro-ductive tract components in pigs. Czech Journal of Animal Science, 53, 139–144. Lucia T., Dial G.D., March W.E. (2000): Lifetime
repro-ductive performance in female pigs having distinct reasons for removal. Livestock Production Science, 63, 213–222.
Morrow W.E.M. (1997): Understanding sow wastage rates. In: Proceedings of the North Karolina Healthy Hog Seminar. November 1997, Greenville, Fayetteville. USA.
Pavlík J., Kolář M.(1990): Lifetime performance of lon-geval sows in relation to age at first conceiving. Czech Journal of Animal Science, 35, 699–704. (in Czech)
Received: 2008–06–19 Accepted after corrections: 2009–02–18
Corresponding Author