USING MOLECULAR PHYLOGENETIC TECHNIQUES
by
Jay Christopher Zimmers
A thesis
submitted in partial fulfillment of the requirements for the degree of
Master of Science in Biology Boise State University
August 2015
© 2015
Jay Christopher Zimmers ALL RIGHTS RESERVED
DEFENSE COMMITTEE AND FINAL READING APPROVALS
of the thesis submitted by
Jay Christopher Zimmers
Thesis Title: Two Cryptic Species Within Astragalus cusickii Delimited Using Molecular Phylogenetic Techniques
Date of Final Oral Examination: 3 June 2015
The following individuals read and discussed the thesis submitted by student Jay Christopher Zimmers, and they evaluated his presentation and response to questions during the final oral examination. They found that the student passed the final oral examination.
James F. Smith, Ph.D. Chair, Supervisory Committee Stephen Novak, Ph.D. Member, Supervisory Committee Merlin M. White, Ph.D. Member, Supervisory Committee
The final reading approval of the thesis was granted by James F. Smith, Ph.D., Chair of the Supervisory Committee. The thesis was approved for the Graduate College by John R. Pelton, Ph.D., Dean of the Graduate College.
iv
The author would like to thank James F. Smith, Ph.D., for his guidance, advice, and contribution of collected materials; committee members Merlin M. White, Ph.D., and Stephen Novak, Ph.D., for their advice; Michael Mancuso for his assistance in locating specimens, and contribution of collected materials; Don Mansfield for his contribution of collected materials; Matt Pride for his assistance with figures; Jessica Holland-Zimmers for her support; the US Fish and Wildlife Service for their financial assistance; the
Department of Biological Sciences at Boise State University for their assistance, financial and otherwise.
v
Understanding the source of phenotypic variability is a challenge in the biological sciences. Variation in phenotypes is the result of variation in the genetics and
environment the organism experiences, but elucidating the relative contribution of these two parameters can pose problems, especially in the field of systematics. Systematists are challenged to classify biological diversity into groups that share common ancestry.
Phenotypic variation can be useful to demonstrate common ancestry, but only when the primary contributor to the variation is under strong genetic control, and thus heritable.
Cusick’s milkvetch (Astragalus cusickii) is a perennial forb endemic to the intermountain west region of the United States. The species currently comprises four varieties based on subtle morphological dissimilarities, such as leaf size and density, and the size and shape of the seed pods. The taxonomic organization of the varieties of A. cusickii and related species of Astragalus were reexamined through phylogenetic analysis of nuclear, nuclear- ribosomal, and chloroplast gene regions. Maximum parsimony, maximum likelihood, Bayesian inference, the genealogical sorting index, an approximately unbiased test, and multispecies coalescent analysis were used to determine appropriate species boundaries under the phylogenetic species concept. The results support reclassification of A. cusickii var. packardiae and A. cusickii var. sterilis as separate species. Additionally, evidence suggests a chloroplast capture event may have occurred in one population of A. cusickii var. packardiae.
vi
ACKNOWLEDGEMENTS ... iv
ABSTRACT ... v
LIST OF TABLES ... viii
LIST OF FIGURES ... ix
INTRODUCTION ... 1
Species Concepts ... 1
Phenotypic Plasticity ... 8
Molecular Systematics ... 9
Study Species ... 11
Research Approach ... 15
MATERIALS AND METHODS ... 17
Collection and DNA Extraction ... 17
PCR and Investigation of Gene Regions ... 17
Matrix Assembly ... 21
Phylogenetic Analyses ... 22
Testing Alternative Topologies... 24
Multispecies Coalescent... 25
RESULTS ... 27
Amplification, Sequencing, and Alignment... 27
vii
Tests of Alternative Topologies ... 31
Multispecies Coalescent... 31
DISCUSSION ... 33
Tests of Alternative Topologies ... 34
Multispecies Coalescent... 36
Chloroplast Capture ... 38
CONCLUSION ... 42
TABLES ... 45
FIGURES ... 50
LITERATURE CITED ... 68
APPENDIX ... 85
Authority, Voucher, Collection, and GenBank Information Pertaining to Individuals Included in Analyses ... 85
viii
Table 1. Gene regions investigated via polymerase chain-reaction in Astragalus species ... 46 Table 2. Genealogical sorting index scores and corresponding p-values. P-value <
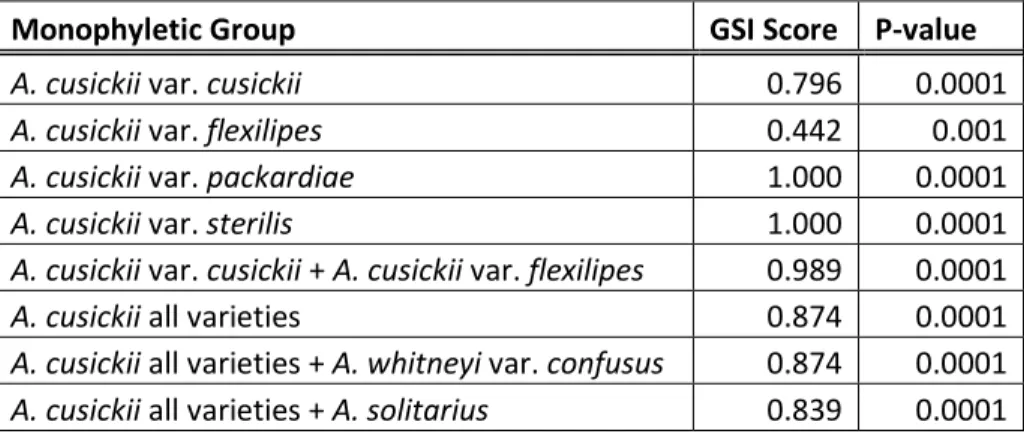
0.05 results in rejection of null hypothesis that the defined monophyletic group is incorrect. Genealogical sorting index possible scores range from 0 to 1, with 1 indicating complete lineage sorting, and 0 indicating no lineage sorting. ... 47 Table 3. Models and parameters suggested by jModelTest for gene regions
included in the analysis ... 48 Table 4. P-values resulting from the approximately unbiased test of three
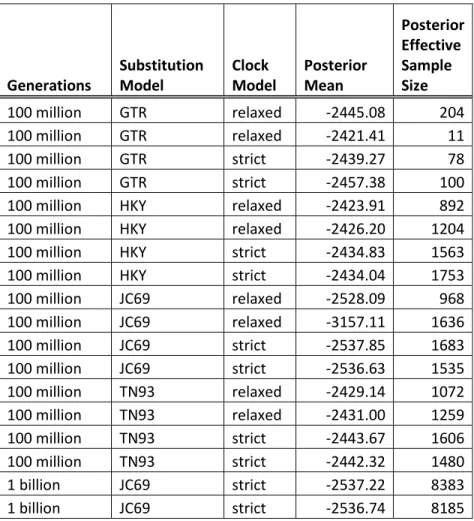
monophyletic arrangement hypotheses. P-value < 0.05 results in rejection of hypothesis. ... 49 Table 5. Substitution and clock models, and resulting posterior statistics of multiple
*BEAST analyses ... 49 Table A.1. Authority, voucher, collection, and GenBank information pertaining to
individuals included in analyses. ... 86
ix
Fig. 1. Individual Astragalus cusickii var. cusickii photographed on 27 June 2013 on a steep, gravelly slope in Hells Canyon, Adams county, Idaho.
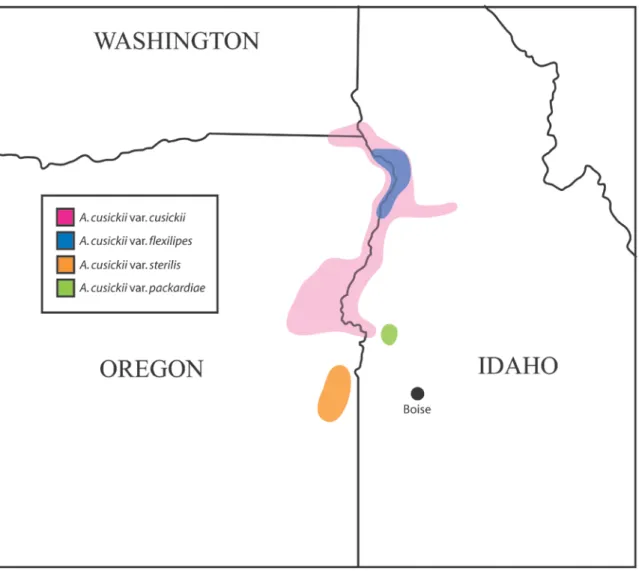
Numerous inflated papery pods are evident. ... 51 Fig. 2. Map of the approximate ranges of the varieties of Astragalus cusickii,
focused on an area spanning the borders between the states of Idaho, Oregon, and Washington, in the Pacific northwest region of the United States. Colors corresponding to particular varieties are defined in the inset legend. ... 52 Fig. 3. Conspicuous oblique, half-ellipsoid, papery pods on an individual
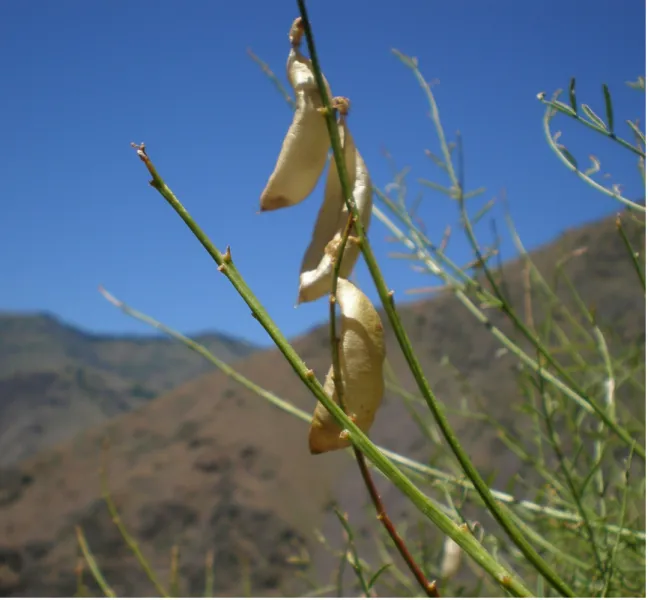
Astragalus cusickii var. flexilipes, photographed on 27 June 2013 on a steep, sandy slope near the top of a hill in Hells Canyon, Adams county, Idaho. ... 53 Fig. 4. Conspicuous inflated, brightly-mottled, papery pods on an individual
Astragalus cusickii var. sterilis, photographed on 11 June 2013 near Birch creek, Malheur county, Oregon. ... 54 Fig. 5. Individual Astragalus cusickii var. packardiae photographed on 30 May
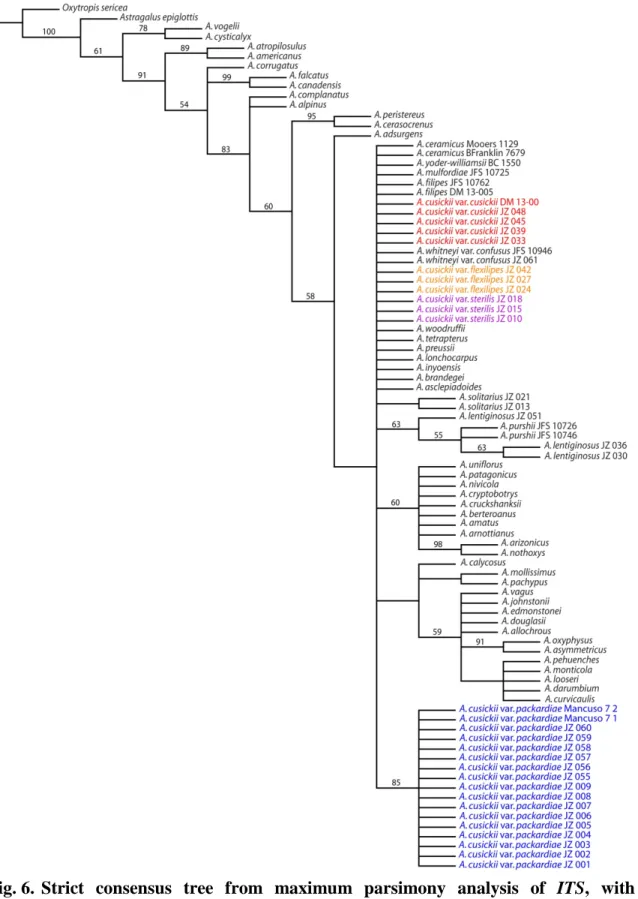
2014 on a hillside in Payette county, Idaho. Numerous slender pods are evident. ... 55 Fig. 6. Strict consensus tree from maximum parsimony analysis of ITS, with
bootstrap values above branches. Varieties of Astragalus cusickii are highlighted in color. 70 equally most-parsimonious trees were found. L = 381, CI = 0.750, RI = 0.806 ... 56 Fig. 7. Strict consensus tree from maximum parsimony analysis of trnS-G, with
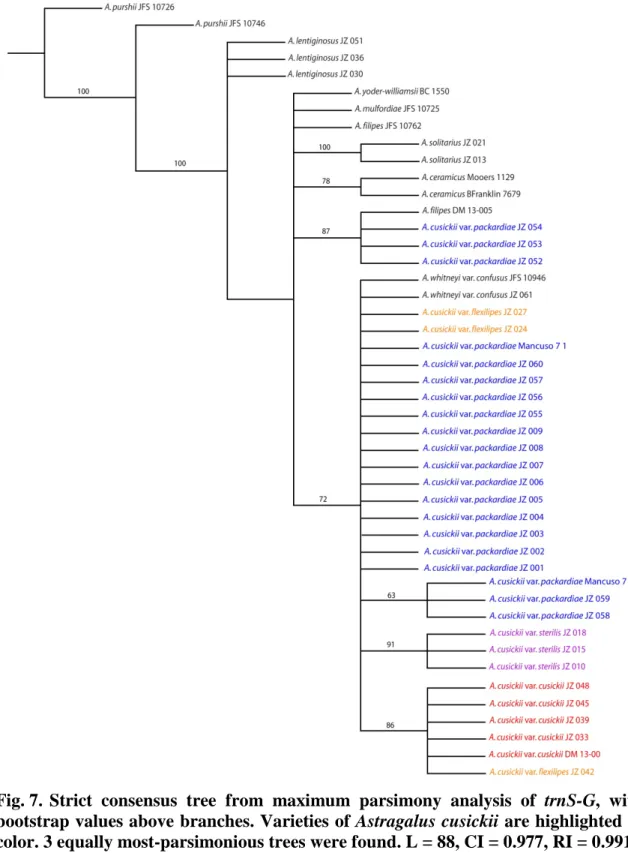
bootstrap values above branches. Varieties of Astragalus cusickii are highlighted in color. 3 equally most-parsimonious trees were found. L = 88, CI = 0.977, RI = 0.991 ... 57 Fig. 8. Strict consensus tree from maximum parsimony analysis of matrix 1, with
bootstrap values above branches. Varieties of Astragalus cusickii are highlighted in color. 30 equally most-parsimonious trees were found. L = 689, CI = 0.805, RI = 0.869 ... 58
x
highlighted in color. 20 equally most-parsimonious trees were found. L = 419, CI = 0.886, RI = 0.929 ... 59 Fig. 10. Strict consensus tree from maximum parsimony analysis of matrix 3, with
bootstrap values above branches. Varieties of Astragalus cusickii are highlighted in color. A single most-parsimonious tree was found. L = 154, CI = 0.883, RI = 0.941 ... 60 Fig. 11. Majority-rule tree generated from Bayesian inference analysis that is
congruent with maximum parsimony and maximum likelihood analyses.
Varieties of Astragalus cusickii are highlighted in color. Values above branches correspond to maximum parsimony bootstrap support, maximum likelihood bootstrap support, and Bayesian inference posterior probability, respectively. Triangle represents 17 individual Astragalus cusickii var.
packardiae collapsed to save space. Continued on next page. ... 61 Fig. 12. Combined Metropolis-coupled Markov chain trace plot of independent
Bayesian inference analyses of ITS, ETS, CNGC4, and trnS-G gene regions in varieties of Astragalus cusickii and related species, ran for ten million generations. Burn-in was set at 50,000 generations. X-axis corresponds to generation number. Lack of a clear vertical trend in the data supports MCMC completion. ... 63 Fig. 13. Joint-marginal plot comparing two independent Bayesian inference
analyses of Astragalus species using ITS, ETS, CNGC4, and trnS-G gene regions. Analyses ran for ten million generations. Metropolis-coupled Markov chain convergence is indicated by the proximity of data points to the diagonal. ... 64 Fig. 14. Are We There Yet plot of Bayesian inference analyses of ITS, ETS,
CNGC4, and trnS-G gene regions in varieties of Astragalus cusickii and related species, ran for ten million generations. Burn-in was set at 50,000 generations. Horizontal tracks indicate MCMC completion. ... 65 Fig. 15. Species tree resulting from multispecies coalescent analysis conducted in
*BEAST including only taxa for which sequence data from more than one individual was available, and where each individual had sequence data for ITS, ETS, CNGC4, and trnS-G for one billion generations. Posterior probabilities are listed above branches. Note that *BEAST does not require an outgroup to be specified. ... 66 Fig. 16. Joint-marginal plot comparing two independent *BEAST analyses of
Astragalus species using ITS, ETS, CNGC4, and trnS-G gene regions.
Analysis used the JC69 substitution model and a strict clock for one
xi
INTRODUCTION
Our understanding of the biological world, among scientists and non-scientists alike, is founded in the grouping of organisms into categories based on observations of phenotypic variation. When we distinguish one group of organisms from another, be they from different kingdoms or from the same species, we begin with the observation of differences in phenotypic characteristics. The immediately apparent phenotypic differences between a mammal and a magnolia tree are on a spectrum with the more subtle phenotypic traits used to conceptually separate one breed of dog from another. The consideration of phenotypic variation is crucial to any understanding of the diversity of life. However, phenotypic variation alone is not an unambiguous criterion for designating species. While we may be comfortable applying labels to breeds of dog based on criteria such as differences in coat color, few would argue that different breeds should be
considered separate species.
Species Concepts
The concept of species is fundamental to the study of biology, and represents one of the most important operational units used by biologists (de Queiroz, 2005; Mayr, 1982). Species provide one of the central pillars of the conceptual framework within which much biological research is conducted. Perhaps more importantly, the concept of species is one of the few biological terms widely, if not always accurately, understood by those outside of the discipline of biology, providing biologists with a crucial tool for communicating with the public about the implications of biological research.
Observable variation in phenotypes is an important aspect of biology, yet it is inadequate to fully explain one of the central concepts of the discipline: species. For all its undeniable importance, finding a discipline-wide consensus as to the precise definition of the concept of species has proved difficult, and has provoked considerable discussion.
In their attempts to delimit particular species boundaries, biologists have created many competing definitions of species, including at least 24 formally named species concepts, many of which are mutually exclusive, and provide for differing boundaries between species, and different counts of species totals within various genera (de Queiroz, 1998, 2007; Harrison, 1998; Mayden, 1997).
Probably the most commonly understood definition of species comes from the biological species concept. Under this concept, species are defined by the ability or potential of organisms to reproduce, resulting in fertile offspring (Dobzhansky, 1950;
Mayr, 1942; Wright, 1940). This approach has several advantages. Among these, it is perhaps the most immediately intuitive concept of species, particularly to non-biologists.
Whereas the other species concepts may require a background in biology to fully appreciate, understanding that only organisms of the same species can interbreed, could almost be thought of as conventional wisdom. It is a simply stated criterion, and provides for a fairly straightforward test (in some cases). The biological species concept also has the advantage of aligning with our conceptual understanding of populations as
interbreeding groups of individual organisms.
However intuitive the biological species concept may appear to be at first glance, a fairly long list of exceptions to the rule exists. Many organisms do not reproduce sexually, for example, and so become difficult to define. In a species in which all
individuals are born as pregnant females, each essentially giving birth to her own clones, should we consider every individual lineage as a separate species, no matter how much similarity in morphology or ecological niche they share? Ring species, in which adjacent populations can interbreed, but more distant populations cannot, pose another challenge for the biological species concept. Such species present a paradox: By the biological species concept, the adjacent populations which can interbreed form a single species, yet under the same concept the more distantly placed populations which cannot interbreed are not members of the same species. There are also significant concerns as to the practicality of the concept when applied to field research. In many cases it may be difficult or impossible to verify the interbreeding, or even potential of interbreeding, among groups of organisms (Skokal and Crovello, 1970). In such cases, the biological species concept, even if useful in the abstract sense, becomes meaningless in practice.
Hybrids present another example of a situation where the biological species concept is not a good model to explain the boundaries between species. In an example which illustrates this phenomenon, Clay et al. (2012) present a situation in Castilleja, where two species with overlapping territory form a hybrid species. The hybrid species exhibits a morphology unique from both of the progenitor species. All three species, progenitors and hybrid, were demonstrated to be following independent evolutionary trajectories. The three taxa would each separately meet the criteria of species under many of the alternative species concepts, yet due to each being reproductively compatible with the others, the biological species concept would consider all three taxa as a single species.
Even when applied to organisms that reproduce sexually, and are not ring species or hybrids, the biological species concept can still lead to results that are not reflective of
the true genealogical history of the organisms in question. Often, particularly in cases in which a single population becomes reproductively isolated from other populations which remain reproductively compatible with each other, the biological species concept can lead to a group of organisms being labeled as a single species, but which actually represent a paraphyletic evolutionary history (Velasco, 2008). This in turn can lead to scenarios where species trees generated under a framework of the biological species concept fail to show true, historical genealogical relationships among taxa, or worse, show incorrect relationships. The biological species concept defines the boundary between species as reproductive isolation, but reproductive isolation is only one of many character changes that will occur between taxa during the process of speciation. It is not necessary that reproductive isolation be the first of these character changes to occur (de Queiroz, 1998).
It is then possible to imagine a scenario where two recently diverged populations have evolved to become reproductively isolated from one another, yet one retains reproductive compatibility with a more distantly related population as a symplesiomorphy (Velasco, 2008). In this case, the biological species concept would define the more distantly related populations as a single species due to their retained reproductive compatibility, even though one of the populations actually shares a more recent common ancestor with the now reproductively isolated population. The error of species defined by the biological species concept representing paraphyletic groups occurs frequently enough to preclude dismissing the problem as too rare to be important. Funk and Omland (2003) surveyed 584 animal phylogeny studies, and found evidence of paraphyly in 23% of the species included in the studies in which detecting paraphyly was possible. Their findings demonstrate that the errors resulting from defining species based on reproductive
isolation have a real and negative effect on our understanding of the actual historical relationships among groups of organisms.
An alternative to the biological species concept is the phylogenetic species concept, in which species are defined as the smallest group of organisms that share a common ancestor, and which are distinguishable from other such groups (Donoghue, 1985). This approach avoids many of the potential problems with the biological species concept by focusing directly on the historical genealogical relationships among taxa.
Asexually-reproducing organisms do not present a problem for the phylogenetic species concept. Individuals from asexually-reproducing taxa can be defined as belonging to a species, assuming shared morphology (though determining the degree of morphological differentiation which will define separate species may become a problem – see below).
Likewise, ring species do not present the phylogenetic species concept with the same paradox encountered under the biological species concept. A ring species, containing populations at the extremes (often geographic extremes) which are reproductively
isolated from one another, would be defined as a single species as long as all populations possess the same most recent common ancestor, and are morphologically diagnosable from other groups of organisms. The phylogenetic species concept also avoids the problems of paraphyly encountered as an apparently common outcome of studies employing the biological species concept by focusing directly on the historical
genealogical relationships among taxa. In this context, the importance of reproductive isolation is secondary to the historical genealogy. Two populations which are reciprocally monophyletic and morphologically distinguishable from one another would be defined as separate species under the phylogenetic species concept, even if they retained
reproductive compatibility. However, the phylogenetic species concept is not without its flaws. A common criticism is that a rigid interpretation of the concept leads to over- splitting of taxa into too many species. Under certain circumstances, new ‘species’ may arise from a species approaching extinction, as genetic drift in small, isolated populations may give rise to diagnosable morphological differences in populations which share a recent common ancestor (Zachos and Lovari, 2013). At a certain point, diagnosable morphological differences may become arbitrary, particularly when considering the addition of vast amounts of genetic data that can increasingly be considered when comparing taxa.
Objections to the more extreme predictions of the phylogenetic species concept, like similar objections to certain predictions of the biological species concept, illustrate the fact that many biologists have an intuitive understanding of what it is they mean when they speak of ‘species,’ even if the concept is not explicitly defined in their own minds.
De Queiroz (2007) has attempted to define this commonly-held, yet elusive,
understanding among biologists. According to de Queiroz (2007), all contemporary species concepts have a common vision of what constitutes a species: a separately evolving meta-population lineage. The various competing definitions of species differ only in what secondary criterion is added to this understanding, even if the phrase
‘separately evolving meta-population lineages’ is not actually stated. For example, the biological species concept implicitly defines a species as a separately evolving meta- population lineage which is reproductively isolated from other such groups. Similarly, the phylogenetic species concept defines, though not explicitly, a species to be a separately evolving meta-population lineage with a most recent common ancestor, which is
morphologically diagnosable from other such groups. In what he terms the unified
species concept, de Queiroz (2007) asserts that the only appropriate criterion to determine species is whether or not a given group of organisms are a separately evolving meta- population lineage. All other criteria from previous species concepts can be thought of as milestones along the process of speciation, which need not occur in any particular order (de Queiroz, 1998). Under this concept, two diverging groups of organisms could be defined as separate species earlier in the speciation process than under some of the other species concepts – as early as they could be determined to be separately evolving
lineages.
An obvious criticism of the unified species concept is that it is too vague. By what criteria, exactly, are groups of organisms determined to be separately evolving meta- population lineages? For good reason, there is a strong bias within the scientific disciplines to define a priori as many components of an experiment as possible before beginning. There are several logical reasons for this approach to be an established tradition among scientists, probably most importantly as an attempt to ameliorate the effects of bias on the outcome of an experiment. This impulse would understandably lead many to expect an explicit suite of criteria for defining species to be rigidly followed in all cases across all kingdoms of life. As frustrating as it may be, the vast diversity of life forms on earth may require a definition of species as vague as that of the unified species concept, if it is to be applied across the entire Tree of Life. It may be necessary to accept that if a common understanding of what constitutes a species is to be found among mammals and protozoa, insects and angiosperms, that the definition will have to be broad. It seems likely to be incumbent upon researchers from all sub-disciplines within
biology to determine which criteria for identifying independently evolving meta- population lineages best apply to the organisms they study.
Phenotypic Plasticity
Much of the taxonomic work conducted since the advent of systematics has been performed by carefully examining and comparing phenotypic variation (Hillis, 1987).
Traits which are found to be synapomorphies can provide insight into the relationships among taxa. The phenomenon of phenotypic plasticity, in which environmental factors affect the phenotype of an organism, erodes the reliability of phenotypic variation as a method of diagnosing species boundaries. Phenotypic plasticity introduces considerable uncertainty as to which morphological characters are reliable synapomorphies. Phenotype is determined by a combination of genotype and environmental factors. In humans, height is such a phenotype. The height a person reaches at maturity is determined not solely by the individual’s genes, but is also heavily influenced by environmental factors such as nutrition (Visscher, 2008).
The morphological effects of phenotypic plasticity are even more pronounced among plants. Being sessile, plants must contend with the environmental fluctuations of the location in which they germinate. Consequently, plants exhibit large-scale
physiological responses to variations in environmental factors such as soil nutrient content, temperature, and water availability which can have profound effects on their phenotypic variation (Gurevitch et al., 2002). An example of this phenomenon is heterophylly demonstrated by many aquatic plants in response to fluctuating water availability (Lin, 2002). Such species exhibit conspicuous differences in leaf morphology under different conditions. Separate populations of a particular species of plant living
under different environmental conditions can appear markedly different. The significance of observations of phenotypic variation among individuals or populations, especially among closely related taxa, is therefore brought into doubt. Subtle phenotypic variation between taxa existing in different environmental conditions is a poor criterion for evaluating species boundaries.
Molecular Systematics
Molecular systematics has provided increasingly powerful tools for evaluating species boundaries, and in the study of the evolutionary history of life more broadly.
Arguably, the most useful contribution of molecular data to systematics is the vast increase in the number of potentially informative characters. Determining monophyly through morphological analysis requires a difficult search for synapomorphies. There is a relatively small set of describable morphological characters in any organism, no matter how carefully examined or how observant the researcher. The occurrence of homoplasy further compounds this problem. Molecular techniques allow sequences of homologous genes to be used as character states to be compared among taxa in the search for
synapomorphies. The number of potentially comparable character states is then greatly increased, as compared to a traditional morphological analysis. From the earliest days of molecular systematics, the power of including DNA sequences to increase the dataset available for analysis was recognized (Hillis, 1987).
Molecular tools are particularly useful when attempting to define the species boundaries between closely related, morphologically similar taxa. Pseudopontia
paradoxa (ghost butterfly) was divided into two subspecies, indistinguishable from one another but for a subtle morphological dissimilarity: the form of a single hind wing vein.
Molecular phylogenetic analysis demonstrated this understanding to be an
underestimation of the diversity of P. paradoxa, which was found to contain at least five reciprocally monophyletic groups (Mitter et al., 2011). Under closer observation,
additional distinguishing morphological characteristics were found for some of the newly discovered monophyletic groups, such as unique patterns visible on the wings under UV light. While it is possible that these obscure distinguishing features would have
eventually been found, it is clear that the discovery of monophyletic groups within P.
paradoxa by molecular means led to additional scrutiny that made their discovery more likely. In this way molecular data can augment morphological data.
Just as molecular phylogenetic analysis can demonstrate an underestimate of species diversity, the same techniques can demonstrate that our estimates of species diversity within a given genera may be too broad. Taxa previously understood to be separate species may not merit recognition as such. Molecular phylogenetic analysis of Anticlea vaginata and A. elegans, previously understood to be separate species on the basis of morphology, found that the two taxa are more appropriately classified as members of the same species. Anticlea vaginata is now classified as A. elegans subsp.
vaginata (Palmquist et al., 2015).
Combined, molecular phylogenetic techniques and the phylogenetic species concept provide researchers with the ability to delimit species boundaries with a level of precision previously unavailable. The use of nucleotide sequences as characters for comparison among taxa allows for criteria more closely aligned with the framework of the phylogenetic species concept by determining directly which taxa represent
monophyletic lineages. This approach considers phenotypic variation in a larger context.
When occurring simultaneously with reciprocal monophyly as demonstrated by molecular methods, phenotypic variation can be understood as likely representing inherited, genetically-based traits. Phenotypic variation without demonstration of reciprocal monophyly is often not suitable to define species.
Study Species
The genus Astragalus is a highly diverse group of legumes, containing more recognized species than any other genus among the flowering plants (Frodin, 2004; Lock and Schrire, 2005; Mabberley, 2008). Until recently many systematicists regarded
Astragalus as a ‘wastebasket’ genus, likely to be paraphyletic (Polhill, 1981;
Wojciechowski, 2005). Many previously described groups of organisms have undergone considerable rearrangement as the application of modern molecular techniques within the field of systematics has demonstrated them to actually be paraphyletic or polyphyletic groups. However, the monophyly of Astragalus has been well-supported (Sanderson, 1991; Sanderson and Doyle, 1993; Wojciechowski et al., 1993, 1999). Many species- level relationships within the genus remain unresolved. The large geographic distribution and extreme diversity of Astragalus make it a difficult genus for systematic studies (Scherson et al., 2005). Mating systems have been studied in fewer than 1% of the species within Astragalus (Watrous and Cane, 2011). Most species within Astragalus have not been reviewed since work done in the late 19th century (Bunge, 1868, 1869;
Taubert, 1894).
Species of Astragalus can be found on every continent except Australia and Antarctica (Lewis et al., 2005). Within its nearly cosmopolitan distribution, Astragalus exhibits particularly rich diversity within two geographic areas. The most diverse of these
areas, home to around 2000 species, and assumed to be the origin of the genus, are the steppes and mountains of southwest and south-central Asia, and the Himalayan plateau (Wojciechowski, 2005). Second only to its likely place of origin in Eurasia, with around 400-450 species, is the intermountain region of western North America (Liston, 1997).
Around 70 species of Astragalus can be found in Idaho (Mancuso, 1999).
Sanderson and Wojciechowski (1996) determined Astragalus to possess a similar diversification rate to closely related taxa (Oxytropis and seventeen other genera in Galegeae were included in the study), yet Astragalus contains many more species than these other genera. Another mechanism must explain the great diversity of Astragalus.
The notable diversity of Astragalus in the intermountain west in particular may be explained by adaptive radiation, a process in which a group of organisms rapidly diversifies into several new species. Among the factors driving adaptive radiation is the sudden availability of new ecological niches (Schluter, 2000). It is possible that upon colonization of North America, Astragalus encountered a lack of competition for niches within environments it was well-suited for, and subsequently underwent an adaptive radiation event, quickly diversifying into several new species.
Among the species of Astragalus in the intermountain west is Astragalus cusickii.
First described by Gray in 1878, A. cusickii is a sparsely leafy, multi-stemmed, perennial forb found in western Idaho, eastern Oregon, and the extreme southeast corner of
Washington. It has small flowers and conspicuous papery inflated pods. It is found mainly on barren, often steep hillsides, ash soils, and talus slopes (Barneby et al., 1989;
Mancuso, 1999). The species comprises four infraspecific taxa, varieties cusickii, flexilipes, sterilis, and packardiae. The inclusion of these four taxa into a single species
was made on the basis of morphological similarity. Astragalus cusickii var. cusickii (fig.
1) has the widest geographic distribution of the four varieties, and is found in western Idaho, eastern Oregon, and southeast Washington, though it is mostly concentrated in areas near Hells canyon (fig. 2). Individuals of A. cusickii var. cusickii are generally the largest in physical size of the varieties. Notably, they possess an approximately even distribution of leaves throughout the length of the stems, in contrast to some of the other varieties (Barneby et al., 1989). The flowers are relatively larger than those of the other varieties. The pods of A. cusickii var. cusickii have a more inflated appearance and are often found in greater abundance after flowering than in the other varieties. Astragalus cusickii var. flexilipes (fig. 3) appears to be only weakly differentiated from A. cusickii var. cusickii by subtle morphological differences: small, purplish flowers, and oblique, half-ellipsoid pods (Barneby et al., 1989). It can be found in the vicinity of the Salmon river (fig. 2). Astragalus cusickii var. sterilis (fig. 4) is one of two rare varieties, found only in a small area in eastern Oregon, near the Owyhee reservoir (fig. 2). This variety is distinguished by its smaller leaflets, and bright red mottling on its pods.
Astragalus cusickii var. packardiae (fig. 5) is the other rare variety. Astragalus cusickii var. packardiae is considered one of the rarest plants in Idaho (Mancuso, 1999).
It was discovered in Idaho in 1980 by James Grimes and Patricia Packard, and then not seen again for seventeen years, until rediscovered by Michael Mancuso in 1997
(Mancuso, 1999). This variety is distinguished by its relative paucity of leaves on the stems, particularly distally. Its flowers are relatively small, and purplish, and its pods are small and narrow. Astragalus cusickii var. packardiae exists only in a small geographic area in Payette County, Idaho (fig. 2), and is of urgent conservation concern due to its
location on public land which is a popular site for recreational off-road vehicle use.
Recent work by Kinter has found that A. cusickii var. packardiae is highly dependent on pollination by native Osmia species, which are also susceptible to ground disturbances (L. Kinter, unpublished). Because of these conservation concerns, A. cusickii var.
packardiae is the primary focus of this study.
Astragalus cusickii var. packardiae exists almost entirely on a visually distinct soil type which is in sharp contrast to the surrounding areas. Small exposures of this whitish substrate dot the landscape, especially on steep slopes. These exposures are sparsely covered in vegetation. Given the abrupt change in vegetation and visually distinct nature of these exposures, it is reasonable to assume that biologically significant differences exist in the edaphic properties of the exposures versus the surrounding landscape. Unique edaphic conditions often determine the narrow distribution of rare endemic plants (Kruckeberg and Rabinowitz, 1985). It is important when considering the taxonomic organization of A. cusickii to consider the possibility that the morphological variation observed between the different varieties may be phenotypic plasticity in
response to different edaphic conditions. It is possible that the four varieties of A. cusickii represent a single meta-population, with gene flow across the entire distribution, in which individual populations exhibit observable phenotypic variation in response to the
particular type of soil they are found on. Given their geographic proximity and
morphological similarity to the other varieties of A. cusickii, as well as the tendency of plants to exhibit strong physiological responses to different environments (Gurevitch et al., 2002), it is possible that the distinct morphological characters apparent in A. cusickii vars. packardiae and sterilis are the result of their environments.
Environmental factors were found to likely be the cause of phenotypic variation between two varieties of Eriogonum shockleyi (Smith and Bateman, 2002). Populations of each variety were found to often contain at least one individual which would qualify as belonging to the other variety based on their diagnostic characters. Molecular analysis did not support the taxonomic arrangement of the two varieties, making it likely that the observed variation is the result of phenotypic plasticity.
Research Approach
There are multiple potential strategies for determining the source of phenotypic variation between the varieties of Astragalus cusickii. One approach would be to observe the phenotypic response of individual A. cusickii after being transplanted to different soil types in a common garden experiment (Clausen et al., 1948; Núñez-Farfán and
Schlichting, 2001). While this method would directly address whether or not environmental conditions were responsible for the observed phenotypic variation
between varieties, it would also present some challenges regarding the focus taxon of this study. In 1999, it was estimated that there were approximately 3500-4500 individual A.
cusickii var. packardiae in total (Mancuso, 1999). Populations of the variety are the focus of conservation efforts due to their location which makes them vulnerable to various disturbances. It is therefore important that any study of A. cusickii var. packardiae harm as few individuals as possible.
If the phenotypic variation between varieties of Astragalus cusickii is solely the result of phenotypic plasticity in response to different environmental conditions, it would be reasonable to expect some level of gene flow between varieties. A phylogenetic analysis could determine the degree of genetic isolation and/or gene flow among the
varieties of A. cusickii, for the cost of only a few small leaf tissue samples, an advantage when studying rare taxa. We propose to resolve the species boundaries within and surrounding the four varieties of A. cusickii using molecular phylogenetic techniques, to be evaluated using the criteria of the phylogenetic species concept – monophyly with diagnosable differences – within a larger understanding of species as separately evolving meta-population lineages, as described in the unified species concept. An advantage of using monophyly with diagnosable differences as the a priori standard for determining species status is that, among the various other criteria included under the umbrella of the unified species concept, it most directly attempts to elucidate the historical genealogical relationships among taxa. This is obviously of particular interest to the field of
systematics. Recent studies of species in Astragalus using similar methods add further support to the rationale to proceed with monophyly with diagnosable differences between populations as the criteria for recognizing species (Riahi et al., 2011; Scherson et al., 2005; Wojciechowski, 2005). For the varieties of A. cusickii, establishing monophyly would implicitly lead to recognition as species, as the morphology of these taxa have been thoroughly studied and described, and diagnosable differences already established (Barneby et al., 1989; Mancuso, 1999). If A. cusickii var. packardiae is found to not represent an independent evolutionary lineage, but is instead simply the phenotypic result of the much more common A. cusickii growing in a distinct soil type, then the urgency of protecting populations of A. cusickii var. packardiae diminishes considerably. If,
however, A. cusickii var. packardiae is found to represent a distinct evolutionary lineage, it would merit recognition as a species under the phylogenetic species concept. The case for conservation would therefore be bolstered.
MATERIALS AND METHODS Collection and DNA Extraction
Sequences included in this study originated from GenBank and DNA extracted from field-collected individuals (Appendix A). Field-collected individuals were gathered from southwestern Idaho and eastern Oregon (fig. 2). Leaf material was collected from 20 individuals from five populations of Astragalus cusickii var. packardiae, nine individuals from three populations of A. cusickii var. sterilis, twelve individuals from four populations of A. cusickii var. cusickii, and nine individuals from three populations of A. cusickii var. flexilipes. In addition to the four varieties of A. cusickii, seven
additional species of Astragalus were collected and included in the study on the basis of similar leaf and/or fruit morphology to A. cusickii. These seven species are: A. whitneyi var. confusus, A. solitarius, A. lentiginosus, A. filipes, A. mulfordiae, A. yoder-williamsii, and A. ceramicus. Astragalus purshii, which does not exhibit similar leaf and/or fruit morphology to A. cusickii, was also included in the study. Leaf material was preserved in silica gel. DNA was extracted from frozen and pulverized leaf tissue with Qiagen
DNeasy plant mini kits (Valencia, CA) according to manufacturer’s instructions.
PCR and Investigation of Gene Regions
Fifteen gene regions were chosen for investigation based on success in previous molecular systematics studies and their potential utility for species-level resolution (table 1). Low-copy nuclear, nuclear ribosomal, and chloroplast gene regions were targeted to include a broad survey of the genome, a necessary approach due to a lack of species-level
resolution in previous studies (Riahi et al., 2011; Scherson et al., 2005; Wojciechowski, 2005).
Four regions have been used in previous phylogenetic analyses of Astragalus.
The internal transcribed spacer (ITS) region was investigated using the C26A and NC18s10 primers (Wen and Zimmer, 1996). The utility of ITS for systematic studies of plants was recognized by Baldwin (1992) and has been important in phylogenetic studies at the species level in many groups, including: Rosaceae (Lee and Wen, 2001),
Betulaceae (Whitcher and Wen, 2001), Rutaceae (Navarro et al., 2004), Apiaceae (Spalik and Downie, 2006, 2007; Zhou et al., 2009; Carlson et al., 2011), Lamiaceae (Oliveira et al., 2007), Piperaceae (Smith et al., 2008; Jaramillo et al., 2008), Crassulaceae (Carillo- Reyes et al., 2008), Saxifragaceae (Xiang et al., 2012), Gesneriaceae (Smith et al., 2013), and Papaveraceae (Pérez-Gutiérrez et al., 2015). The external transcribed spacer (ETS) region was initially developed for phylogenetic analyses by Baldwin and Markos (1998) and investigated here using the primers developed by Riahi et al. (2011) who used them in Astragalus. The cyclic nucleotide-gated channel 4 (CNGC4) protein-coding gene was developed by Choi et al. (2004, 2006) and its utility phylogenetic studies of Astragalus was demonstrated by Scherson et al. (2005). Scherson et al. (2005) used this low copy nuclear gene in a phylogenetic analysis of Astragalus and it has also been used in the Fabaceae tribe Amorpheae (McMahon, 2005). The trnS-G gene region was developed by Shaw et al. (2005). Riahi et al. (2011) successfully used this chloroplast spacer in a phylogenetic analysis of Astragalus, and it has been used in studies of other taxa in Fabaceae (Zhang et al., 2009). Therefore these four regions were included in this investigation.
Unfortunately, resolution and support has been poor using the four previously mentioned regions, albeit all four have not been used in concert prior to this study.
Therefore additional regions that have been used at the species level in phylogenetic analyses were also investigated. An additional four chloroplast regions were sampled.
The trnD-T spacer (Demesure et al., 1995) had also been used in phylogenetic studies of Astragalus (Scherson et al., 2008) although the level of variation was low. The psbA-trnH spacer (Shaw et al., 2005) has also been used in phylogenetic studies of Astragalus in several studies (Zippel and Wilhalm, 2009; Javanmardi et al., 2012; Bartha et al., 2013;
Dastpak et al., 2013), and was thought to be an important locus to include. The matK gene (Sang et al., 1997) had also been used in phylogenetic analyses of Astragalus (Wojciechowski, 2005; Javanmardi et al., 2012), and in other taxa of Fabaceae (Miller and Bayer, 2001, 2003; Miller et al., 2003). The chloroplast encoded, nuclear expressed glutamine synthetase gene (Emshwiller and Doyle, 1999) had not been used previously in Astragalus, but part of this region has been used in phylogenetic studies of Gesneriaceae (Smith et al., 2004; Perret et al., 2003) and was thought to be potentially useful for this project.
The remaining seven regions were all low copy nuclear genes. The chalcone synthase, calmodulin, and glyceraldehyde phosphate dehydrogenase genes (Strand et al.
1997) have been used in several studies at the species level including: Brassicaeae (Koch et al., 2000), animals (Duda et al., 2001), fungi (O’Donnell et al., 2000; Wang and Zhuang, 2007; Romeo et al., 2011), and Piperaceae (Smith et al., 2008). The granule- bound starch synthase (waxy) gene was investigated using primers developed by Mason- Gamer (2001) and has been used in phylogenetic studies including Solanaceae and
Orobanchaceae (Peralta and Spooner, 2001; Tank and Olmstead, 2009). Sequences of phosphoenolpyruvate carboxylase (PEPC; Malcomber 2002) have had less use in phylogenetic analyses (Gehrig et al., 2001; Lohmann, 2006; Mason-Gamer et al, 2010), but preliminary data from other studies have shown considerable variation for this region (J. F. Smith, pers. comm.). The ARG-10 and FENR genes Choi et al. (2004) was partly investigated in Astragalus by Scherson et al. (2005) although they detected what appeared to be multiple copies of these two regions and recommended that cloning explore the potential for paralogs.
DNA was amplified by polymerase chain-reaction (PCR) using the methods of Smith et al. (1997). Sequences were obtained from Genewiz (South Plainfield, NJ).
Examination of direct sequencing products of FENR and ARG-10 showed multiple peaks in their chromatograms, indicating that the primers might be amplifying multiple
paralogs. To isolate orthologous genes, molecular cloning was used. Cloning was conducted with the pGEM-T vector kit from Promega (Madison, WI). Cells were plated onto luria broth agar plates. Agar plates contained 100 mg/ml ampicillin and were treated with 5-bromo-4-chloro-3-indolyl-β-D-galactopyranoside (x-gal) and isopropyl β-D-1- thiogalactopyranoside (IPTG). For both genes, cloning was employed using five
individuals: Astragalus cusickii var. packardiae JZ-002, A. cusickii var. sterilis JZ-015, A. solitarius JZ-021, A. lentiginosus JZ-036, and A. whitneyi var. confusus JZ-061. Plates were incubated overnight at 37°C. White colonies were used as templates for subsequent PCR amplification for each gene region. For FENR, DNA from a total of 35 colonies among the five individuals was sequenced. For ARG-10, DNA from a total of 50 colonies among the five individuals was sequenced.
Matrix Assembly
Sequence data from all individuals of Astragalus cusickii var. packardiae were included in the analysis, as this taxon is the focus of the study. Field-collected individuals from the other varieties of A. cusickii and other species of Astragalus were represented by a single individual from each population from which they were gathered. GenBank sequence data from seventeen more Astragalus species from western North America were added to supplement the collected individuals: A. allochrous, A. arizonicus, A.
asymmetricus, A. asclepiadoides, A. brandegeei, A. calycosus, A. douglasii, A. falcatus, A. inyoensis, A. lonchocarpus, A. mollissimus, A. nothoxys, A. oxyphysus, A. pachypus, A.
preussii, A. tetrapterus, and A. woodruffii (Appendix A). To attempt to place A. cusickii and the other western North American Astragalus species in a larger phylogenetic context, GenBank sequences from species occurring in other geographic areas were added. These include four Astragalus species native to North America, but which are not exclusively found in the west: A. adsurgens, A. alpinus, A. americanus, and A.
canadensis, (Appendix A). Seventeen Astragalus species native to South America were included: A. arnottianus, A. amatus, A. berteroanus, A. cruckshanksii, A. cryptobotrys, A.
curvicaulis, A. cysticalyx, A. darumbium, A. edmonstonei, A. johnstonii, A. looseri, A.
monticola, A. nivicola, A. patagonicus, A. pehuenches, A. uniflorus, and A. vagus (Appendix A). Seven old world Astragalus species were included: A. atropilosulus, A.
cerasocrenus, A. complanatus, A. corrugatus, A. epiglottis, A. peristereus, and A. vogelii.
Oxytropis sericea was included as the out-group (Scherson et al., 2005).
Sequence data were manually aligned and edited for quality using PhyDE (Müller at al., 2010). There was a 30 base pair reverse complement of a section of trnS-G in some
individuals. The sequence was manually reversed for the individuals that had the
minority version, to match the majority. The presence of the majority or minority version of this sequence was coded as a single character state appended to the sequence data for each individual in the maximum parsimony (MP) analyses.
Sequence data were not available for all individuals and all gene regions. Three concatenated super-gene matrices were assembled to determine the extent to which the missing data would affect phylogenetic analyses. A preliminary maximum parsimony analysis of individual gene regions was undertaken prior to concatenation. An
incongruence was detected in the placement of three individuals of A. cusickii var.
packardiae (JZ-052, JZ-053, and JZ-054) (figs. 6, 7). These individuals were removed from all gene matrices. Matrix 1 contained all available data for all remaining taxa.
Matrix 1 included Oxytropis sericea as the out-group. Matrix 2 contained individuals for which sequence data from at least two gene regions were available. Matrix 2 also
included Oxytropis sericea as the out-group. Matrix 3 contained only individuals for which sequence data was available for ITS, ETS, CNGC4, and trnS-G. Consequently, matrix 3 does not contain any sequences from GenBank, including the out-group Oxytropis sericea, as sequence data from GenBank was only available for, at most, two of the gene regions examined. For this reason, matrix 3 used Astragalus purshii as the out-group in place of Oxytropis sericea, based on the phylogenetic position of A. purshii in preliminary analysis of all data.
Phylogenetic Analyses
Simple indel coding was conducted with the SeqState plug-in for PhyDE.
Maximum parsimony analysis was conducted on all three matrices both with and without
indel coding, using TNT version 1.1 (Goloboff et al., 2008). Default settings were used unless otherwise specified. A strict consensus tree was generated with TNT. Branch support values for the strict consensus tree were found with bootstrapping (Felsenstein, 1985) for 10,000 replicates using a tree bisection reconnection swapping algorithm.
Branch arrangements were considered significant for bootstrap values ≥ 75. Matrix 1 was chosen as the dataset to proceed with all subsequent analyses (see results).
Maximum likelihood (ML) was tested using RAxML-HPC2 (Stamatakis, 2014) on XSEDE on the Cipres Science Gateway (Miller et al., 2010). Oxytropis sericea was specified as the outgroup. One hundred bootstrap iterations were used. Branch
arrangements were considered significant where bootstrap values ≥ 75. The GTRCAT model was used. The dataset was not partitioned. FigTree v. 1.4.2 (Rambaut, 2006) was used to visualize the best tree with bootstrap values.
Prior to the Bayesian inference (BI) analysis, appropriate partitions were found using PartitionFinder (Lanfear et al., 2012). Nucleotide substitution models for each partition were found using jModelTest 2.1 (Darriba et al., 2012). Bayesian inference was tested using MrBayes 3.2.3 (Altekar et al., 2004; Huelsenbeck and Ronquist, 2001;
Ronquist and Huelsenbeck, 2003) on XSEDE on the Cipres Science Gateway (Miller et al., 2010). Two independent analyses were conducted using four Metropolis-coupled Markov chains (MCMC) (Geyer, 1991; Hastings, 1970; Metropolis et al., 1953) each for ten million generations. Burn-in was set at 50,000 generations. Metropolis-coupled Markov chain analysis completion was tested with AWTY (Nylander et al., 2007) and Tracer v. 1.6 (Rambaut et al., 2014). FigTree v. 1.4.2 (Rambaut, 2006) was used to
visualize the majority-rule consensus tree with branch posterior probabilities. Branch arrangements were considered significant where posterior probability values ≥ 0.95.
Testing Alternative Topologies
The phylogenetic analyses did not recover the four varieties of Astragalus cusickii as a single monophyletic group. To further investigate the potential that they represent a monophyletic group, an approximately unbiased (AU) test (Shimodaira, 2002) of the four varieties of A. cusickii was performed with CONSEL (Shimodaira and Hasegawa, 2001).
Two additional AU tests were conducted to investigate the relative power of the AU test as applied to Astragalus at the species level. In these additional tests the four varieties of A. cusickii were specified as belonging to a monophyletic group with a morphologically similar species (A. whitneyi var. confusus) and, separately, with a much less
morphologically similar species (A. solitarius). Site likelihoods generated in PAUP* were input into CONSEL. The significance level was designated α = 0.05 (Lang et al., 2002;
Dantrakool et al., 2004; Shannon et al., 2005; Gill and Fast, 2006; Heiss and Keeling 2006; Struck et al., 2007; Ernst et al., 2008; Helmkampf et al., 2008; Kuo et al., 2008; Yu et al., 2008; Gao et al., 2009; Ishiwata et al., 2011; Zhang et al., 2011).
The genealogical sorting index (GSI) (Cummings et al., 2007) was used to further investigate the possibility of a monophyletic Astragalus cusickii. A file containing the last 100 trees (the maximum number allowed by the GSI software) generated in the BI analysis, as well as text files used to specify monophyletic constraints among taxa, were used as the inputs. The significance level was designated at α = 0.05 (Koopman and Baum, 2010; Kubatko et al., 2011; Keith and Hedin, 2012; Levsen et al., 2012).
The following monophyletic arrangements were defined and tested against the BI data using the GSI (table 2): 1. each variety of Astragalus cusickii as independent
monophyletic groups, 2. all four varieties of A. cusickii as a single monophyletic group, 3. A. cusickii as three separate monophyletic groups: A. cusickii var. packardiae, A.
cusickii var. sterilis, and a combined group containing A. cusickii vars. cusickii and flexilipes, 4. all four varieties of A. cusickii combined with A. whitneyi var. confusus as a monophyletic group, and 5. all four varieties of A. cusickii combined with A. solitarius as a monophyletic group. The rationale for combining A. cusickii vars. cusickii and flexilipes was based on the results of the phylogenetic analyses and their status as weakly
differentiated varieties (Barneby, 1989). Astragalus whitneyi, a morphologically similar species to A. cusickii, and A. solitarius, a less morphologically similar species to A.
cusickii, were included in separate analyses as a test of the relative power of the GSI as applied to Astragalus at the species level.
Multispecies Coalescent
Species trees were estimated from sequence data from individuals belonging to species for which more than one individual was included in the study, and for which sequence data was available for ITS, ETS, CNGC4, and trnS-G, using the multispecies coalescent (Kingman, 1982, 2000; Hudson, 1991; Knowles and Carstens, 2007; Degnan and Rosenberg, 2009; Heled and Drummond, 2010; Carstens et al., 2013). The *BEAST template (Drummand et al., 2012) was used in BEAUti v. 2 to prepare the data file for multispecies coalescent analysis in BEAST v. 2.1.3 (Bouckaert et al., 2014). Separate nexus files for each partition suggested by PartitionFinder were used as inputs for
*BEAST. Models were unlinked among partitions. Two independent analyses using each
of the four available substitution models (JC69, HKY, TN93, GTR), separately using a strict clock or a relaxed log normal clock were conducted for 100 million generations each, for a total of sixteen analyses. All other parameters were left at default settings.
Additionally, two independent analyses using substitution model JC69 with a strict clock were conducted for one billion generations each. Tracer v. 1.6.0 (Rambaut et al., 2014) was used to gauge MCMC convergence. TreeAnnotator v. 2.1.2 (Rambaut and
Drummond, 2002), an application in *BEAST, was used to generate target trees for each analysis under the maximum clade credibility criterion. FigTree v. 1.4.2 (Rambaut, 2006) was used to visualize the trees generated by TreeAnnotator. *BEAST results were
considered supported at posterior probability > 0.95 (Niemiller et al., 2012; Perez et al., 2012; Kearns et al., 2013; Satler et al., 2013).
RESULTS
Amplification, Sequencing, and Alignment
The internal transcribed spacer (ITS) gene region was successfully amplified and sequenced for all individuals from which DNA was extracted (table 1; Appendix A). The ITS sequences were available for all 46 individuals accessed from GenBank. An average proportion of nucleotide differences between individuals (pairwise distance) of 0.034 was calculated. The level of variation found among ITS sequences was sufficient to generate informative topology from the maximum parsimony analysis (fig. 6), including BS support of 85 for a monophyletic Astragalus cusickii var. packardiae.
The trnS-G chloroplast gene region was successfully amplified and sequenced for all individuals from which DNA was extracted (table 1; Appendix A). No trnS-G
sequences were available for taxa accessed from GenBank. An average pairwise distance of 0.006 was calculated. The level of variation found among trnS-G sequences was sufficient to generate informative topology from the maximum parsimony analysis (fig.
7), including BS support of 91 for a monophyletic Astragalus cusickii var. sterilis. A bootstrap-supported incongruence was found between the trnS-G (plastid) gene tree (fig.
7) and the ITS gene tree (fig. 6). The incongruence occurred in the placement of
individuals from one population of A. cusickii var. packardiae (JZ-052, JZ-053, and JZ- 054) in a clade containing an individual of A. filipes (DM 13-005) with branch support of 87 (fig. 7).
The external transcribed spacer (ETS) gene region was successfully amplified and sequenced for 53% of individuals from which DNA was extracted (table 1; Appendix A).
No ETS sequences were available from GenBank for the additional taxa included. An average pairwise distance of 0.015 was calculated. The cyclic nucleotide-gated channel 4 (CNGC4) gene was successfully amplified and sequenced for 98% of the individuals from which DNA was extracted (table 1; Appendix A). Cyclic nucleotide-gated channel 4 sequences were available from GenBank for 26% of individuals accessed from GenBank.
An average pairwise distance of 0.014 was calculated.
The trnD-T and matK gene regions were successfully amplified and sequenced for 53% and 84% of individuals from which DNA was extracted, respectively. Sequence alignment for both regions showed negligible variation between taxa. Two gene regions, FENR and ARG10, showed evidence of multiple paralogs, which were explored through cloning. After cloning, seven paralogs were detected for FENR, and eight for ARG10, within a single individual of Astragalus solitarius (JZ-021), with similar numbers of paralogs found among other individuals. As a result, sequence variation for FENR and ARG10 was greater between paralogs than between taxa. For this reason, these gene regions were not included. Amplification was not successful for the remaining seven gene regions (table 1).
Phylogenetic Analyses
Maximum parsimony analysis of matrix 1 (fig. 8), containing sequence data from 89 individuals, resulted in 30 equally most-parsimonious trees (L = 689, CI = 0.805, RI = 0.869). There was strong support for a monophyletic Astragalus cusickii var. packardiae (BS = 95) and a monophyletic A. cusickii var. sterilis (BS = 84). Astragalus cusickii var.
cusickii and A. cusickii var. flexilipes did not resolve as reciprocally monophyletic, and instead formed a combined clade lacking bootstrap support.
Maximum parsimony analysis of matrix 2 (fig. 9), containing sequence data from 55 individuals, resulted in 20 equally most-parsimonious trees (L = 419, CI = 0.886, RI = 0.929). In general, the results are similar to those found in the analysis of matrix 1: strong bootstrap support for a monophyletic A. cusickii var. packardiae (BS = 97) and a
monophyletic A. cusickii var. sterilis (BS = 96), as well as an unsupported combined clade including A. cusickii var. cusickii and A. cusickii var. flexilipes.
Maximum parsimony analysis of matrix 3 (fig. 10), containing sequence data from 24 individuals, resulted in a single most-parsimonious tree (L = 154, CI = 0.883, RI
= 0.941). Matrix 3 showed high bootstrap support for the reciprocal monophyly of three of the varieties of Astragalus cusickii: A. cusickii var. packardiae (BS = 100), A. cusickii var. sterilis (BS = 99), and A. cusickii var. cusickii (BS = 92). One variety, A. cusickii var.
flexilipes, was not included in matrix 3 as sequence data were not available for all gene regions.
Comparison of the three matrices shows a trend toward less support as additional taxa lacking sequence data from one or more gene region are added. The proportion of supported nodes is highest in matrix 3 (73%) and drops with additional taxa in matrices 2 and 1 (30% and 29%, respectively) (fig. 8, 9, 10). Matrix 1 was chosen as the data set for use in all subsequent analyses, because although it has the lowest proportion of supported nodes, it included the most taxa, thereby maximizing the phylogenetic space available to resolve relationships within A. cusickii.
The results from the ML analysis were in agreement with the results from the MP analysis (fig. 11). Astragalus cusickii var. packardiae and A. cusickii var. sterilis each received significant bootstrap support as reciprocally monophyletic groups (96 and 100, respectively). Astragalus cusickii var. cusickii and A. cusickii var. flexilipes form an unsupported combined clade. Branch support for many of the clades was greater in the ML analysis, in contrast to the MP analysis, though in most cases still below the level of significance of 75.
PartitionFinder indicated that each of the four gene regions should be partitioned, as well as each codon position in CNGC4 (a protein-coding gene region), for a total of six partitions. Each partition was assigned a unique model by jModelTest, with the exception of CNGC4 codon positions one and two, which were assigned the same model (table 3).
The MCMC trace plot did not have an apparent vertical trend (fig. 12), suggesting MCMC completion. A joint-marginal plot of two independent BI analyses (fig. 13) is consistent with MCMC convergence. Metropolis-coupled Markov chain completion was supported by AWTY (fig. 14). The first of the independent analyses had a posterior mean of -5520.91, and a posterior effective sample size (ESS) of 3373. The second independent analysis had a posterior mean of -5520.74, and a posterior ESS of 3015. The BI analysis produced results in agreement with the MP and ML analyses (fig. 11). Astragalus cusickii var. packardiae and A. cusickii var. sterilis each received strong posterior probabilities (1.00 and 1.00, respectively) as comprising reciprocally monophyletic groups. Astragalus cusickii var. cusickii and A. cusickii var. flexilipes form a combined clade with PP = 0.922. In general, branch support for many of the clades was greatest in the BI analysis of the three phylogenetic analyses employed.
Tests of Alternative Topologies
The AU test could not reject the possibility of a monophyletic Astragalus cusickii containing all varieties (p = 0.911). The AU test (table 4) also failed to reject the
possibility of a monophyletic combination of A. cusickii and A. whitneyi var. confusus (p
= 0.746), but did reject a monophyletic combination of A. cusickii and A. solitarius (p = 0.005).
The GSI supported separately monophyletic Astragalus cusickii var. packardiae and A. cusickii var. sterilis (table 2). Both taxa received the maximum score of 1.00 from the GSI when each was constrained to be monophyletic, indicating complete lineage sorting had occurred. Astragalus cusickii var. cusickii and A. cusickii var. flexilipes were supported as comprising a single clade in the results of the GSI (score of 0.989). When evaluated separately, A. cusickii var. cusickii received a GSI score of 0.796, and A.
cusickii var. flexilipes received a score of 0.442. Evaluated as a single group, the four varieties of A. cusickii received a GSI score of 0.874. Including A. whitneyi var. confusus returned a GSI score of 0.874, including A. solitarius with the varieties of A. cusickii returned a GSI score of 0.839.
Multispecies Coalescent
Results from all multispecies coalescent analyses produced species trees with identical topology, though with different posterior probabilities. The multispecies coalescent did not support Astragalus cusickii as monophyletic (fig. 15). In the analysis ran for one billion generations Astragalus cusickii var. cusickii and A. cusickii var. sterilis were grouped into an unsupported clade sister to a supported clade (PP = 1.00) containing A. purshii and A. lentiginosus. Astragalus cusickii var. packardiae was placed as the
outgroup to the other taxa, though this arrangement was without support. Effective sample sizes for all analyses are reported in table 5. Joint-marginal distributions indicate a lack of convergence between parallel analyses (fig. 16).
DISCUSSION
In general, the results of all three phylogenetic methods produced similar to identical results which were also reflected with the MP analyses of data matrices with reduced taxon sampling, but complete sequence data for all sampled individuals (figs. 8- 11). The results provide strong support for some clades, typically clusters of individuals where more than a single individual was sampled, but poor support for relationships among species. Phenotypic variation found in Astragalus cusickii vars. packardiae and sterilis in relation to the other varieties of A. cusickii appears to be genetically
determined. The MP, ML, and BI analyses each strongly support a monophyletic A.
cusickii var. packardiae, and a monophyletic A. cusickii var. sterilis (fig. 11). A clade exclusively containing all individuals of A. cusickii var. packardiae received the
maximum possible posterior probability of 1.000 in the BI analysis, and similarly robust support in the other phylogenetic analyses (fig. 11). The clade containing A. cusickii var.
sterilis was similarly well-supported, receiving a posterior probability of 1.000 in the BI analysis, and 100 in the ML analysis (fig. 11). Such clearly defined clades are likely the result of long-term isolation, resulting in the accumulation of unique genetic mutations.
Phenotypic plasticity is a possible explanation for the subtle phenotypic variation between Astragalus cusickii vars. cusickii and flexilipes. These two varieties exist in overlapping territory (fig. 2), and are considered weakly differentiated (Barneby et al., 1989). Neither variety resolved as monophyletic in the phylogenetic analyses. Astragalus
cusickii vars. cusickii and flexilipes formed a combined, though unsupported, monophyletic clade in each phylogenetic analysis (fig. 11).
Tests of Alternative Topologies
The phylogenetic analyses did not support a monophyletic Astragalus cusickii containing all varieties, but also did not preclude such a group. Alternative tests of topology were employed in an attempt to recover relationships, which may have been missed by the traditional analyses. The approximately unbiased (AU) test (Shimodaira, 2002) calculates a p-value for a user-defined monophyletic group given a particular dataset. The AU has been used in a broad range of phylogenetic studies, including taxa such as protists (Lang et al., 2002; Kuo et al., 2008), rats (Dantrakool et al., 2004), nematodes (Shannon et al., 2005), leeches (Trontelj and Utevsky, 2005), octocorals (Wirshing et al., 2005), flagellates (Heiss and Keeling, 2006), fish (Steinke et al., 2006;
He and Chen, 2006; Willis et al., 2012), fungi (Gill and Fast, 2006; James et al., 2006), annelids (Struck et al., 2007), frogs (Ernst et al., 2008; Yu et al., 2008), plankton (Helmkampf et al., 2008), algae (Hall et al., 2008; Rindi et al., 2009; Pröschold et al., 2010), ciliates (Gao et al., 2009; Zhang et al., 2011), rosids (Wang et al., 2009), metazoans (Witek et al., 2009), crocodiles (Oaks 2011), and insects (Ishiwata et al., 2011).
The AU test failed to reject a monophyletic Astragalus cusickii (table 4). While the AU test could not reject a monophyletic A. cusickii, it also could not reject a
monophyletic group containing both A. cusickii and A. whitneyi var. confusus (table 4).
One interpretation of these data is that A. cusickii could be redefined to include A.
whitneyi var. confusus, and potentially other taxa within the polytomy containing A.