optimum use of fertilizers containing sulphur improves utilisation of nutrients, especially ni-trogen. Favourable influence of sulphur on nitro-gen metabolism and mutual interactions between those two elements were reported by Fismes et al. (2000).
Currently, there is a growing interest in sulphur applied for agricultural purposes, especially in rural areas distant from industrial centres or large cities, where crops can exhibit symptoms of sulphur deficiency. other reasons why sulphur is drawing more attention include progressing reduction in sulphur emission to the atmosphere and low con-centration of this element in agricultural fertilizers (Zhao et al. 1996, Blake-Kalff et al. 2003, McGrath et al. 2003, Walker and Dawson 2003). Sulphur de-ficit in Europe becomes evident not only in crops demanding high sulphur but has already become a problem for farmers growing cereals (Schung et al. 1993, Zhao et al. 1999, Scherer 2001).
the purpose of the present study has been to determine the effect of fertilization with increasing rates of sulphur applied in the form of sulphates and as elementary sulphur on the content of sulphur, nitrogen, phosphorus and potassium in plants as well as on crop yields.
MATERIAL AND METHODS
a three-year field experiment was conducted from 2000 to 2002 in north-East Poland.
the trial was set up on Dystric Cambisols (Fao), of the granulometric composition of heavy loamy sand.
the permanent experiment was established in a random block design and consisted of eight fertilisation objects with four replications: (1) 0, (2) nPK, (3) nPK + S1-So4, (4) nPK + S2-So4, (5) nPK + S3-So4, (6) nPK + S1-S0, (7) nPK +
S2-S0, (8) nPK + S
3-S0. the annual rates of sulphate
sulphur (S-So4) and elementary sulphur (S-S0)
were: S1 – 40, S2 – 80 and S3 – 120 kg/ha.
the nPK rates depended on the crop species and soil fertility (Skwierawska et al. 2008).
the test plants chosen to investigate the effect of rates and forms of sulphur on soil properties and availability of nutrients were plants with high demand for sulphur: head cabbage (Brassica olera-cea var. capitata alba), the medium-late cultivar Glory of Enhuizen, common onion (Allium cepa
var. cepa), cultivar Wolska, as well as one plant with low demand for sulphur: spring barley (Hordeum sativa var. nutans) cultivar rodion. We analyzed
The effect of different rates and forms of applied sulphur
on nutrient composition of planted crops
M. Skwierawska, L. Zawartka, B. Zawadzki
University of Warmia and Mazury in Olsztyn, Olsztyn, Poland
ABSTRACT
a three-year field experiment was conducted from 2000 to 2002 in north-East Poland. Each year three sulphur fertilization rates in the form of sulphate (S-So42–) and pure sulphur (S-S0) were applied: 40, 80 and 120 kg/ha. The
most beneficial effect on the yields of cabbage, onion and barley was produced by the rates of 40 and 80 kg S/ha, while the dose of 120 kg S/ha (especially when applied as S-So42–) reduced the yields of these crops. increasing rates
of sulphur used as a fertilizer caused increased concentration of sulphates in plants up to their luxury accumula-tion. irrespective of the test crop species or form of sulphur applied, once the crops terminated their vegetative season, the plants fertilized with sulphur typically contained more total n than those fertilized only with nPK. The S-So42– fertilization tended to raise the accumulation of n-no
3
– in the crops, especially during the juvenile phase.
The application of 120 kg S-So42–/kg caused depressed amounts of potassium in cabbage, onion and in barley during
the heading phase.
representative parts of plants: heads of cabbage, heads of onion and grain and straw of spring barley. the size of plot was 70 m2, and each plot was divided
into halves (35 m2). Whole plants in the juvenile
phase were collected from one part of a plot, while the other part served for sampling plants in the full maturity phase. Plots for harvesting cabbage measured 21.95 m2, for common onion 23.75 m2
and for spring barley 30.60 m2.
Samples of head cabbage were collected at the phase of head formation (26th June 2000) and at
consumption maturity (5th october 2000);
on-ion was sampled at the phase of onon-ion formaton-ion (17th July 2001) and at full maturity (10th october
2001); samples of spring barley were taken at the heading stage (24th June 2002) and at full
techno-logical maturity (9th august 2002). in the tables
below, the following designations are used: a – ju-venile phase, B – full maturity phase. the yield from each plot was weighed and air-dried to dry matter. Dry matter was determined in the plant samples at the temperatures of 105°C (cabbage, spring barley) and 80°C (onion).
total sulphur was determined in the plant samples by turbidimetry after dry ashing of the plant material with an addition of nitrogen acid and magnesium nitrate to the sulphate form, and sulphate sulphur in ammonium acetate extraction. Plant samples were assayed to determine total n by distillation in the Parnas-Wagner apparatus;
n-no3 was determined by colorimetry using salicylic acid. Plant samples were examined by the vanadium-molybdenum method in order to determine total phosphorus content (Panak 1997), potassium contents were obtained with the atomic emission spectrometry – aES (Szyszko 1986).
Sulphur, nitrogen, phosphorus and potassium uptake by plants was calculated on the basis of an average sulphur, nitrogen, phosphorus, potassium content in plant dry matter as well as an average plant yield from each object. the design of the experiment is presented in tables 1–8.
the results of the yields and chemical analysis of plant were statistically analysed with Statistica 6.0 Pl with two-factor variance analysis anova, for an experiment in random block design, using the form of sulphur as factor a and rate of sulphur as factor b.
RESULTS AND DISCUSSION
Evaluation yield
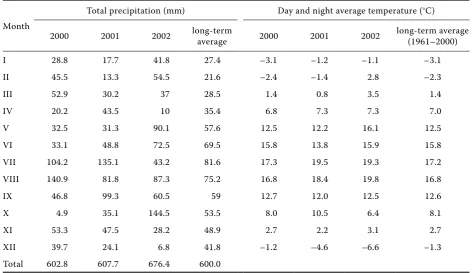
in 2000–2002 weather conditions during plant sowing and early plant development were unfavour-able – the temperatures were higher while the rain-fall lower than the long-term means (table 1).
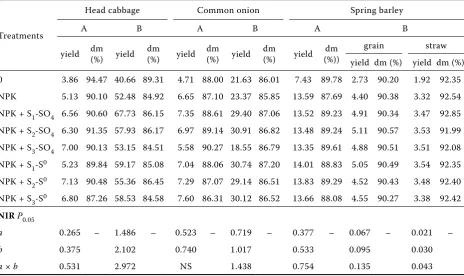
[image:2.595.61.534.489.762.2]all the rates of S-So42– as well as those of 80 and 120 kg S-S0 caused a highly significant increase
table 1. Specification of temperature and precipitation in 2000–2001 according to the UWM in Bałcyny
Month
total precipitation (mm) Day and night average temperature (°C)
2000 2001 2002 long-term average 2000 2001 2002 long-term average (1961–2000)
i 28.8 17.7 41.8 27.4 –3.1 –1.2 –1.1 –3.1
ii 45.5 13.3 54.5 21.6 –2.4 –1.4 2.8 –2.3
iii 52.9 30.2 37 28.5 1.4 0.8 3.5 1.4
iv 20.2 43.5 10 35.4 6.8 7.3 7.3 7.0
v 32.5 31.3 90.1 57.6 12.5 12.2 16.1 12.5
vi 33.1 48.8 72.5 69.5 15.8 13.8 15.9 15.8
vii 104.2 135.1 43.2 81.6 17.3 19.5 19.3 17.2
viii 140.9 81.8 87.3 75.2 16.8 18.4 19.8 16.8
iX 46.8 99.3 60.5 59 12.7 12.0 12.5 12.6
X 4.9 35.1 144.5 53.5 8.0 10.5 6.4 8.1
Xi 53.3 47.5 28.2 48.9 2.7 2.2 3.1 2.7
Xii 39.7 24.1 6.8 41.8 –1.2 –4.6 –6.6 –1.3
in the total yield of cabbage in the juvenile phase compared to the object fertilised with nPK (table 2).
the total yield of mature cabbage in the sul-phur-fertilised objects was higher than in the nPK fertilised and control ones (table 2). as the rate of sulphur increased, the yield-stimulating effect of this element became weaker, with one excep-tion, i.e. the object fertilised with 120 kg S-S0/ha.
However, the triple rate of sulphate sulphur de-pressed the yield. an optimum rate of sulphur for fertilisation of cabbage was 40 kg S-So42–/ha. this finding is confirmed by Hlušek et al. (2002).
Common onion was grown in the second year of the experiment. Sulphur fertilisation, in gen-eral, evoked a clear tendency for onion yield to increase compared to the nPK fertilised object. the triple S-So42– rate was the only exception to this tendency (table 2).
the yield-stimulating influence of sulphur on mature onion turned out to be stronger than that produced by nPK fertilisation alone or deter-mined in the control object. the rate of 120 kg/ha S-So42– was an exception, as it caused a consider-able decrease in the onion yield, which resulted from a yield depression observed as early as in the juvenile phase.
in the third year of the field trials spring barley was grown. Sulphur fertilisation, regardless of the rate and form of the element, did not modify the yield of green biomass relative to the nPK object. the application of sulphur had some small, albeit significant, stimulating effect on the yields of grain and straw of spring barley compared to the nPK fertilised objects. the highest grain yield increase among the sulphate sulphur fertilised objects was obtained when the rate of 80 kg/ha was applied; as for elementary sulphur fertilisation, the high-est grain yield occurred following the application of 40 kg/ha. a similar relationship, although less evident, occurred in the case of straw yields. any further increase of sulphur rates, especially those of elementary sulphur, caused a small decrease in the grain and straw yield compared to the objects receiving lower sulphur rates.
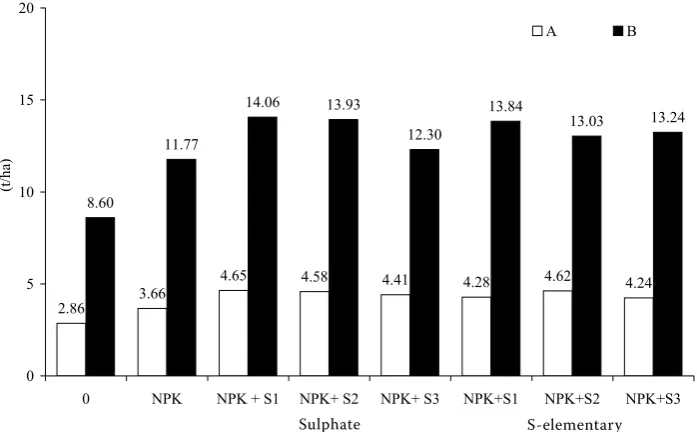
While comparing the total dry matter yields of the crops, obtained in the juvenile phase, it can be concluded that sulphur fertilisation increased the yields compared to the nPK fertilised object (Figure 1). the highest yield was obtained after the application of 40 kg S-So42– and 80 kg SS-So42– or S-S0ha.
the effect of sulphur fertilisation became even more evident when the total yield of dry matter of
table 2. Effect of different rates and forms of sulphur on fresh biomass yields of the crops (t/ha)
treatments
Head cabbage Common onion Spring barley
a B a B a B
yield dm (%) yield dm (%) yield dm (%) yield dm (%) yield (%))dm grain straw yield dm (%) yield dm (%) 0 3.86 94.47 40.66 89.31 4.71 88.00 21.63 86.01 7.43 89.78 2.73 90.20 1.92 92.35 nPK 5.13 90.10 52.48 84.92 6.65 87.10 23.37 85.85 13.59 87.69 4.40 90.38 3.32 92.54 nPK + S1-So4 6.56 90.60 67.73 86.15 7.35 88.61 29.40 87.06 13.52 89.23 4.91 90.34 3.47 92.85 nPK + S2-So4 6.30 91.35 57.93 86.17 6.97 89.14 30.91 86.82 13.48 89.24 5.11 90.57 3.53 91.99 nPK + S3-So4 7.00 90.13 53.15 84.51 5.58 90.27 18.55 86.79 13.35 89.61 4.88 90.51 3.51 92.08 nPK + S1-S0 5.23 89.84 59.17 85.08 7.04 88.06 30.74 87.20 14.01 88.83 5.05 90.49 3.54 92.35
nPK + S2-S0 7.13 90.48 55.36 86.45 7.29 87.07 29.14 86.51 13.83 89.29 4.52 90.43 3.48 92.40
nPK + S3-S0 6.80 87.26 58.53 84.58 7.60 86.31 30.12 86.52 13.66 88.08 4.55 90.27 3.38 92.42 NIR P0.05
a 0.265 – 1.486 – 0.523 – 0.719 – 0.377 – 0.067 – 0.021 –
b 0.375 2.102 0.740 1.017 0.533 0.095 0.030
a × b 0.531 2.972 nS 1.438 0.754 0.135 0.043
mature plants was analysed (Figure 1). Similarly to the juvenile phase, the strongest influence was exerted by the fertilisation treatments with 40 and 80 kg S-So42–/ha. among the objects fertilised with elementary sulphur, such a relationship occurred only when 40 kg S-S0 was applied. in the object
treated with 120 kg S-So42–/ha, the total yield of
the crops was similar to that determined from the nPK fertilised object.
the most beneficial effect on the yields of cab-bage, onion and barley was produced by the rates of 40 and 80 kg S/ha, while the dose of 120 kg S/ha (especially when applied as S-So42–) reduced the
yields of the above crops.
Sulphur
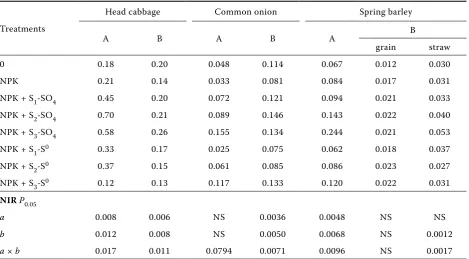
Modifications in the total sulphur concentra-tion in plants (table 3) depended mainly on the content of the sulphate form.
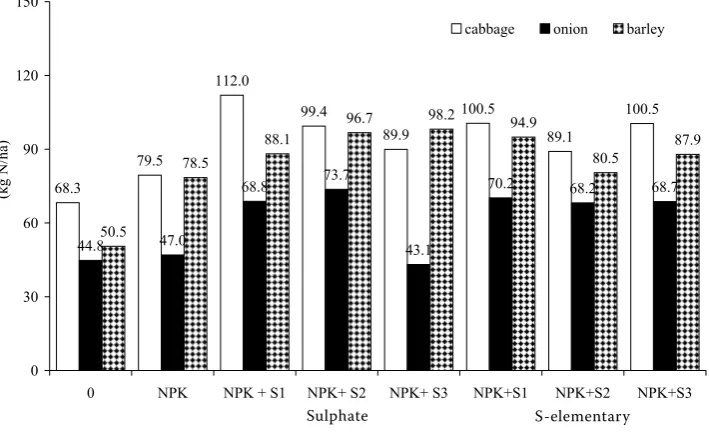
an increase of sulphur rates tended to increase the content of sulphates in plants, especially in the juvenile growth phase and following the ap-plication of S-So42– (table 4). the maximum doses of sulphur caused its luxury uptake, particularly in the second and third year of the experiment. Similar correlations were detected by Sud et al. (1996). During our three-year-long experiment, the nPK + S fertilization, regardless of the growth phase of plants, tended to cause a much higher removal of total sulphur with yields, which would typically be larger as the rates of sulphur used as
a fertilizer increased (Figure 2). at the onset of our experiment, the application of S-So42– con-tributed to a much larger removal of total sulphur with mature plants than in the analogous objects fertilized with S-S0.
as more time elapsed, those differences de-creased. When a triple dose ofS-So42– was applied,
the uptake of sulphur by plants at the consumption maturity phase decreased drastically, which was reflected by the content of S-So42– in soil.
increasing rates of sulphur used as a fertilizer caused increased concentration of sulphates in plants up to their luxury accumulation, and was higher following the application of S-So42– rather than S-S0, particularly during the juvenile phase
of plant growth.
Nitrogen
in cabbage and onion, irrespective of the form of sulphur applied, once the plants terminated their vegetative development, the sulphur fertilized objects tended to contain higher total nitrogen levels than the nPK fertilized ones (table 5). Such correlation did not occur in the early phase of development of these crops. the form and rate of sulphur fertilizers applied did not have unam-biguous influence on the concentration of total nitrogen in barley.
the influence of the rates or forms of sulphur on the n-no3– content in the test crops depended on the plant species and development phase (table 6).
2.86 3.66
4.65 4.58 4.41 4.28 4.62 4.24 8.60
11.77
14.06 13.93
12.30
13.84
13.03 13.24
0 5 10 15 20
0 NPK NPK + S1 NPK+ S2 NPK+ S3 NPK+S1 NPK+S2 NPK+S3
(t/
ha
)
A B
[image:4.595.119.468.62.278.2]Sulphate S-elementary
the S-So42– treatments tended to increase the ac-cumulation of n-no3– in the cabbage, onion and
barley, particularly during the juvenile phase. irrespective of the development phase of head cabbage, common onion and spring barley or the
[image:5.595.65.534.79.337.2]form of sulphur applied for fertilization, the re-moval of total nitrogen with plant yield (Figure 3) depended on the volume of yield (table 2) rath-er than the content of this element in plants (table 5).
table 3. Effect of different sulphur rates and forms on the total sulphur concentration in plants (% dm)
treatments
Head cabbage Common onion Spring barley
a B a B a B
grain straw
0 0.44 0.40 0.32 0.34 0.14 0.09 0.07
nPK 0.54 0.49 0.31 0.28 0.14 0.10 0.11
nPK + S1-So4 0.78 0.52 0.37 0.59 0.21 0.12 0.12
nPK + S2-So4 1.01 0.76 0.48 0.60 0.27 0.11 0.14
nPK + S3-So4 1.09 0.72 0.45 0.62 0.34 0.10 0.11
nPK + S1-S0 0.68 0.40 0.36 0.42 0.16 0.10 0.11
nPK + S2-S0 0.64 0.49 0.48 0.56 0.16 0.13 0.11
nPK + S3-S0 0.64 0.64 0.48 0.63 0.19 0.13 0.11
NIR P0.05
a 0.017 nS 0.010 0.013 0.008 0.007 nS
b 0.024 0.026 0.014 0.018 0.011 0.010 0.006
a × b 0.034 0.037 0.020 0.025 0.015 nS 0.009
a – plants in the juvenile phase, B – plants in the consumption maturity phase; nS – not significant
table 4. Effect of different sulphur rates and forms on the sulphate sulphur concentration in plants (% dm)
treatments
Head cabbage Common onion Spring barley
a B a B a B
grain straw
0 0.18 0.20 0.048 0.114 0.067 0.012 0.030
nPK 0.21 0.14 0.033 0.081 0.084 0.017 0.031
nPK + S1-So4 0.45 0.20 0.072 0.121 0.094 0.021 0.033
nPK + S2-So4 0.70 0.21 0.089 0.146 0.143 0.022 0.040
nPK + S3-So4 0.58 0.26 0.155 0.134 0.244 0.021 0.053
nPK + S1-S0 0.33 0.17 0.025 0.075 0.062 0.018 0.037
nPK + S2-S0 0.37 0.15 0.061 0.085 0.086 0.023 0.027
nPK + S3-S0 0.12 0.13 0.117 0.133 0.120 0.022 0.031
NIR P0.05
a 0.008 0.006 nS 0.0036 0.0048 nS nS
b 0.012 0.008 nS 0.0050 0.0068 nS 0.0012
a × b 0.017 0.011 0.0794 0.0071 0.0096 nS 0.0017
[image:5.595.64.534.482.741.2]regardless of the species of a test crop or a form of sulphur applied, once the crops terminated their vegetative season, the plants fertilized with sulphur typically contained more total n than those fertilized with nPK only.
the effect of rates and forms of sulphur on the content of n-no3– in the test crops depended on a plant species and development phase. the S-So42– fertilization tended to raise the
accumula-Figure 2. Effect of different rates and forms of sulphur on total sulphur uptake by cabbage, onion and barley in the consumption maturity phase
tion of n-no3– in the crops, especially during the juvenile phase.
Phosphorus
When 80 kg S-So42– or 80 and 120 kg S-S0 were
[image:6.595.126.475.62.276.2]used, significant depression in the quantity of phosphorus in cabbage buds compared to those
table 5. Effect of different forms and rates of sulphur on the total nitrogen concentration in the test crops (% dm)
treatments
Head cabbage Common onion Spring barley
a B a B a B
grain straw
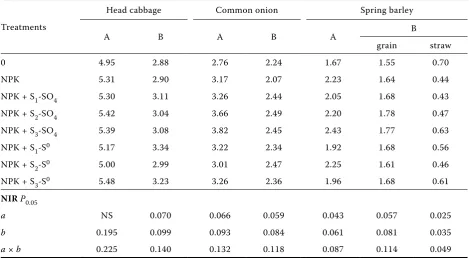
0 4.95 2.88 2.76 2.24 1.67 1.55 0.70
nPK 5.31 2.90 3.17 2.07 2.23 1.64 0.44
nPK + S1-So4 5.30 3.11 3.26 2.44 2.05 1.68 0.43
nPK + S2-So4 5.42 3.04 3.66 2.49 2.20 1.78 0.47
nPK + S3-So4 5.39 3.08 3.82 2.45 2.43 1.77 0.63
nPK + S1-S0 5.17 3.34 3.22 2.34 1.92 1.68 0.56
nPK + S2-S0 5.00 2.99 3.01 2.47 2.25 1.61 0.46
nPK + S3-S0 5.48 3.23 3.26 2.36 1.96 1.68 0.61
NIR P0.05
a nS 0.070 0.066 0.059 0.043 0.057 0.025
b 0.195 0.099 0.093 0.084 0.061 0.081 0.035
a × b 0.225 0.140 0.132 0.118 0.087 0.114 0.049
a – plants in the juvenile phase; B – plants in the consumption maturity phase; nS – not significant 9.5
13.4
18.7
24.8
21.0
12.0
14.6
19.9
6.8 6.4
16.6 17.8
10.9 12.6
15.5
18.3
3.5
7.3
9.2 9.4
7.9 9.2 8.8 8.8
0 5 10 15 20 25 30
0 NPK NPK + S1 NPK+ S2 NPK+ S3 NPK+S1 NPK+S2 NPK+S3
(k
g S
/h
a)
cabbage onion barley
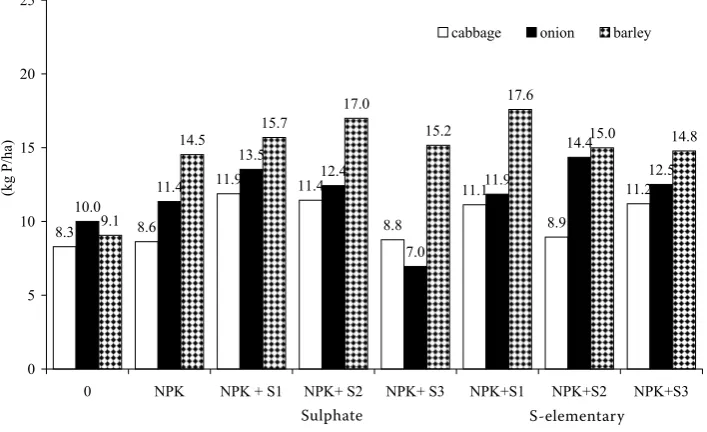
[image:6.595.63.533.484.742.2]from the nPK fertilized object was observed, even though the amount of available phosphorus in soil determined in the former objects increased (Skwierawska et al. 2008).
the content of phosphorus in mature cabbage did not depend to any larger degree on sulphur
fertilization (table 7). Similar results were obtained by Hřivna et al. (2002) in their experiment with winter oilseed rape.
[image:7.595.64.533.92.351.2]the application of sulphur typically increased the uptake of phosphorus by mature cabbage. two fertilization rates, however, were an exception to
table 6. Effect of different rates and form of sulphur on the concentration of nitrate nitrogen in the test crops (% dm)
treatments
Head cabbage Common onion Spring barley
a B a B a B
grain straw
0 0.68 0.28 0.29 0.10 0.30 0.083 0.085
nPK 0.57 0.32 0.43 0.32 0.43 0.080 0.088
nPK + S1-So4 0.86 0.32 0.35 0.39 0.53 0.088 0.107
nPK + S2-So4 0.84 0.33 0.48 0.36 0.42 0.087 0.090
nPK + S3-So4 0.83 0.31 0.47 0.32 0.46 0.045 0.120
nPK + S1-S0 0.68 0.31 0.30 0.38 0.29 0.083 0.085
nPK + S2-S0 0.62 0.32 0.35 0.35 0.46 0.056 0.095
nPK + S3-S0 0.52 0.32 0.36 0.32 0.27 0.045 0.093
NIR P0.05
a 0.022 nS nS 0.011 0.010 0.0032 0.0048
b 0.031 0.022 0.043 0.016 0.013 0.0046 0.0067
a × b 0.044 nS 0.061 0.023 0.018 0.0064 0.0095
a – plants in the juvenile phase; B – plants in the consumption maturity phase; nS – not significant
Figure 3. Effect of different rates and forms of sulphur on total nitrogen uptake by cabbage, onion and barley in the consumption maturity phase
68.3
79.5
112.0
99.4
89.9
100.5
89.1
100.5
44.8 47.0
68.8 73.7
43.1
70.2 68.2 68.7
50.5
78.5
88.1
96.7 98.2 94.9
80.5 87.9
0 30 60 90 120 150
0 NPK NPK + S1 NPK+ S2 NPK+ S3 NPK+S1 NPK+S2 NPK+S3
(kg
N/ha)
cabbage onion barley
[image:7.595.122.477.506.724.2]this rule: 120 kg S-So42–/ha and 80 kg S-S0; it was
due to the low yields obtained from those two experimental objects.
During the bulb formation stage it was only S-S0 that resulted in small, albeit statistically
si-gnificant increase in the content of phosphorus in onion plants (table 7 ). Both the form and rate
of sulphur produced a significant effect on mature onion, which contained less phosphorus than the control, owing to higher yields obtained from the fertilized objects.
[image:8.595.65.533.83.343.2]in both growth stages of onion chosen as indica-tors, increasing rates of S-So42– were observed to be followed by decreasing uptake of phosphorus
table 7. Effect of different rates and forms of sulphur on the content of phosphorus in plants (% dm)
treatments
Head cabbage Common onion Spring barley
a B a B a B
grain straw
0 0.5 0.35 0.30 0.50 0.25 0.34 0.040
nPK 0.47 0.31 0.27 0.50 0.29 0.34 0.035
nPK + S1-So4 0.47 0.33 0.29 0.48 0.28 0.34 0.021
nPK + S2-So4 0.45 0.35 0.28 0.42 0.30 0.34 0.042
nPK + S3-So4 0.49 0.30 0.27 0.39 0.28 0.33 0.020
nPK + S1-S0 0.52 0.37 0.31 0.39 0.30 0.37 0.022
nPK + S2-S0 0.44 0.30 0.29 0.52 0.28 0.34 0.035
nPK + S3-S0 0.41 0.36 0.32 0.43 0.25 0.33 0.040
NIR P0.05
a nS nS 0.012 0.012 nS nS nS
b 0.016 nS nS 0.017 0.016 0.009 0.007
a × b 0.023 0.040 0.024 0.024 0.022 0.013 0.010
a – plants in the juvenile phase; B – plants in the consumption maturity phase; nS – not significant
Figure 4. Effect of different rates and forms of sulphur on phosphorus uptake by cabbage, onion and barley in the consumption maturity phase
8.3 8.6
11.9 11.4
8.8
11.1
8.9
11.2 10.0 11.4
13.5
12.4
7.0
11.9
14.4
12.5
9.1
14.5 15.7
17.0
15.2
17.6
15.0 14.8
0 5 10 15 20 25
0 NPK NPK + S1 NPK+ S2 NPK+ S3 NPK+S1 NPK+S2 NPK+S3
(kg
P/ha)
cabbage onion barley
[image:8.595.120.474.510.726.2]by onion plants; this tendency was not revealed in the objects fertilized with S-S0.
Sulphur fertilization, in general, caused no sig-nificant modification in the concentration of phos-phorus during the heading growth stage of barley compared to the object fertilized exclusively with nPK (table 7). However, there was one exception; in the case of the object that received 120 kg S-S0,
the content of phosphorus in barley during that growth stage was significantly lower, even though the concentration of available phosphorus in soil at that time was relatively high. the dependence revealed during our investigations did not confirm the results obtained by Matula (2004a, b).
the fertilization with 40 and 80 kg of sulphur mostly produced no significant effect on the con-tent of phosphorus in barley grain. Some signifi-cant depression in the amount of phosphorus in barley grain was noticed in the object fertilized with 120 kg/ha of S-So42– and S-S0. the
influ-ence of S-S0 turned out to be stronger than that
generated by S-So42– and occurred as early as at
the juvenile phase of barley growth. S-So42– and S-S0 fertilization had an inconsistent effect on the
content of phosphorus in barley straw.
an addition of sulphur to fertilizers generally increased the uptake of phosphorus by mature bar-ley, especially when 80 kg/ha S-So42– and 40 kg/ha
S-S0 were applied (Figure 4).
the content and uptake of phosphorus by plants, in both growth stages investigated, did not depend to a larger degree on the form or dose of sulphur applied.
Potassium
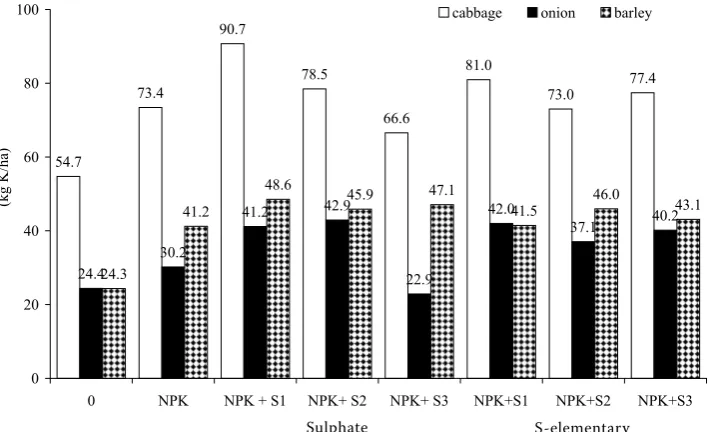
in the first year of the experiment, the concentra-tion of potassium in cabbage cotyledons increased under sulphur fertilization but was not dependent on the form of sulphur used (table 8). the content of potassium was lower in mature cabbage than in younger plants. addition of sulphur tended to cause a significant decline in the content of potassium compared to the nPK fertilized object. For mature cabbage the optimum rate of sulphur was 40 kg S-So42–/ha, both in terms of yield production and potassium uptake by cabbage plants (Figure 5). in the first year of the experiment elementary sulphur had a weaker effect on potassium uptake due to slow oxidation; this relationship was also indicated by Jaggi et al. (1999) and Zhou et al. (2002).
Higher rates of sulphate and elementary sulphur did not affect the concentration of potassium in onion cotyledons (table 8). Similar observations were reported by Hlušek et al. (1999).
[image:9.595.65.534.478.742.2]the application of 40 and 80 kg S-So42–/ha caused small albeit significant increase in the content
table 8. Effect of different rates and forms of sulphur on the content of potassium in plants (% dm)
treatments
Head cabbage Common onion Spring barley
a B a B a B
grain straw
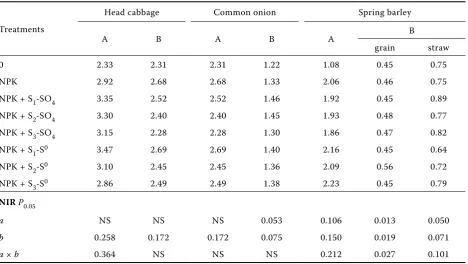
0 2.33 2.31 2.31 1.22 1.08 0.45 0.75
nPK 2.92 2.68 2.68 1.33 2.06 0.46 0.75
nPK + S1-So4 3.35 2.52 2.52 1.46 1.92 0.45 0.89
nPK + S2-So4 3.30 2.40 2.40 1.45 1.93 0.48 0.77
nPK + S3-So4 3.15 2.28 2.28 1.30 1.86 0.47 0.82
nPK + S1-S0 3.47 2.69 2.69 1.40 2.16 0.45 0.64
nPK + S2-S0 3.10 2.45 2.45 1.36 2.09 0.56 0.72
nPK + S3-S0 2.86 2.49 2.49 1.38 2.23 0.45 0.79
NIR P0.05
a nS nS nS 0.053 0.106 0.013 0.050
b 0.258 0.172 0.172 0.075 0.150 0.019 0.071
a × b 0.364 nS nS nS 0.212 0.027 0.101
of potassium in mature onion compared to the nPK fertilized object. in both growth phases of onion, nPK and nPK + S fertilization systems tended to increase the uptake of potassium by plants (Figure 5).
Following elementary sulphur application, the concentration of potassium in spring barley dur-ing the headdur-ing stage increased considerably. the sulphate form of sulphur limited the accumulation of potassium by barley plants. Sulphur added to the fertilizers did not modify concentration of potassium in barley seeds compared to the nPK fertilized object. Sulphur fertilization did not re-sult in any specific regular changes in potassium concentration in barley straw.
Sulphur fertilization, except for 40 kg S-S0/ha,
resulted in an increased uptake of potassium by mature barley plants, which accumulated mainly in straw (Figure 5). the difference was evident compared to the nPK-fertilized plants. the potas-sium uptake by barley was higher when sulphate rather than elementary sulphur was applied.
the content of potassium in plants was only weakly conditioned by the form and rate of sul-phur. the application of 120 kg S-So42–/kg caused depressed amounts of potassium in cabbage, onion and in barley during the heading phase.
REFERENCES
Blake-Kalff M.M.a., Zhao F.J., McGrath S.P. (2003): Sul-phur deficiency diagnosis using plant tissue analysis. Fertilizers Fertilization, 3: 5–25. (in Polish)
Fismes J., vong P.C., Gucker a., Frossard E. (2000): influence of sulfur on apparent n-use efficiency, yield and quality of oilseed rape (Brassica napus l.) grown on a calcareous soil. Eur. J. agron., 12: 127–141. Hlušek J., richter r., Hřivna l. (1999): Yields and
qu-ality of onions fertilised with nitrogen and sulphur. Zesz. nauk. akad. roln. Krakow, 64: 121–125.(in Polish)
Hlušek J., richter r., rigerová l. (2002): Sulphur in the nutrition and fertilization of vegetables. Chem. inżyn. Ekolog., 9: 1383–1390. (in Polish)
Hřivna l., richter r., lošák t., Hlušek J. (2002): Effect of increasing doses of nitrogen and sulphur on chemi-cal composition of plants, yields and seed quality in winter rape. rostl. výr., 48: 1–6.
Jaggi r.C., aulakh M.S., Sharma r. (1999): temperature effects on soil organic sulphur mineralization and elemental sulphur oxidation in subtropical soils of varying pH. nutr. Cycl. agroecosys., 54: 175–182. Matula J. (2004a): Barley response to the soil reserve
of sulphur and ammonium sulphate in short-term experiments under controlled conditions of cultiva-tion. Plant Soil Environ., 50: 235–242.
Matula J. (2004b): the effect of chloride and sulphate application to soil on changes in nutrient content in barley shoot biomass at an early phase of growth. Plant Soil Environ., 50: 295–302.
McGrath S.P., Zhao F., Blake-Kalff M.M.a. (2003): His-tory and outlook for sulphur fertilizers in Europe. Fertilizers Fertilization, 2: 5–27. (in Polish)
Panak H. (1997): Methodical Guide to agricultural Chemistry. Wyd. art, olsztyn. (in Polish)
[image:10.595.120.475.58.274.2]Scherer H.W. (2001): Sulphur in crop production – in-vited paper. Eur. J. agron., 14: 88–111.
Figure 5. Effect of different rates and forms of sulphur on potassium uptake by cabbage, onion and barley in the consumption maturity phase
54.7
73.4
90.7
78.5
66.6
81.0
73.0 77.4
24.4
30.2
41.2 42.9
22.9
42.0
37.1 40.2
24.3
41.2
48.6 45.9 47.1
41.5 46.0 43.1
0 20 40 60 80 100
0 NPK NPK + S1 NPK+ S2 NPK+ S3 NPK+S1 NPK+S2 NPK+S3
(kg
K/ha)
cabbage onion barley
Corresponding author:
Dr. ing. Małgorzata Skwierawska, Uniwersity of Warmia and Mazury in olsztyn, Department of agricultural Chemistry and Environmental Protection, ul. oczapowskiego 8, 10-718 olsztyn, Poland
e-mail: [email protected]
Schung E., Haneklaus S., Murphy D. (1993): impact of sulphur supply on the baking quality of wheat. asp. appl. Biol. 36, Cereal Qual., 3: 337–345.
Skwierawska M., Zawartka l., Zawadzki B. (2008): the effect of different rates and forms of sulphur applied on changes of soil agro chemical properties. Plant Soil Environ., 54: 171–177.
Sud K.C., Sharma r.C., verma B.C. (1996): Evaluation of levels and sources of sulphur on potato nutrition in Shimla hills. J. indian Potato assoc., 23: 134–138. Szyszko E. (1986): analytical instrumental Methods.
PZWl, Warszawa. (in Polish)
Walker K., Dawson C. (2003): Sulphur fertilizer rec-ommendations. Fertilizers Fertilization, 3: 71–89. (in Polish)
Zhao F.J., Hawkesford M.J., McGrath S.P. (1999): Sul-phur assimilation and effects on yield and quality of wheat. J. Cereal Sci., 30: 1–17.
Zhao F.J., Hawkesford M.J., Warrilow a.G.S., McGrath S.P., Clarkson D.t. (1996): responses of two wheat varieties to sulphur addition and diagnosis of sulphur deficiency. Plant Soil, 81: 317–327.
Zhou W., Wan M., He P., li S., lin B. (2002): oxidation of elemental sulfur in paddy soils as influenced by flooded condition and plant growth in pot experi-ment. Biol. Fertil. Soils, 36: 384–389.