Facial Trauma and 3-D Reconstructive Imaging: Insufficiencies
and
Correctives
Richard A. Levy,1'3 W. Thomas Edwards,2 Joel R. Meyer,3 and Arthur E. Rosenbaum1
Purpose: To address the clinical relevance of and optimal technique for 3-D CT imaging of facial trauma. Methods: Bioengineered cadaveric models were developed to enhance the concepts of LeFort. Diverse CT imaging techniques were applied to obtain optimal data sets for processing on various 3-D workstations. The fidelity of the 3-D reconstructions was determined by comparison with photographs of the cadaveric models. Optimized 3-D images were then used in conjunction with the initial 2-D data sets to assess whether additional accuracy was contributed by the 3-D images in the evaluation of modeled facial fractures. Results: Image definition was heavily dependent upon the specific 3-D reconstruction algorithm and the processor utilized. Orbital fractures were best imaged when 1- to 1.5-mm coronal sections were processed on an advanced 3-D workstation. The 3-D CT images resulted in additional accuracy in the 2-D CT evaluation of facial fractures in 29% of trials. Conclusions: We believe that bioengineered models of facial trauma-matched with appropriate CT scanning parameters-facilitate graphically reliable 3-D reconstructive imaging. 3-D reconstructions can improve accuracy in the 2-D CT evaluation of facial trauma.
Index terms: Models, anatomic; Computed tomography, 3-D; Face, trauma
AJNR 13:885-892, May/June 1992
Rene Lefort revolutionized the understanding of how facial fractures occur by modeling them and determining the stress sites (1). Since then, computed tomography (CT) has become the pri-mary imaging modality for facial fractures with direct primary plane and (indirect) multiplanar reconstructions important for conceptualizing de-ranged facial morphology. Indirect reconstruc-tions have been, perhaps, more important to the surgeon than to the radiologist. The more com-plex both the fracture and deranged planes are, the more valuable the faithful multiplanar recon-structions are likely to be for all parties. However, 3-D reconstructional displays have not acquired a significant position in the diagnosis of facial
Received March 27, 1991; accepted and revision requested May 22;
final revision received September 26. 1
Neuroradiology Division, Department of Radiology and 2
Orthopedic Research Laboratory, Department of Orthopedic Surgery, State University
of New York Health Science Center, Syracuse, NY.
3
Present address: Department of Radiology, University of Michigan Hospitals, 1500 E Medical Center Dr, Ann Arbor, Ml48109-0030. Address
reprint requests to Richard A. Levy, MD.
AJNR 13:885-892, May/June 1992 0195-6108/92/1303-0885 9 American Society of Neuroradiology
885
trauma because of their inaccuracies and associ-ated artifacts.
The most graphic clinically applicable display of bone morphology is 3-D. Gross pathologic disorders typified by craniofacial anomalies have been accurately and very graphically illustrated by 3-D imaging (2). This has not applied, how-ever, to representing finer anatomic details where 3-D CT imaging of facial trauma has lacked accuracy. Our present investigation has a twofold purpose-first, to investigate those factors that can optimize the accuracy of 3-D images of facial trauma and second, to assess whether these 3-D images contribute significantly to the routine 2-D CT evaluation of facial trauma.
Materials and Methods
Three cadaveric heads were obtained from the Depart-ment of Anatomy for the purpose of creating models of commonly occurring facial fractures. The fractures which were programmed included LeFort, tripod, orbital blowout,
and multiple comminuted orbital fractures with distractions ranging from zero to several millimeters. Two methods of
886 AJNR: 13, May/June 1992
A
Bc
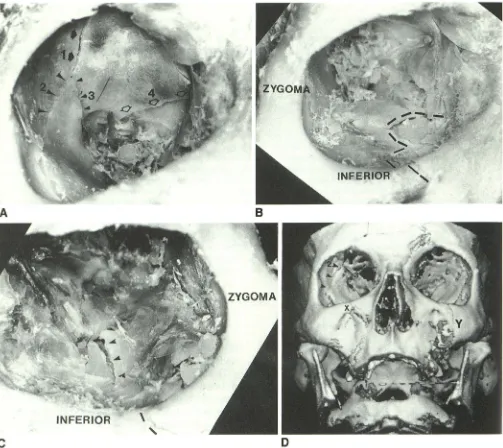
DFig. 1. A, Photograph of a cadaver containing a comminuted right orbital fracture. Numbers ( 1, 2, 3) show different components of the orbital roof and lateral orbital fractures. The posterior orbital fracture with its medial extension (4) is seen.
B, Photograph of the same cadaver as in A showing the "zig-zag" fracture of the right orbital floor (dashed Jines).
C, Photograph of the contralateral orbit showing a comminuted left orbital floor fracture with one prominent fracture (arrowheads), as well as an inferior orbital rim fracture (dashed black Jines).
D, Axial acquisition with 1.5-mm section thickness, seed growing algorithm (ISG). Right orbital roof and lateral wall fractures (2, 3) are only partially identified. Bone loss from the orbital roofs is due to a combination of partial volume averaging and thresholding effects. Bilateral zygomatico maxillary region fractures (X and Y) are well seen.
Loading Technique One
In this, our initial loading technique, a 98-N (see Appen-dix) weight was dropped a distance of 1.42 meters to produce a midface fracture over a relatively large area. The energy of this loading was 139.4 N-m, with a velocity at impact of 4.43 m/sec. The total area affected by this impact loading was approximately 10 cm2. The fractures produced involved the midface (cadaver 3, Fig. 1) and the zygoma (cadaver 2, Fig. 2) with concomitant fractures of the orbital regions.
Loading Technique Two
This technique, which was more precise, provided a
more concentrated load on a specific region of the face. The impact device used had been developed for inducing signal burst fractures (3-5). Cadaveric specimens were
secured to the device and positioned for load application
to produce either LeFort or zygomatic fractures. The head was supported rigidly by a support block and the face was
[image:2.612.59.562.75.523.2]AJNR: 13, May/June 1992 887
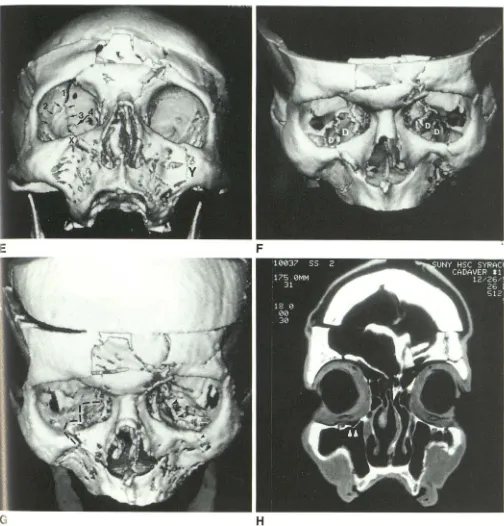
Fig. 1.-Continued. £, Coronal acquisition with 1.5-mm section thickness, seed growing algorithm. Right orbital roof and lateral
orbital fractures ( 1-3) are better displayed than in D. Posterior orbital fracture ( 4) is partially identified. Bilateral zygomaticomaxillary
region fractures (X and Y) are, again, well displayed.
F, Axial acquisition with 1.5-mm section thickness, seed growing algorithm. Note significant "dropout" (D) of bone from the orbital
floors as a result of partial volume averaging and thresholding effects, possibly compounded by the orbital floor fractures.
G, Coronal acquisition using 1.5-mm section thickness, seed growing algorithm. Right zig-zag orbital floor fracture is well seen
(dashed lines) along with the normal bone of the orbital floor. The left orbital floor fracture is also identified (arrowheads). A left
infraorbital rim fracture is present (single small black arrowhead.)
H, 2-D coronal section shows bilateral facial fractures, including right orbital floor fracture (white arrowheads).
was applied through a circular region of contact measuring 10.2 cm2
.
The load conditions in this second technique were scaled
from the first series of tests based on the energy applied
per unit area. In the first series of tests, the energy per area
[image:3.614.53.557.71.597.2]888
A
c
8
D
AJNR: 13, May/June 1992
LAT. WALL
Fig. 2. A, Photograph of the cadaveric specimen containing a left tripod fracture and orbital wall fractures. Multiple fracture fragments ( I, 2, 3) are seen in the orbital floor as well as in the medial orbit ( 4).
B, The lateral orbital wall fracture (large arrowheads) and posterior orbital wall fractures (small black arrowheads) with its lateral extension (white/ black arrowheads) is seen. A second orbital fracture is labeled (white arrow).
C, Axial acquisition with 1 .5-mm section thickness, seed growing algorithm. There is some loss of bone from the orbital floors. Large black arrowheads indicate the lateral orbital fracture on the left. Fracture of the posterior orbit is not identified.
D, Coronal acquisition with 1.5-mm section thickness, seed growing algorithm. Fractures of the lateral (large arrowheads), posterior (small arrowheads) and medial orbital wall ( 4), and of the orbital floor (I, 2, 3) are seen.
was produced by specifying the height for dropping a 100-N weight. For these tests, the 1 00-N mass was dropped from a 0.5-meter height along the guide rod, with the resultant potential energy of 50 N-m. The impact velocity was 3.1 m/sec using this drop weight. This method of loading created localized fractures of the facial bones,
without the accompanying comminuted fractures of the
orbital regions.
The orbital blowout fracture was created by blunt trauma to the inferior orbital rim as illustrated by Nesi et al (6) (cadaver 1, Fig. 3).
CT Data Acquisition
[image:4.613.52.562.66.535.2]AJNR: 13, May/June 1992
contiguous, nonoverlapping 1.5-mm sections. Technical factors were 120 kVp, 140-170 rnA, pulse width of 2 seconds, an 18-cm display field of view, matrix size of 512 X 512 and the bone reconstruction algorithm. Three angles
of scanning were used: 0°, 45°, and 90° to the hard palate. The cadaver containing the orbital blowout fracture (Fig.
3), was initially scanned on the GE 9800. Thereafter, a
depressed contralateral tripod fracture was created using the impact device of Edwards et al (4). These two fractures were scanned by both axial and coronal 1-mm sections on
a Siemens Somatom Hi-Q CT scanner (Siemens Medical Systems, Iselin, NJ). Technical factors were 133 kVp, 190 rnA, pulse width of 2. 7 seconds, matrix size of 512 X 512
and the "ultrahigh" algorithm.
3-D Imaging
Three 3-D imaging systems were used to generate the 3-D images. Those images obtained on the GE 9800
scanner were initially processed on a GE independent
console on the 3-D 98 Quick software at a threshold value
of 200. Siemens routine 3-D software was used to generate
the initial 3-D images from those obtained from Siemens Somatom Hi-Q scans; a threshold value of 225 was initially
889
utilized in these reconstructions. Illumination algorithms
were planar depth shading for the GE 3-D 98 Quick and variable point source for the Siemens 3-D system. Then
both the GE and Siemens scanner image data was
proc-essed using the ISG Camra Allegra dedicated 3-D
worksta-tion. 3-D reconstructions of Siemens image data were
processed using a regional variable threshold/ seed growing algorithm for the right orbital blowout fracture and using the binary thresholding algorithm for the remainder of the face.
The ISG reconstructions from the GE data were gener -ated using a regional variable thresholding/seed growing algorithm. An ISG surface enhancement algorithm was also used to modify selected images generated from the coronal 1.5-mm GE 9800 image data and from selected Siemens
image data. A multiple variable point source and variable
depth shading illumination algorithm was utilized for the
ISG-generated 3-D images.
All 3-D CT images were generated independent of
ca-daver model photographs. The 3-D images were correlated
with photographs to assess the accuracy of each imaging
technique (slice thickness, angle of section) and 3-D pro
c-essing system. Fracture displacement, distraction, and comminution were evaluated. The most accurate
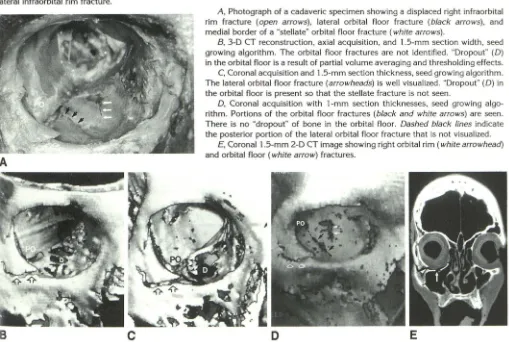
("opti-Fig. 3. The following symbols and letters apply to all figures: PO-greater sphenoid wing (posterior orbital wall); black arrows-laterally located orbital floor fracture; white solid arrows-medial border of a "stellate" orbital floor fracture; open arrows-displaced
lateral infraorbital rim fracture.
A
B
c
A, Photograph of a cadaveric specimen showing a displaced right infraorbital
rim fracture (open arrows), lateral orbital floor fracture (black arrows), and medial border of a "stellate" orbital floor fracture (white arrows).
B, 3-D CT reconstruction, axial acquisition, and 1.5-mm section width, seed
growing algorithm. The orbital floor fractures are not identified. "Dropout" (D)
in the orbital floor is a result of partial volume averaging and thresholding effects.
C, Coronal acquisition and 1.5-mm section thickness, seed growing algorithm.
The lateral orbital floor fracture (arrowheads) is well visualized. "Dropout" (D) in the orbital floor is present so that the stellate fracture is not seen.
D, Coronal acquisition with 1-mm section thicknesses, seed growing algo-rithm. Portions of the orbital floor fractures (black and white arrows) are seen. There is no "dropout" of bone in the orbital floor. Dashed black lines indicate
the posterior portion of the lateral orbital floor fracture that is not visualized. E, Coronal 1.5-mm 2-D CT image showing right orbital rim (white arrowhead)
and orbital floor (white arrow) fractures.
[image:5.614.56.565.401.743.2]890
mized") 3-D images for each cadaveric model were selected by the authors (R.A.L., A.E.R.) for the purpose of compar-ison with corresponding 2-D images. Eight observers,
in-cluding three neuroradiologists, one second-year fellow in neuroradiology, three board-certified general radiologists,
and one senior radiology resident (entering a neuroradiol-ogy fellowship) evaluated each of the paired 2-D and 2-D/ 3-D sets of images for each of the three cadavers. The
observers were asked to draw their impressions of the locations of the facial fractures on a standardized diagram
using only the 2-D CT images. The observers were then
asked to repeat this evaluation using both 2-D and 3-D CT data sets. The paired 2-D and 2-D/3-D evaluation forms
were evaluated by us (R.A.L., J.R.M.) for each case and
each observer by comparing them with the cadaveric
specimen photographs. We determined whether the 3-D
images added significantly to the accuracy of the
obser-vations. The 2-D/3-D interpretations were judged to add
accuracy to the "2-D only" interpretations when a fracture not seen on "2-D only" was detected by the 2-D/3-D
combination, or when a "false positive" fracture seen on
"2-D only" data was not detected on 2-D/3-D.
Results
Cadaver 1 with the right orbital blowout
frac-ture afforded the opportunity to compare the
most diverse set of imaging techniques, software,
and reconstruction algorithms. Special attention
was focused on the analysis of the normal orbit
and orbital fractures since there was a large
number of orbital fractures present in our three cadavers.
The most accurate 3-D reconstructions of the
right orbital blowout fracture occurred using 1-mm contiguous coronal sections processed via a regional thresholding/ seed growing (ISG) 3-D re-construction algorithm. {Fig. 3). There was only partial visualization of the orbital floor fractures
when 1.5-mm coronal sections were utilized in
conjunction with the regional thresholding/seed
growing algorithm (lSG). However, unlike the
cor-onal scan orientation, utilization of the axial
scan-ning orientation failed to image orbital floor
frac-tures. When using the Siemens 3-D binary
thresh-olding algorithm, the orbital floor was well imaged
on the 1-mm coronal sections, but no fractures
were visualized.
Other midfacial fractures, such as LeFort and
tripod fractures, although demonstrable, were few
in number and, therefore, not systematically
stud-ied {Figs. 1 and 2). Our results suggest that it is
likely that CT scan orientation becomes less
sig-nificant in the accurate 3-D display of nonorbital
facial fractures when 1-mm sections are used.
These fractures were used, however, in the
AJNR: 13, May/June 1992
2-D and 2-D/3-D comparison portion of the experiment.
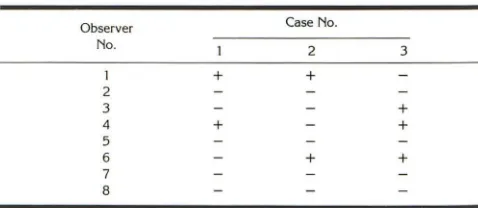
The results of our assessment of the increased accuracy in the interpretation of 2-D CT images of facial trauma afforded by the addition of 3-D reconstructions are presented in Table 1.
Of the 24 possible case/ observer responses,
7/24 (29%) showed increased accuracy in
inter-pretation of the 2-D CT images when 3-D was
used concurrently. Observers no. 1
(neuroradiol-ogist), no. 4 (general radiologist), and no. 6
(fourth-year radiology resident/neuroradiology
fellow) each developed more accurate descrip-tions of the facial fractures when 2-D and 3-D
images were used versus 2-D images alone.
Es-sentially, the three cases were equally represented when the 2-D/3-D combination yielded greater accuracy in interpretation than 2-D alone-case
no. 1-2/8 (25% of total possible), case no. 2
-2/8 (25% of total possible), case no. 3-3/8
(37.5% of total possible).
Discussion
Rene LeFort was the innovator of a systematic approach to creating facial trauma in cadavers (1). His technique involved the dropping of blocks on immobilized cadaveric heads and more ag-gressive methods, such as throwing entire corpses face first against blunt objects. The forces or impact energies generated in these
experi-ments were not quantified by LeFort.
A previous simplified modeling of fractures in
a dried skull has been described in which clinical type fractures were created with a handsaw (7). In this experiment, we sought to reexamine Le-Fort's techniques of blunt trauma. Initially, cinder blocks were dropped on an immobilized cadaveric head. Although this technique produced the de-sired fracture types, the energy dissipated on the
cadaveric face from the dropped blocks also
produced multiple comminuted hairline fractures.
TABLE 1: 2-D vs 2-D/3-D in evaluating CT image accuracy
Observer Case No. No.
2 3
1 + +
2
3 +
4 + +
5
6 + +
7 8
Note.- + = 3-D adds to accuracy of 2-D; - = 3-D does not add to accuracy of
[image:6.614.315.554.622.726.2]AJNR: 13, May/ June 1992
To control the fracture types within a confined
region to those encountered clinically, the
tech-nique of Edwards et al (4) was used.
The severity of fractures observed in the pres-ent study varied according to the applied impact energies which ranged from 139 N-m to 50 N-m, with impact velocities between 3-4.5 m/sec. At the higher energies, midface, zygomatic fractures and orbital region fractures occurred. At lower
impact energies, the extent of fractures could be
confined. This suggests that this range of testing conditions may be representative of injury con-ditions in vivo. Additional investigations are needed to determine the effect of variations
intro-duced by differences in facial geometry, bone structure, and other parameters known to influ-ence bone strength.
In this experiment, we have approached the
imaging problem of minimizing inaccuracies
re-sulting from partial volume averaging by
control-ling data acquisition and postprocessing of the
image. Partial volume averaging was minimized
by using the smallest slice thickness possible (1.5
mm for the GE 9800 and 1 mm for the Siemen' s
Somatom Hi-Q), creating voxels that approach
isotropy. When CT scan orientation is altered,
partial volume averaging effects will occur if
an-isotropic voxels are present. The utilization of a
variable thresholding 3-D reconstruction
algo-rithm permits the operator to regionally lower the
threshold values so that voxels of a particular
tissue type (eg, bone) which have been
volume-averaged are still included in the data set used
for the 3-D reconstruction. The pitfall of this
methodology is that the threshold value may be
excessively lowered in the region of interest so
that tissue of undesired Hounsfield unit value (eg,
soft tissue) is included in the 3-D reconstruction. A solution to this problem can result when the
operator draws a region of interest around a
specific anatomic structure (eg, lamina
papyra-cea) and manually lowers the threshold value until
the region of interest is literally "filled in" (often
slice by slice) to afford inclusion by the 3-D
reconstruction algorithm. In this circumstance,
owever, pathology may be missed because of
"fill in." By acquiring an optimal 2-D CT data set
which combines the appropriate slice thickness
and scan angle, partial volume averaging in the
initial 2-D data set is minimized and
postprocess-ing inaccuracies (eg, corrections for partial
vol-ume averaging, produced by thresholding errors)
are reduced. Thus, "pseudoforamina" and errors
of inclusion in the 3-D reconstructions may result
891
from the combination of suboptimal 2-D data
acquisition and thresholding errors. A discussion
of investigational work underway to minimize
effects of partial volume averaging by advanced thresholding algorithms has recently been
re-ported (8). While a completely automated 3-D
thresholding algorithm would be ideal, or artificial intelligence review would appear valuable, the
current dependence of results on a
user-interac-tive seed growing algorithm to detect fine details
is still necessary. The surface-enhancement
al-gorithm further provided improved visualization
of facial fractures. This improved visualization
was not based upon changes in thresholding, but
rather on modifications in surface illumination.
It is obvious to the practicing radiologist that the acquisition of numerous serial 1-mm sections
(axial or coronal) is very difficult to obtain in the
acutely traumatized patient who is combative or uncooperative. A high-resolution study presently
requires 45-60 minutes for approximately 100
1.5-mm slices. Even when the patient returns for
a subsequent CT data acquisition for 3-D, patient
motion must be minimized. Furthermore,
scan-ning speed and table incrementation of present
CT scanners can lend themselves to slice
misre-gistration that transforms into "step" artifact and error on the resulting 3-D reconstructions.
Soft-ware that allows for manual realignment of
mis-registered CT slices is not known to exist pres
-ently. Solutions to improving 3-D reconstructions
include more reliable and comfortable head
re-straints, patient sedation, and (ultimately) fast
scanning.
3-D reconstructions formerly were relatively
time consuming (1-2 hours long). Even with tape
transferring from CT to the 3-D workstation,
images on advanced systems can now usually be
loaded and processed in 5-10 minutes. Thus,
clinical use and radiologist-surgeon interaction at
the 3-D workstation can transpire. What is
ob-viously pertinent is that the CT scanner images
rapidly, sufficiently thin sections are generated, the correct scan angle is used, and the appropri-ate algorithm is selected to optimize imaging
results.
Comparing 2-D and 3-D
In the present study, we determined that 3-D
images add significantly to the 2-D CT evaluation
of severe facial trauma in 29% of trials. The
observer level of training, as well as type of facial
892
figure of 29% is conservative and would be
ex-pected to increase with improvement in physician
training in the evaluation of 3-D images.
At present, it is unlikely that 3-D CT images will replace the routine 2-D CT evaluation of facial
trauma. However, it is foreseeable that with the
appropriate combination of 2-D data (eg, 1-mm coronal sections), CT scanner (eg, fast scanner)
and 3-D workstation, 3-D images of sufficient
accuracy to significantly enhance the 2-D CT interpretation of severe facial trauma will become routinely utilized. The added understanding pro-vided by accurate 3-D CT images remains un-quantified primarily due to lack of physician
ed-ucation in the interpretation 3-D CT images.
We conclude that bioengineered models of facial trauma when matched with appropriate
scanning parameters and an advanced 3-D work
-station provide graphic reliable imaging. 3-D
re-constructions can improve the accuracy of rou-tine 2-D CT evaluation of facial trauma, elevating the importance of 3-D from an interest of refer-ring physicians to being relevant for neuroradiol-ogists and head and neck radiolneuroradiol-ogists.
Acknowledgments
We gratefully acknowledge the staff at ISG Tec hnolo-gies, Inc for use of their instrumentation and personnel to aid our 3-D image processing. Technical advice and
criti-cism was provided by Doran Dekel and Dr Michael Gree n-berg. Dr Stephen A. Kieffer, Dr Edwin D. Cacayorin, and staff of the Department of Radiology at SUNY are highly recognized and thanked for their encouragement and gen -erous support. We also wish to thank Marci Guyer, Maria Pembrook, and Jane B. Mitchell for their assistance in the preparation of the manuscript, and John Hodgson for photographing the specimens. We acknowledge and thank Charles C. Chamberlain, PhD, for providing radiation do
-simetry. We thank Dr Robert M. Kellman of the Department of Otolaryngology at SUNY for assistance in cadaveric dissection and analysis of 3-D images.
AJNR: 13, May/June 1992
APPENDIX
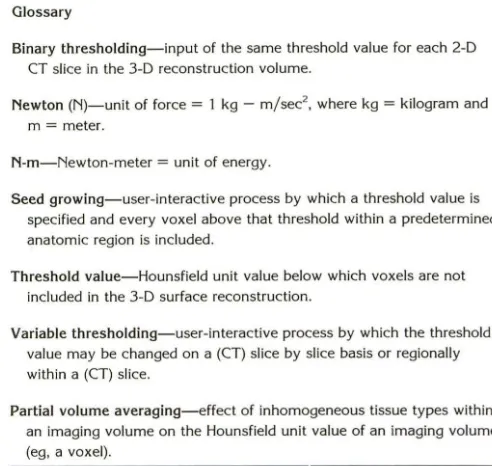
Glossary
Binary thresholding-input of the same threshold value for each 2-D CT slice in the 3-D reconstruction volume.
Newton (N)-unit of force = 1 kg - m/sec2
, where kg = kilogram and m = meter.
N-m-Newton-meter = unit of energy.
Seed growing- user-interactive process by which a threshold value is specified and every voxel above that threshold within a predetermined anatomic region is included.
Threshold value-Hounsfield unit value below which voxels are not included in the 3-D surface reconstruction.
Variable thresholding-user-interactive process by which the threshold value may be changed on a (CT) slice by slice basis or regionally within a (CT) slice.
Partial volume averaging- effect of inhomogeneous tissue types within an imaging volume on the Hounsfield unit value of an imaging volume (eg, a voxel).
References
1. Lefort R. Etude experimental sur les fractures de Ia machoire super -ieure. Revue De Chirugie 1901 ;23:360-379
2. Vannier MW, Marsh JL, Warren JO. Three dimensional CT recon -struction images for craniofacial surgical planning and evaluation. Radiology 1984; 150:179-184
3. Fredrickson B, Yuan H, Miller H. Burst fractures of the fifth lumbar vertebra. J Bone Joint Surg 1982;84(A): 1088-1094
4. Edwards WT et al. Biomechanical assessment of burst fractures in the thoraco-lumbar spine. Presented at the 1991 meeting of the Orthopedic Research Society.
5. Fredrickson BE et al. Reduction of the intracanal fragment in burst
fractures. Presented at the Second Annual Meeting of the North American Spine Society, 1987
6. Nesi F, LiVecchi J, Mathog RH. Orbital blowout fractures. In: Mathog RH, ed. Maxillofacial trauma. Baltimore: Williams and Wilkins, 1984: 322-323
7. Levy RA, Rosenbaum AE, Kellman RM, Bailey GL, Aravapalli SR. Assessing whether the plane of section on CT affects accuracy in demonstrating facial fractures in 3D reconstruction using the dried skull. AJNR 1991;12:861-866
8. Kohn Ml, Nitin TK, Herman GT, et al. Analysis of brain and cerebro -spinal fluid volumes with MR imaging. Radiology 1991;178:115-122
[image:8.617.314.560.100.333.2]