J. exp. Biol. (1979), 79, 115-126 I I 5 With afigura
Printed in Great Britain
BLOOD ACID-BASE BALANCE IN BROOK
TROUT (SALVELINUS FONTINALIS)*
BY RANDALL K. PACKER AND ARTHUR L. SUNKIN Department of Biological Sciences, George Washington University,
Washington, B.C. 20052, U.S.A.
(Received 15 June 1978)
SUMMARY
A nomogram is presented which allows the rapid assessment of acid-base status in brook trout (SalveKnus fontinalis Mitchill) at 18 °C.
Due to a PCOt of 3-5—4*3 mmHg in the respirometer water, the fish from
which data were obtained for determination of zero base excess values were suffering from slight respiratory acidosis. Trauma of surgery and anaesthe-tization as well as confinement in the respirometer might also have generated a slight metabolic acidosis.
Base excess values for trout with a chronically implanted dorsal aortic cannula ranged from — 3 to + 3 m-equiv/1. Blood buffer values of
<f[HCO3-]/JpH = 7-5o±4'42 slykes and -dlog1 0POoJdpH = 1-31 ±0-14
were found. Mean plasma protein concentration was 3-6 ±0-8 g/100 ml plasma and the buffering power of plasma was approximately 40% that of whole blood. Plasma proteins are more important blood buffers in fish than in humans.
INTRODUCTION
Various nomograms designed for assessment of acid-base balance in humans have been in use for a number of years. These nomograms, in their various forms, allow the derivation of a number of parameters pertaining to acid-base status from a few
relatively easily measured factors such as blood pH, POo,, and haemoglobin
concen-tration ([Hb]) (Singer & Hastings, 1948; Siggaard-Andersen, 1962).
The aim of this research was the construction of a nomogram consisting of base
excess (BE) and bicarbonate scales on a pH-PC0 co-ordinate system which could be
used for the rapid assessment of acid-base status in brook trout (Salvelinus fontinalis). While producing the nomogram, we hoped to establish 'normal' ranges for some indicators of acid-base status such as BE, actual bicarbonate and standard bicarbonate in cannulated fish. Standard bicarbonate is a measure of what the plasma bicarbonate
concentration would be at any given pH if Pco, w a s 'normal', and is used to assess
the non-respiratory (or metabolic) component of blood acid-base status, as is BE. A further goal was to investigate blood buffering.
n 6 R. K. PACKER AND A. L. SUNKIN
MATERIALS AND METHODS A. Source and maintenance offish
The Pennsylvania Fish Commission Hatchery at Huntsdale, Pa. provided 44 trout of both sexes ranging in weight from 185 to 380 g. These trout are considered to be the Huntsdale strain (strain H). We also used seven strain O (wt 285-465 g) and three strain 15 (wt 235-485 g) trout of both sexes obtained from the Benner Spring Fish Research Station, Pennsylvania Fish Commission, Bellefonte, Pa. Strains 15 and O were derived from nine and seven generations of inbreeding, respectively, from the Bellefonte Open strain (Robinson et al. 1976).
Trout were maintained in the laboratory at 18 ± 1-5 °C in a 680 1 epoxy coated steel
tank for at least 2 weeks prior to use in experiments. Approximately 8 lh~x of
charcoal-filtered tap water flowed through the tank. Tank water was also recirculated through a
glass wool and charcoal filter at a rate of approximately 7 lh"1. An ultraviolet light was
positioned over the filter. The fish were fed Purina Trout Chow three times per week and were exposed to the natural photoperiod. Trout were not fed for 48 h prior to an experiment. All experiments were conducted in a controlled temperature room at a water temperature of 18 ±0*5 °C.
B. Instrumentation and techniques
All measurements of blood pH and Pco were made using a Radiometer Blood
Micro System model BMS 2 Mk II in conjunction with a Radiometer PHM 71
Mk II acid-base analyser at I 8 ± O - I °C. This instrument was calibrated with
Radio-meter buffers S 1500 and S 1510 at pH 6-888 and 7-434. Buffer pH values were corrected to 18 °C using data provided by Radiometer. Blood samples were collected anaerobically and the pH of a 60 fi\ aliquot was measured. The original Poo, °f the blood sample was then determined using the Astrup technique. Two 80 fil aliquots of the blood sample were equilibrated with water-saturated gases of 4 % (Radiometer CCS) and 8 % (Radiometer CCS) or 4 % (Radiometer CCS) and 1 -45 % (Air Products)
CO2, 2 1 % O2, balance N2. Following equilibration, the pH of each aliquot was
measured and a pH-POOi titration line w,as thus determined. When the Astrup
technique is used the PCOj of the original sample, prior to equilibration, is determined
by the position of the original pH on the pH-PC0> titration line which is plotted on a
pH-PCOj co-ordinate system.
Blood [Hb] in gram percentage was determined by measuring cyanmethemoglobin using Hycel reagent and standards (Hycel, Inc.) and a Coleman Jr Spectrophotometer model 6A, following the methods of Blaxhall & Daisley (1973).
Blood acid-base balance in brook trout
length of saline-filled PE-50 tubing was attached to the other end of this needle on the outside of the respirometer lid. Blood was sampled by releasing a clamp on this tubing. After a blood sample was taken, the blood remaining in the cannula was flushed back into the fish with heparinized saline. The exterior of the respirometer was painted so that the fish could not see the investigator. Cannulated fish were allowed to recover for at least 24 h prior to any data collection in all experiments. Houston, Czerwinski & Woods (1973) and Soivio, Nyholm & Huhti (1977) report that most physiological parameters altered by anaesthestization and cannulation stabilize after 24 h.
Haematocrit and plasma protein concentrations were measured in blood samples from cannulated trout. Haematocrit was determined by centrifugation of blood in capillary tubes at 11500 rev/min for 5 min in an IEC model MB haematocrit centri-fuge. Total protein concentration of 20 fil plasma samples was measured using the methods of Palma (1971).
C. Determination of standard values of blood pH and PO O i
Prior to the construction of the nomogram, it was necessary to establish values of
pH and JPQO, m dorsal aortic blood of cannulated trout which could be used to define
the condition of zero BE. Aortic blood pH and PCOj were determined in anaerobically
drawn blood samples from 19 trout with the dorsal aorta cannulated. Of this group, 9 were strain H, 7 were strain O, and 3 were strain 15.
D. Construction of the nomogram
The nomogram constructed was based on the curve nomogram of Siggaard-Andersen (1962). This form was chosen, rather than an alignment nomogram such as those of Singer & Hastings (1948) or Siggaard-Andersen (1963), because the curve
nomogram is well suited for use in conjunction with the Astrup technique for Poo%
determination. The pH-PCOt titration lines generated by the Astrup technique may
be plotted directly on the pH-Poo, co-ordinate system of the curve nomogram. The
original Po0t of the blood sample and the blood acid-base parameters given on the
various nomogram scales may then be determined directly from the p H - P ^
titration line. In addition, the slope and position of the pH-PCOt titration line may be
used to calculate blood buffer values.
The nomogram, consisting of BE and standard bicarbonate scales on a pH-POOi
axis system, was constructed following the methods of Siggaard-Andersen & Engel (i960) and Siggaard-Andersen (1962). Modifications of their methods are given in the following brief description of construction of the nomogram.
In order to construct the BE scale, blood was collected into a heparinized glass syringe from the dorsal aorta of 35 strain H trout which were anaesthetized in a solution of 50 mg/1 of MS 222 (Crescent Research Chemicals). The blood of two or three fish was pooled to obtain sufficient quantities (6-7 ml) for titration. Blood was stored on ice for no more than 1 h until titrations and measurements were completed. Each pool of blood was used in the titrations as whole blood, as plasma obtained by centrifugation, or as whole blood to which red blood cells had been added to produce a High [Hb], Each pool was divided into a series of 490 fil aliquots, to which were added
n 8 R. K. PACKER AND A. L. SUNKIN
x> 3> 5> 7> 9, or i i m-equiv/1 of blood and the amounts of base were i, 3, 5
or 7 m-equiv/1. Although the proportion of blood to acid or base added was the same as that used by Siggaard-Andersen (1962), we used smaller total volumes to conserve blood. A complete titration series consisted of three pools of blood of differing [Hb] to which the quantities of acid or base noted above were added. NaCl was added to the HC1 and Na^COg solutions to give a total [Na+] of 150 HIM. Volumes of blood and acid-base solutions were measured using 1000 and 25 fi\ Hamilton syringes fitted with Chaney adaptors.
Following the addition of acid or base to a given blood or plasma sample, the pH was measured. Then, two 80 fi\ aliquots of blood were placed in the tonometers of the
Radiometer apparatus and were equilibrated with water-saturated gases of 4 % CO2,
21 % O2, balance N2 and 8% CO2, 21 % Oj, balance Na. Following equilibration, the
pH of each aliquot was measured and a pH-PCOt titration line was thus determined.
The slope of this titration line is directly related to the [Hb] of the blood sample.
Because of differences in slope resulting from differences in [Hb], the pH-POOf lines
intersect at a single point for aliquots of plasma, whole blood, and whole blood plus red blood cells to which, for example, 3 m-equiv/1 of acid had been added. Any blood sample that had the same initial acid-base characteristics and to which 3 m-equiv/1 of
acid had been added should yield a pH-PCOi titration line which intersects the same
point. Such intersection points were determined for each quantity of acid or base added. Four series of titrations were done, and yielded a minimum of three intersection points for each quantity of acid or base added.
All intersection points were then plotted and after standard values of arterial blood
pH and Poot were determined in cannulated trout, the BE curve was drawn on the
nomogram. The BE value of a blood sample is read at the point the pH-Pco, titration line intersects the BE scale.
In addition to the BE curve, a standard bicarbonate scale was placed on the nomo-gram (see Results section).
From pH-Poo, titration lines plotted on the completed nomogram, we calculated two different blood buffer values. An assessment of non-bicarbonate buffering power
was made using the relationship <f[HCO3~]/dpH, which corresponds closely to
-/?a( -fla = dB/dpU + d[HCO3-]/d pH + 2d[COa~]/d pH) in titrations with carbon
dioxide rather than with strong acids and bases. Due to this similarity we designated d[HCO3-]/dpH as - / ? ; . We also calculated -dlog^P^JdpH which has been
symbolized as — yffOOt (Burton, 1973). — AGOI*3 a measure of the combined buffering
power of bicarbonate and non-bicarbonate buffers.
RESULTS
Construction of the BE curve necessitated the establishment of ' normal' values for pH and PQQ^ of trout blood from the dorsal aorta at 18 °C in cannulated trout. Data from cannulated trout of all three strains yielded the following values:
pH = 7797±0-065 (-X'is.D., n = 19); PCOl = 5-2± I-I mmHg (X±S.T>., n = 18).
A one-way analysis of variance (Steel & Torrie, i960) showed no significant
differences in pH (F = 1-50; P > 01) and P(X)t (F = 1818; P > o-i) among th«|
Blood acid-base balance in brook trout 119
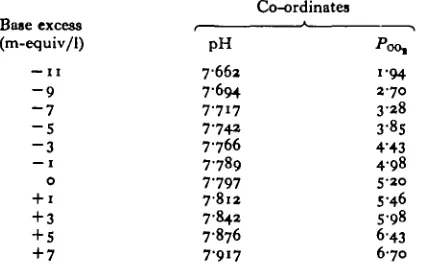
Table 1. Co-ordinates of points comprising the base excess scale
Base excess (m-equiv/1)
— 1 1 - 9 - 7 - 5 - 3 — 1
o + 1 + 3 + 5 + 7
Co-ordinates
pH
7662 7-694 7-717 7-742 7766 7789 7-797 7812 7-842 7-876 7-917
i'oo,
i-94 2 7 0
3 2 8 3-8S 4-43 4-98
S-2O
5-46 5-98 6-43 6 7 0
strains. These values were then used to define the condition of zero BE. It must be pointed out that these trout were suffering from slight respiratory acidosis and perhaps
metabolic acidosis as well. The POOi of water in the respirometer ranged from 3-5 to
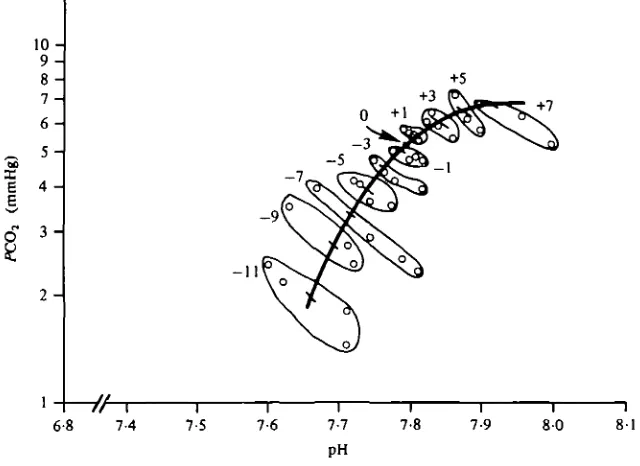
4-3 mmHg. This led to the relatively high blood PQQ,. A slight metabolic acidosis may have been generated by the stresses of anaesthetization and surgery as well as by the stress of confinement in the respirometer. Determinations of true zero BE values could be obtained only from completely unstressed fish. After adjustment of all data from the acid or base titrations to these normal values, the intersection points of pH-P0 0 | titration lines were plotted for blood of different [Hb] to which a given amount of acid or base was added. A smooth curve, representing the BE curve, was fitted by eye through the point clusters (Fig. 1) and was placed on the nomogram (Fig. 2). The co-ordinates of points comprising the BE curve are given in Table 1.
BE of any blood sample is then determined by the point of intersection of a pH-POOi
titration curve of the sample with the BE scale.
A standard bicarbonate scale was also constructed and placed on the nomogram. On
this nomogram, standard bicarbonate is the plasma [HCO8~] in blood having a
Poot of 5-2 mmHg with the haemoglobin fully Oa saturated. Using the
Henderson-Hasselbalch equation, it is possible to calculate plasma [HCOS~] for any pH as follows:
From a plot of the data given by Severinghaus (1965), we determined that the solubility
of CO2 in human plasma at 18 °C is 0-0492 mmol/1 per mmHg Pcot- Since trout
plasma is similar in ionic strength to human, we felt safe using this value. Values for pK, which change with pH, were read from the nomogram of Severinghaus, Stupfel & Bradley (1956). Bicarbonate concentrations were calculated for pH ranging from
6-8 to 8*2 at a PCOs of 5-2 mmHg, and the scale was placed on the nomogram (Fig. 1).
Standard bicarbonate values are read from the point of intersection of a p H - P ^ titration line of a blood sample with the standard bicarbonate scale.
The 'actual bicarbonate' value, i.e. the bicarbonate concentration of anaerobically
drawn plasma, is found by connecting the original blood pH-PCOi point to the
standard bicarbonate scale with a line having a slope equal to the slope of a pure
t
icarbonate buffer. The slope of an equilibrium line for a bicarbonate solution can be1 2 0 R. K. PACKER AND A. L. SUNKIN
10 9 8 7 6 _ 5 -e 4 o 3
2
-6-8
- 7
+7
7-4 7-5 7-6
l
7-7
PH
I
[image:6.451.61.381.71.304.2]7-8 7-9I 8 0
Fig. i. Base excess curve. Individual points (open circles) represent intersection points of pH-Poo. titration lines of blood samples having varying [Hb], to which a known amount of acid or base had been added. All intersection points resulting from experiments in which a particular amount of acid or base was added are encircled and the amount of acid or base added (m-equiv/1) is shown.
X
E
O 60-i
40
30
2 0
1Q
3
2
-1 -1-2 -1-4-1-6 2 3 4 5 6 7
Standard bicarbonate m-equiv/1
24 28 Base excess
m-equiv/1
6-8 6-9 7 0 7-1 7-2 7-3 7-4 PH
7-5 7-6 7-7 7-8 7-9 8 0 81
[image:6.451.51.393.369.585.2]Blood acid-base balance in brook trout 121
concentration according to the modified Henderson-Hasselbalch equation (Siggaard-Andersen, 1964; Davenport, 1975).
where a is the solubility of CO2. Rearranging,
Plotting values of pH and -Pco, obtained from this equation on the nomogram
yielded a line having a slope of — 280. Therefore, to determine the actual bicarbonate
value of any blood sample, a line with a slope of — 280 is drawn from the actual blood
pH value to the standard bicarbonate scale. The intersection point is the actual bicarbonate value.
To illustrate the use of the nomogram, an example of a pH-POOt titration line for a
blood sample taken from a cannulated trout is shown on Fig. 2. Point A on the titration line designates the original pH of the sample, 7-881. From the nomogram, one can
determine that original Poot = 3-8 mmHg; standard bicarbonate = 11 -4 m-equiv/1;
base excess = o; and actual bicarbonate = 10-7 m-equiv/1.
Table 2 shows mean values for various blood parameters for cannulated trout. These data were derived from not only the 19 cannulated trout which were used to
determine the 'normal' pH and PCOt values needed to define zero BE, but also
include data from an additional 21 cannulated trout used in experiments done after construction of the nomogram (see Packer, 1978).
The data were analysed for differences between strains using a one-way analysis of variance as described above. Values of F indicating no significant differences between strains were found for haematocrit, total plasma protein, base excess, and the two measures of blood buffering, — fi* and — /?oo,- F values indicating significant differences (P < 0-05) among strains were found for haemoglobin concentration,
actual [HCO3-] and standard [HCO3-].
The application of Duncan's New Multiple Range Test (Steel & Torrie, i960) indicated that [Hb] in strain H was lower (P < 0-05) than that of strain 15, but not strain O. There was no significant difference in [Hb] between strains O and 15. The standard and actual bicarbonate values for strain H were lower (P < 0-05) than both strains O and 15, but there were no differences between strains O and 15.
DISCUSSION
The nomogram we have constructed is valid only for brook trout at 18 °C having
PCOl within the range of the fish used in this study. A further limitation is that, as
may be seen in Fig. 1, the accuracy of the points on the BE curve decreases at numerically high BE values. Additionally we were unable to extend the BE curve
beyond —11 m-equiv/1 because the pH of acidified and COa equilibrated blood was
too low to be read on the expanded scale of the pH meter. Thus the BE scale of the nomogram is not useful for the assessment of severe acid-base disturbances. The Istandard bicarbonate scale may be used to assess the degree of metabolic disturbances
Table 2. Valw of various bhd pmameltrs for cann- trout Strnin H
X
S.D.(n)
Ranee
0
3 S.D. Ranee
15
X
B.D. Ranse Pooledxf
S.D.
Total protein
(g/1=
ml
PI-=) 3'7 f 0.7
(7)
2.6-5'0 3 '7
f
1'0
(10)
2.0-5.1 3'5
f
0.8
(7)
2'1-4'3 3.6
f
0.8
Standard IHCOa-I
(m-equiv/l)
10.4
f
1.6
(9)
7'613.0 12'1
f
1.8
(6)
9'8-13-8 12.3
f
0.7
(3)
I
1.5-12.7
-
Blood acid-base balance in brook trout 123
The average pH of dorsal aortic blood from trout in neutral environments was 7797 ±0-065. Taking temperature differences into consideration, it can be seen in
Table 3 that this value is within the expected range. Aortic blood PCOt (5-2 mmHg),
on the other hand, is higher than values for rainbow trout reported by other workers (Table 3). The respirometer system used in this study was closed, and despite
vigorous air bubbling in the reservoir, the PcOi °f w ater entering the respirometer
ranged from approximately 3-5 to 4 3 mmHg. Therefore the high POOi of inspired
water resulted in a blood Pc 0, that was high, but within a range easily tolerated by
trout (Eddy & Morgan, 1969). Due to the elevated blood PCo,> actual plasma
[HCO3~] (11 -3 m-equiv/1) was higher than that reported by other workers for trout
(Table 3).
BE values ranged from — 6 to + 3 m-equiv/1 in fish in neutral environments, with most values falling between — 3 and + 3 m-equiv/1. The normal range of BE values in humans is —3 to +3 m-equiv/1 (Tietz, 1976), indicating a similarity in control of the range of non-volatile acid concentrations in the blood of the two species.
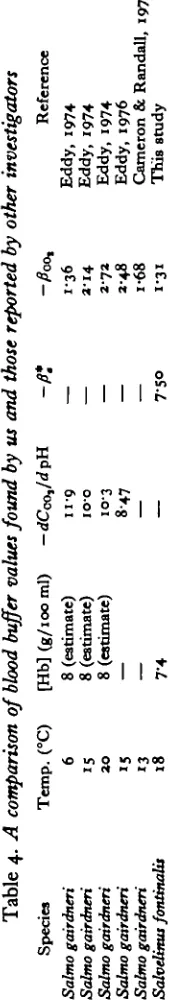
We found blood buffer values of - # J = 7-5014-42 slykes and -/?oo, = 1-31 ±0-14. In order to make comparisons with the data of other workers we are
assuming that — dC^^Jd pH (CCOi = total CO2 content) would be only slightly
greater than — fl* for the same blood sample (Burton, 1973). As may be seen in Table 4, our buffer values are somewhat lower than those reported by other workers for rainbow trout. No obvious reasons for the differences, such as large differences in [Hb], are evident.
Average plasma protein concentration was 3-6 + 0-8 g/100 ml plasma, and apparently
plasma protein contributes significantly to blood buffering. — J3* and —fiOOt were
calculated from CO2 titrations of seven separated plasma samples, —fit —
3-25 ±0-95 slykes/1 of plasma (X±s.D.), showing that the average non-bicarbonate buffering capacity of plasma was about 40% that of whole blood. In humans, the non-bicarbonate buffering power of plasma is about 24% that of whole blood (Tietz, 1976). The average [Hb] of whole blood samples for which — /?* was determined was
73 g/1 °f blood, and the —/?J was 7-5 ± 4-42 slykes/1 (X± S.D.). Assuming an average
Hct of 35%, and a plasma protein concentration of 36 g/1 of plasma, there were 23 g plasma protein/1 of blood. If the factor — /?* for whole blood is divided by the
g/1 of plasma protein plus [Hb] in whole blood, a value of 0-08 slykes/g protein I"1 is
obtained. The non-bicarbonate buffering power ( — /?J) of plasma, expressed as
slykes/g protein I"1 = 0-09. A comparison of these two values indicates that plasma
proteins and Hb have similar buffering power per unit weight.
~Ax>i> which is a measure of both bicarbonate and non-bicarbonate buffering
power, was 1-18 + 0-04 in plasma, whereas in whole blood —/?co, w a s i"3i±o-i4.
Therefore, even though blood [Hb] is quite variable and leads to great variability in —/?J in trout blood, changes in Hb content have a smaller effect on total blood buffering power (as measured by — ^co,) than might be expected.
Table
4.
species
A
comparison
of
bM
buffer
values
found
by
us
and
those
reported
by
other
investigators
[image:10.703.208.293.121.621.2]Blood acid-base balance in brook trout 125
were not successful. The fact that [Hb] and bicarbonate values were lower in strain H could not be interpreted in terms of resistance to acid environments since this strain had not been tested for acid tolerance as strains O and 15 had been.
This work was supported by N.S.F. grant BMS 7406257 and the George Washington University. We would like to thank D. Graff, T. Dingle, and W. Kennedy of the Pennsylvania Fish Commission and Dr J. E. Wright, Professor of Genetics, Pennsylvania State University for providing trout for this study. We would also like to thank Dr George M. Hughes, Professor of Zoology, University of Bristol and Dr William A. Dunson, Professor of Biology, Pennsylvania State University, for their help at various stages in this project, as well as Ms Adrienne Fleury for her aid in manuscript preparation.
REFERENCES
BLAXHALL, P. C. & DAIBLEY, K. W. (1973). Routine haematological methods for use with fish blood.
J. FishBiol. 5, 711-781.
BURTON, R. F. (1973). The roles of buffers in body fluids. Retpir. Pkysiol. 18, 34-42.
CAMERON, J. N. & RANDALL, D . J. (1972). The effect of increased ambient CO, content and pH in rainbow trout. J. exp. Biol. 57, 673—678.
DAVENPORT, H. W. (1975). The ABC of Acid-Base Chemistry, 6th ed. Chicago: The University Press. EDDY, F. B. (1974). In vitro blood carbon dioxide of the rainbow trout, Salmo gairdneri. Comp. Biochem.
Physiol. 47 A, 129-140.
EDDY, F. B. (1976). Acid-base balance in rainbow trout (Salmo gairdneri) subjected to acid stress.
J. exp. Biol. 64, 159-171.
EDDY, F. B. & MORQAN, R. I. G. (1969). Some effects of carbon dioxide on the blood of rainbow trout
Salmo gairdneri, Richardson. J. Fish Biol. 1, 361—372.
FALK, D. L. & DUNSON, W. A. (1977). The effects of season and acute sub-lethal exposure on survival times of brook trout at low pH. Water Res. 11, 13-15.
HOLETON, G. F. & RANDALL, D. J. (1967). The effect of hypoxia upon the partial pressure of gases in the blood and water afferent and efferent to the gills of rainbow trout. J. exp. Biol. 46, 317-327. HOUSTON, A. H., CZBRWINSKI, C. L. & WOODS, R. J. (1973). Cardiovascular-respiratory activity during
recovery from anesthesia and surgery in brook trout (Salvelinus fontinalis) and carp (Cyprinus
carpio).J. Fish Res. Bd Can. 30, 1705-1712.
JANSSEN, R. G. & RANDALL, D. J. (1975). The effects of changes in pH and Poo, in blood and water on breathing in rainbow trout, Salmo gairdneri. Resp. Physiol. 35, 235-245.
MILNE, R. S. & RANDALL, D. J. (1976). Regulation of arterial pH during fresh water to sea water transfer in the rainbow trout (Salmo gairdneri). Comp. Biochem. Physiol. 53A, 157-160.
PACKER, R. K. (1979). Acid-base balance and gas exchange in brook trout (Salvelinus fontinalis) exposed to acidic environments. J. exp. Biol. 79, 127-134.
PALMA, A. V. (1971). Procedures in Clinical Chemistry, pp. 85-87. Philadelphia: Lippincott.
RANDALL, D . J. & CAMERON, J. N. (1973). Respiratory control of arterial pH as temperature changes in rainbow trout Salmo gairdneri. Am. J. Physiol. 23$, 997-1002.
ROBINSON, G. D .t DUNSON, W. A., WRIGHT, J. E. & MAMOLITO, G. E. (1976). Differences in low pH
tolerance among strains of brook trout (Salvelinus fontinalis). J. Fish Biol. 8, 5—17.
SEVERINGHAUS, J. W. (1965). Blood gas concentrations. In Handbook of Physiology, vol. 2 (ed. W. D . Fenn and H. Rahn), pp. 1475-1487. Washington: American Physiological Society.
SBVKRINGHAUS, J. W.( STUPFEL, M. & BRADLEY, A. F. (1956). Variations of serum carbonic acid pK' with pH and temperature. J. appl. Physiol. 9, 197-200.
SIOGAAHD-ANDERSBN, O. (1962). The pH-log Poo, blood acid-base nomogram revised. Scand. J. din.
Lab. Invest. 14, 598-604.
SIGGAARD-ANDERSEN, O. (1963). Blood acid-base alignment nomogram. Scand. J. din. Lab. Invest. 15,
211-217.
SIGOAARD-ANDERSEN, O. (1964). Symposium: pH and Blood Gases. Presented at the 1964 Annual Meeting of the Canadian Society of Clinical Chemists, pp. 2-15. London and Ontario: Bach-Simpson. SIGOAARD-ANDERSEN, O. & ENGEL, K. (i960). A new acid-base nomogram. An improved method for the ^ calculation of the relevant acid-base balance data. Scand. J. dm. Lab. Invest. 13, 177-195.
BINGER, R. B. & HASTINGS, A. B. (1948). An improved clinical method for the estimation of disturbances of the acid-base balance of human blood. Medicine 34, 51-95.
126 R. K. PACKER AND A. L. SUNKIN
SOIVIO, A., NYHOLM, K. & HUHTI, M. (1977). Effects of anesthesia with MS 222, neutralized MS 222I and benzocaine on the blood constituents of rainbow trout, Salmo gairdneri. J. Fish Biol. io, 91—101. SMITH, L. S. & BELL, G. R. (1964). A technique for prolonged blood sampling in free swimming
salmon. J. Fish Res. Bd Can. a i , 711-717.
SMITH, L. S. & BELL, G. R. (1967). Anesthetic and surgical techniques for the pacific salmon. J. Fish
Res. Bd Can. 24, 1579-1587.
STEEL, R. D . G. & TORRIE, J. H. (i960). Principles and Procedures of Statistics, pp. 112-114. New York, and London: McGraw-Hill Book Company, Inc.
SWARTS, F. A. (1978). Factors involved in the resistance of brook trout (Salvelinus fontinalis) to sulfuric acid solutions and mine acid polluted waters. M.Sc. thesis, Pennsylvania State University. TIETZ, N. W. (1976). Fundamentals of Clinical Chemistry, pp. 934-972. Philadelphia, London and
Toronto: W. B. Saunders Company.