UNDERWATER HEARING IN THE FROG,
RAN A CATESBEIANA
BY R. ERIC LOMBARD,*
• Department of Anatomy, The University of Chicago, 1025 East $jth Street,
Chicago, Illinois 60637 (U.S.A.)
RICHARD R. FAY AND YEHUDAH L. WERNERf
Department of Psychology, Loyola University, 6525 North Sheridan Road, Chicago, Illinois 60626 (U.S.A.)
f Department of Zoology, Hebrew University of Jerusalem, Jerusalem, Israel
(Received 16 July 1980)
SUMMARY
Comparable auditory sound pressure level (SPL) and sound intensity level (SIL) threshold curves were determined in air and under water in Rana
catesbeiana. Threshold curves were determined using chronic metal electrode
implants which detected multi-unit responses of the torus semicircularis to incident sound. In terms of SPL, hearing thresholds in water and air are similar below 0-2 kHz. Above 0-2 kHz, the sensitivity under water falls off at about 16 dB/octave to reach an average loss of about 30 dB above 0-4 kHz. In terms of SIL, the organism is about 30 dB more sensitive under water than in air below 0-2 kHz and equally sensitive in air and water above 0-4 kHz. The relative merits of the two measures are discussed and an attempt is made to relate the results to morphology of the middle and inner ears. This report is the first to compare aerial and underwater hearing abilities in any organism using electrode implants.
INTRODUCTION
Studies of the vocalization and hearing of anuran amphibians (reviewed by Capranica, 1976 a, b) have been conducted with the experimental animals in the air, even though many species are known to spend much time under water. In this study we seek to clarify the extent to which an anuran ear, known to function in air, can serve underwater.
intervening structures, such as Weberian ossicles. Due to the high compressibility^ the gas relative to water, sound pressure fluctuations cause movements of the bubble walls (and thus of the otoliths) which are considerably greater than the particle motions associated with the underwater sound wave itself (Wever, 1971).
Since the density of air is approximately 1-2 kg m"3, a terrestrial organism is faced with the problem that 99-9% of the incident sound energy is reflected from the body surface resulting in about 30 dB loss in sound transmission to the ear. The tympanic ear of tetrapod vertebrates is generally viewed as an adaptation to overcome this problem. The surface area of the tympanum is always greater in area than the footplate of the stapes or columella and additionally the middle ear bone or bones usually form a mechanical lever. These mechanisms in combination match the impedance of air to that of otic fluid, thus reducing or eliminating the transmission loss. These mechan-isms for impedance matching in air are discussed for mammals in Dallos (1973) and for the lizard Crotophytus as an example for reptiles by Wever & Werner (1970).
As a consequence of these considerations, an organism adapted for hearing in either air or water hears rather poorly when in the alternative medium. Man, with a relatively generalized mammalian middle ear, shows a 50-70 dB hearing loss underwater with greater losses occurring at the higher frequencies (Smith, 1969). By contrast, pinne-peds, which have modified middle ears, show lower sound pressure threshold under water than in air and reduced aerial sensitivity compared with man (Mohl, 1968 Terhune & Ronald, 1971, 1972).
The middle ear of many anurans, including that of Rana, is generally viewed as an adaptation for aerial hearing: a superficial tympanic membrane separates the external medium from an air-filled middle ear cavity. A columella spans the middle ear cavity and couples the tympanum to the fluid in the otic capsule. The area of the tympanic membrane is large compared to that of the footplate of the columella, and the columella has the potential of forming a mechanical lever. In these features, the anuran ear is superficially comparable to that of amniotes (Lombard & Bolt, 1979; Lombard, 1980). However, in other features the anuran ear is unique. The fenestra ovalis contains not only the footplate of the columella but also an otic opercular bone (or cartilage) which has a complex joint with the footplate of the columella. The otic opercular bone pro-vides an insertion for a muscle originating on the shoulder girdle (Lombard & Straughan, 1974). In the inner ear there are two separate sensory neuroepithelia: the amphibian papilla and the basilar papilla. These papillae, even when taken together, contain a small number of hair cells in comparison with mammals (Geisler, van Bergeijk & Frishkopf, 1964; Lewis, 1978). Finally, the method of creating relative shearing motion between the hair cells and the overlying tectorial structure appears to be comparable to that in fishes rather than amniotes (Wever, 1974, 1976).
In view of these unusual structural features we have investigated whether the anuran ear has special adaptations for underwater as well as for aerial hearing.
MATERIALS AND METHODS
5 mm
Fig. i. Chronic electrode emplacement. The diagram is in a paramedian plane.
kept in aquaria in the laboratory at 18-24 °C until used, usually within 4 weeks of purchase. The results reported here are based on three animals for which complete data are available and four others which produced partial data. These seven subjects are a small minority of the animals employed, due to numerous technical difficulties, especially in electrode attachment. Therefore we describe, below, the procedure which was finally successful.
Surgery
Animals were anaesthetized for surgery by an intraperitoneal injection of 1 ml of 20 % ethyl carbamate per 0-095 kg °f body weight. A dorsal midsagittal incision was made through the skin between the tympanic membrane and the margins of the skin retracted. The periosteum covering a large portion of the frontoparietal bone, posterior to the eyes, was peeled off, and the bone scraped clean of connective tissue. A dental drill was used to make a hole 1-2 mm in diameter through the skull to one side of the midline so as to provide access to the dorsal surface of the right or left optic lobe. The meninges covering the lobe were torn open with fine forceps. Three or more small anchor holes were drilled in the bone near the access hole at varying depths to the depth of the underlying chondrocranium at varying oblique angles.
Electrode emplacement
Kohl-rausch's solution. Completed electrodes had a measured resistance of 0-5-0-1 With the frog situated in an aerial sound field (described below), the electrode was gradually driven through the optic tectum and underlying ventricle into the torus semicircularis of the midbrain. When a suitable multi-unit response (75 mV) to a search stimulus (20 ms, 1-3 kHz tone bursts, at - 3 4 dBre: 1 N m~a) was encountered, the electrode was fixed in place. A lucite cap (Fig. 1) was carefully lowered down the electrode on to a wet dental cement surface (Caulk Grip Cement, L. D. Caulk Co.). When this cement had hardened, additional cement was placed around the cap. After a halfhour curing period, a permanent reference electrode was lowered through the second hole in the cap and cemented.
Earlier work, using these electrophysiological responses of the torus in a number of anuran species, showed that the shape and sensitivity of the frequency threshold curve (FTC) varies little with the precise location of the recording electrode (Lombard & Straughan, 1974). Pettigrew, Chung & Anson (1978), on the other hand, have demon-strated in Rana temporaria that the amplitude of slow-wave evoked potentials varies with recording location and with the azimuth of the sound source in the horizontal plane. In our case, the possibility that different electrode locations could give differently sloped FTCs is unimportant since we investigate the differences in sensitivity in air versus water for a given electrode placement. The possibility that thresholds may vary with sound source direction, on the other hand, may be important here since the direction of the aerial sound (0° azimuth in the horizontal plane) was quite different from the direction of the underwater source (from below). However, since the con-duction pathways to the inner ear during underwater sound stimulation are not known, the effective direction of underwater sound is impossible to specify, and we cannot yet evaluate the effects of the ear's possible directional characteristics on the present results.
Experimental procedure
Initially, aerial frequency threshold curves (FTC) for multi-unit responses were determined for each experimental animal daily. Each successive FTC showed an improvement in sensitivity, presumably due to the waning effects of the anaesthetic. After two or three days, the FTCs were stable and repeatable. Later frogs were simply allowed to recover for three days before testing began. The basic procedure was to first determine the aerial FTC. One to two days later the underwater curve was deter-mined and then on to the following day the aerial determination was repeated. Because the FTCs of ectothermic tetrapods are affected by body temperature (Camp-bell, 1969; Werner, 1972, 1976; Mohneke & Schneider, 1979; Hubl & Schneider, 1979), all aerial FTCs were obtained at a body temperature of 18-21 °C, monitored by a rectal telethermometer. For the aquatic FTCs, water temperature was regulated to within 1 °C of the body temperature of the same animal during the aerial tests. This report describes the results mainly from those experiments in which the entire test sequence (air, water, air) was complete.
Aerial frequency tuning curves
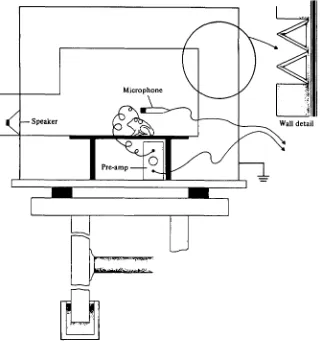
Fig. 2. Aerial experimental chamber. T h e tympanum of the animal lies O'6o m from the centre of the speaker. The outside of the chamber measures 0-85 m high and deep and I-I m wide. The walls are 37 mm thick, constructed of plywood covered on both sides with acoustic tile. The internal surface (insert) is covered with wedges made from synthetic fibre brewing filters. The chamber rests on a heavy marble table, the legs of which are embedded in sand. The chamber is inside a small, partially soundproofed room. The walls of the chamber contain copper mesh and act as a Faraday cage. The ambient noise in the chamber is about — 4 dB re 1 N m~* rms below 0-06 kHz, falling to — 74 dB at 0-2 kHz and below —85 dB above 0-3 kHz. The ambient noise level is below threshold for Rana catesbeiana at all frequencies greater than about o-i kHz.
were shaped pulses io, 20, and 40 ms in duration. The rise and fall times were 5 ms and the pulses were repeated twice per second. The test frequencies ranged from o-i to 2*0 kHz in approximately o-i kHz intervals. Test frequencies were chosen to avoid frequency bands where standing waves or other distortions occurred in either or both the aerial or underwater experimental chambers. Thresholds were subjectively deter-mined by monitoring the response signal visually (oscilloscope) and acoustically (loud-speaker). The stimulus level eliciting a lowest detectable electrical response against background of physiological noise was denned as threshold. Successive curves were etermined by alternating investigators as described by Lombard & Straughan (1974).
62
Ring stand
Hydrophone
Speaker
Fig. 3. Underwater experimental chamber. The tank is an open-top vinyl cylinder measuring c 6 m diameter by 0 7 m high. The water depth was held at 0-63 m. The weighted animal platform is suspended from a ringstand by wire. The speaker (University Underwater loud-speaker) lies o-i m from the bottom.
Underwater frequency turning curves
The underwater FTCs were determined by submerging the frog in a plastic tank (Fig. 3). The frog was restrained by tying it to a weighted plastic mesh platform. Curves were determined with the same procedures as used in air. Frequency threshold curves were determined with the animal at two depths: 0-05 m and 0*25 m below the surface. In each case the animal's head was centred over the speaker. Threshold sound pressure levels were determined by placing a Clevite CH-17 hydrophone near the surface of the contralateral (to the electrode) tympanic membrane but the hydrophone was removed from the vicinity of the experimental animal during the search for threshold. The frogs were raised to the surface approximately every twenty minutes for a breathing respite.
O r
-10
-20
- . -30
t/j
e
\ -40
T3
- 5 0
- 6 0
- 7 0
-80
- 9 0
Pre air
0-2 0-4
kHz
[image:7.451.81.361.85.446.2]0-6 0-8 10 2 0
Fig. 4. Sound pressure level threshold curves for U C o o m , a 0-441 kg female. The stiple represents + one standard deviation unit about the mean. The 0-05 m curve is the average of three experimental runs; the 0-25 m curve is the average of two experimental runs; aerial (pre) curve is the average of two experimental runs; and the aerial (post) curve is the average of three experimental runs. 'Pre' refers to the aerial curves determined prior to the underwater experiments and 'post* refers to those determined after the underwater experi-ments. The unusual standard deviation at 0-218 kHz on the aerial (post) curve results from SPL measures of —50, —51, and —36 dB. The dispersion of data points was similar for all other experimental animals and hence standard deviations are reported for this data set only. The peak arial SPL sensitivity at 0-7 kHz represents a pressure of 9-6 x io~8 N m~2 rms. The peak aerial SPL sensitivity in man is about 2 x i o "5 N nr1 rms at 3-5 kHz. Stimulus pulse length was 40 ms.
the GeoSpace device and exciting both vertically in the air. The measured water particle accelerations were then used to calculate the apparent impedance of the water surrounding the frog under the various experimental conditions.
The validity of these impedance calculations depends upon an efficient coupling J«tween the accelerometer and the water medium so that the accelerometer would
50
40
30
S 20
03
•a 10
- 1 0
- 2 0
/ ' \ V
f 0 0 5 m water
;0-25 m water
-Air (pre)
1 I I
0-2 0-4 0-6
kHz
0-8 10 2 0
Fig. 5. Underwater SPL thresholds relative to those in air for UCooi 11. The data have been smoothed by averaging: each point (save the first and last) is the average of the sums of the differences between the underwater curve and the aerial curve for that particular frequency and the neighbouring frequencies on both sides.
undergo the same motion amplitude as the surrounding water particles. We were not able to independently determine the efficiency of this coupling. To the extent that the motion of the accelerometer was below that of the water particles, we would have underestimated particle motion amplitude, and overestimated the impedance of the medium. This, in turn, would lead to an underestimate of the underwater sound intensity and ultimately to an underestimate of the animal's threshold (see below).
OBSERVATIONS
Comparison by sound pressure level (SPL)
106
I
I
I
1O5*-'*
1 0 2 5 m water
• 0 0 5 m water
10"l 1
0-2 0-4 0-6 0 - 8 1 0 kHz
[image:9.451.121.357.95.372.2]2 0
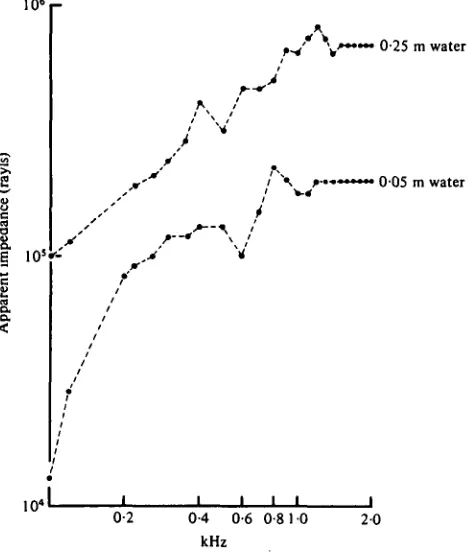
Fig. 6. The apparent impedance for each frequency used in the underwater experiments. The impedances were determined by measuring the particle velocity at each frequency at each depth at a known pressure level. A general standard impedance for fresh water at 20 °C is about 1-4 x i oe rayls.
All seven females examined comformed to the example displayed in Figs. 4, 5. There was no obvious variation in either aerial or underwater curves which correlated with body size. In most cases, the 0-25 m underwater curve showed a lower SPL threshold below 0-2 kHz relative to air. In contrast, the 0-05 m underwater curve was usually coincident with the aerial curve in this same frequency band. No differences were noted among responses to signal pulses of different durations. However, these were minor variations between animals in the exact frequency of the most sensitive regions and the sound pressure levels at threshold throughout the range of the FTC.
Comparison by sound intensity level (SIL)
- 3 0
i-- 4 0
V - 5 0
E
o -60 x
•*
?! - 7 0
J -80
t/3
-90
,»0-25 m H20
i i
0-2 0-4 0-6 kHz
0-8 10 2 0
Fig. 7. Sound intensity level threshold curves for UC00130, a 0-222 kg female. The reference 2-43 x i o ' W m~s is the acoustic intensity of a sound pressure of 1 N m"9 in the air. The aerial (pre) curve is the average of two experimental runs. The 0-25 m underwater curve is the average of five experimental runs. The peak aerial SIL sensitivity at 0-7-0-9 kHz represents a sound intensity of 7-7 x io"11 W m~* r.m.s. Stimulus pulse length was 40 ms.
warranted, we also examine our data using sound intensity level. Sound intesity level (SIL) is derived from the sound pressure level by
SIL = 10 log
where
intensity ref. intensity'
.... „> pressure2 r.m.s. intensity (W m~2) = . — ^ ? T-—
v impedance of medium
(0
(2)
and is an expression of acoustic power. In SIL, unlike SPL, the impedances of the two media are taken into account.
The impedance of air is about 4-1 x io2 rayls and that of water about 1-4 x io6 rayls. The impedance used in the calculation of SIL for our aerial data was 4-1 x io2 rayls which presumes dry air at 1 atm and 20 °C. Actually, the relative humidity in our aerial chamber varied between 10 and 40%, the pressure roughly 0-05 atm, and the temperature between 18 and 21 °C. These variations produce a relatively small error in our standardized impedance.
-20 r
- 3 0
V E
o
X rr
re
: 2
00
•a
SI
L
- 4 0
-50
- 6 0
- 7 0
- 8 0
0 0 5 m H j O V
0-25 m HjO
0-2 0-4 0-6 0-8 10 kHz
2-0
Fig. 8. Sound intensity level aerial and underwater threshold curves for U C o o m , a 0-441 kg female. The peak aerial SIL sensitivity at 0-7 kHz represents a sound intensity of 2-2 x i o ~u W
m"1 r.m.s.
nearfield where particle displacements are much greater than expected for a given pressure. We calculated our impedance value by means of the relations
, / pressure \ , impedance = ^ -,1 Jz,
\u \r 277// (3)
where </peak is the peak particle displacement and/frequency. Vertical displacements at known pressures were measured in our experimental configurations using an under-water accelerometer. Fig. 6 shows the calculated impedances for our experimental tank. Note that the impedances are frequency-dependant at both depths, with values approximating those to be expected under ideal conditions (106 rayls) only for the greater depth at the higher frequencies. All of the data are derived using these measured impedances for each frequency at each depth.
68
R. E. LOMBARD, R. R. FAY AND Y. L. WERNER20
10
dB
- 1 0
- 2 0
- 3 0
- 4 0
V\
Air (pre)i
0-2 0-4 0-6 0-8 10 2 0 kHz
Fig. 9. Underwater SIL thresholds relative to those in air for the two animals represented in Figs. 7 and 8, showing the extremes in the range of results. Both curves are for a depth of 0-25 m and averaged as in Fig. 5.
DISCUSSION
Mature frogs have two discrete auditory neuroepithelial papillae in the inner ear. The amphibian papilla responds to low frequencies (roughly less than i kHz) whereas the basilar papilla responds best to higher frequencies (roughly greater than i kHz) (reviewed in Capranica, 1976a, b). The low frequency sensitivity peak is about the same in all anurans, o-2-o-6 kHz. This low frequency sensitive region has been shown in some frogs to be formed by a composite of two groups of single units: one group maximally sensitive around 0-2 kHz in all frog species examined and another with a maximal sensitivity at O'S-o-8 kHz depending on the species. In Rana catesbeiana the upper frequency peak is around 1 -2-1-4 kHz depending on temperature. The two lower frequency peaks are around 0-2 kHz and c-5-o-8 kHz (Capranica, 19766). Recently Lewis (1978) demonstrated that the amphibian papilla of many anurans is divisible into caudal and rostral regions based on the polarity patterns of the hair cells and in relation to a tectorial curtain.
dB 30
10
0
- 1 0
10
Rostral
- SPL water
SIL water Amphibian / / s • • 1 papilla Caudal s 1 1 Basilar papilla •\ \
i i i
Air
0-2 0-4 0-6 0-8 1 0 kHz
[image:13.451.93.333.86.270.2]2 0
Fig. 10. Summary diagram relating structure to function. The sensitivity regions of the amphibian and basilar papillae are indicated. The sensitivity regions of the rostral and caudal regions of the amphibian papilla are also indicated. The graphs were derived by averaging the average threshold values for: (1) 0-1-0-26 kHz, (2) 0-4-0-8 kHz, and plotting the average over that range relative to the aerial (pre) threshold average for the same ranges. The i-o kHz and 1-2 kHz points represent the average underwater value at that frequency relative to the average aerial (pre) value at that frequency.
200 Hz corresponds to the sensitivity range of the rostral portion of the amphibian papilla, while the region from about 0-4 to o-8 kHz corresponds to that for the caudal portion of the papilla. Assuming that the responses of both papillae are represented in the multi-unit midbrain response of R. catesbeiana as they appear to be in Hyla
cinerea (Lombard & Straughan, 1974), our results suggest that both the caudal
amphibian papilla and the basilar papilla receive stimulation by equivalent acoustic pathways. On the other hand, the data suggest that sound is conducted to the rostral portion of the amphibian papilla in a different way than to the caudal portion. This rostral portion is perhaps the phylogenetically more primitive part as suggested by the data of Lewis (1978).
It thus appears reasonable to us that the rostral amphibian papilla is specially adapted for hearing under water. Although the route of sound conduction is not known, the inertial principle thought to operate in the ears of fishes at comparatively low frequencies (Fay & Popper, 1974, 1975) may form the basis for a first hypothesis. In this case, sound would be tissue-conducted to the ear, and the loss of sensitivity in air would result from the impedance mismatch between air and tissue.
trans-forming underwater pressure variations into relatively large displacements. If the displacements impinge upon the oval window to a greater extent than upon the round window (or vice versa), efficient stimulation of the inner ear would occur. That the round window is not directly exposed to the middle ear air space as is the oval window in the bullfrog is consistent with this hypothesis (Wever, 1973; Lombard, 1980). A second possibility is that the route of conduction is essentially the same for aerial and underwater sound, but that the impedance matching characteristics of the pathway is modified by the organism as it moves from one medium to another. What would be required here is a mechanism for altering the effective lever or aerial ratio between the tympanic membrane and the oval window such that pressure is amplified and displacement is reduced in air, but not in water.
The 0-05 m data pose a problem for the thoughts expressed above. We would expect that, for example, if SIL is the appropriate comparison, then the animal should have similar SIL thresholds at both water depths as well as in the air. This is not the case. To rationalize these data, we can only offer the speculation that the sound field at 0-05 m is unusual. The impedance of the water approaches that of air as the surface is approached. It may very well be that an accurate measure of any aspect of sound is unlikely under these conditions and that here our measures are suspect.
This study was supported by a grant from the National Science Foundation to R.E.L., and from the National Science Foundation and National Institutes of Health to R.R. F. During this project, Y. L.W., on leave from the Hebrew University of Jerusalem, was Visiting Associate Professor at the University of Chicago, partly supported by the National Science Foundation. Werner wishes to record his indebted-ness to Lombard and the University of Chicago for facilities and kind hospitality, and to Fay for manifold co-operation. The authors wish to express their thanks to F.T. Tek for her careful typing and editing of the manuscript.
Note added in proof. We thank Ellengene H. Peterson, University of New South
Wales, Australia, for bringing the work of Tsirul'nikov et al. (1974) to our attention. These authors claim that Rana temporaria has lower thresholds (by 12-19 dB SPL) in water than in air. These lowered thresholds hold across its entire range of sound sensitivity and were determined by measuring microphonics.
REFERENCES
CAMPBELL, H. W. (1969). The effects of temperature on the auditory sensitivity of lizards. Physiol.
Zool. 42, 183—210.
CAPRANICA, R. R. (1976a). The auditory system. In Physiology of the Amphibia, vol. 3 (ed. B. Lofts), pp. 443-466. New York: Academic Press.
CAPRANICA, R. R. (19766). Morphology and physiology of the auditory system. In Frog Neurobiology (ed. R. Llinas and W. Precht), pp. 551-575. Berlin: Springer-Verlag.
DALLOS, P. (1973). The Auditory Periphery. New York: Academic Press.
FAY, R. R. & POPPER, A. N. (1974). Acoustic stimulation of the ear of the goldfish (Carassius auratus).
y. exp. Biol. 61, 243-260.
FAY, R. R. & POPPER, A. N. (1975). Modes of stimulation of the teleost ear. J. exp. Biol. 62, 379-387.
GEISLER, C. D., VAN BERGEIJK, W. A. & FRISHKOPF, L. S. (1964). The inner ear of the bullfrog. J. Morph.
" 4 ,
43-57-HUBL, L. & SCHNEIDER, H. (1979). Temperature and auditory thresholds: bioacoustic studies of the frogs Rana r. ridibunda, Hyla a. arborea and Hyla a. savignyi (Anura, Amphibia). J. comp. Physiol.
scopy 1979 vol. 11, pp. 633-642. Chicago: Scanning Electron Microscopy, Incorporated.
LOMBARD, R. E. (1980). The structure of the amphibian auditory periphery: a unique experiment in terrestrial hearing. In Comparative Studies of Hearing in Vertebrates (ed. A. Popper and R. Fay). New York: Springer-Verlag. (In Press.)
LOMBARD, R. E. & BOLT, J. R. (1979). Evolution of the tetrapod ear: an analysis and reinterpretation. Biol. J. Linn. Soc. 11, 19-76.
LOMBARD, R. E. & STRAUGHAN, I. R. (1974). Functional aspects of anuran middle ear structures. J. exp. Biol. 61, 71-93.
MOHL, B. (1968). Auditory sensitivity of the common seal in air and water. J. Aud. Res. 8, 27-38. MOHNEKE, R. & SCHNEIDER, H. (1979). Effect of temperature upon auditory thresholds in two anuran
species, Bombina v. variegata and Alytes 0. obstetricans (Amphibia, Discoglossidae). J. comp. Physiol. 130, 9-16.
PETTIGREW, A., CHUNG, S-H., & ANSON, M. (1978). Neurophysiological basis of directional hearing in amphibia. Nature, Lond. 272, 138-142.
SMITH, P. F. (1969). Underwater hearing in man. I. Sensitivity. U.S. Naval Submarine Medical Center, Submarine Base, Groton, Connecticut, 1969, Report No. 569, pp. 1-23.
TERHUNE, J. M. & RONALD, K. (1971). The harp seal, Pagophilus groenlandicus (Erxleben, 1777). X. The air audiogram. Can. J. Zool. 49, 385-390.
TERHUNE, J. M. & RONALD, K. (1972). The harp seal, Pagophilus groenlandicus (Erxleben, 1777). III. The underwater audiogram. Can. J. Zool. 50, 565-569.
TSIRUL'NIKOV, E. M., FISHER, YU. G. & KOVALEV, V. A. (1974). (Comparative evaluation of frog's
hearing in air and in water.) J. Evol. Biochem. & Physiol. (Suppl.) 1974, pp. 157-162.
WERNER, Y. L. (1972). Temperature effects on inner-ear sensitivity in six species of iguanid lizards. y. Herpetol. 6, 147-177.
WERNER, Y. L. (1976). Optimal temperatures for inner-ear performance in gekkonid lizards. J. exp. Zool. 195,
319-351-WEVER, E. G. (1971). The mechanics of hair cell stimulation. Trans. Amer. Otol. Soc. 59, 89-107. WEVER, E. G. (1973). The ear and hearing in the frog, Rana pipiens. J. Morph. 141, 461-478. WEVER, E. G. (1974). The evolution of vertebrate hearing. In Handbook of Sensory Physiology,
vol. v/i. Auditory System (ed. W. D. Keidel and W. D. Neff), pp. 423-454. Berlin: Springer-Verlag. WEVER, E. G. (1976). Origin and evolution of the ear of vertebrates. In Evolution of Brain and Behavior
in Vertebrates (ed. R. B. Masterson, M. E. Bitterman, C. B. G. Campbell and N. Hotton), pp. 89-105. New Jersey: Laurence Erlbaum Association.