Locomotor activity has been an important factor during the evolution of terrestrial vertebrates (e.g. Bennett, 1991). For example, according to the aerobic capacity model, endothermy in birds and mammals evolved as a correlated response to selection for high levels of aerobically supported locomotor activity (Bennett and Ruben, 1979; for reveiews, see Hayes and Garland, 1995; Ruben, 1995). So far, theoretical discussions and empirical tests of the aerobic capacity model have focused primarily on the relationship between basal metabolic rate (BMR) and maximum aerobic metabolic rate (for a review, see Hayes and Garland, 1995). Although high basal and maximal metabolic rates (the latter measured during exercise and/or cold-exposure) are key features of endotherm physiology, equally important is their high level of total daily energy expenditure and correspondingly high capacity for energy assimilation (e.g. Karasov and Diamond, 1985; Nagy et al., 1999; Koteja, 2000), in addition to their ability to sustain
activity when exposed to low ambient temperatures. Could selection for high locomotor activity lead to an increase in overall energy budgets and increased capacity for energy assimilation under a ‘stressful’ condition other than locomotor activity, such as cold-exposure?
Over the last decade, the problem of what sets the upper limits to energy budgets has been the subject of vivid discussion (for reviews, see Weiner, 1989; Weiner, 1992; Peterson et al., 1990; Hammond and Diamond, 1997). The discussion has focused on whether the long-term, sustainable energy budgets are limited ‘centrally,’ by the capacity of visceral organs (intestines, liver, kidney; Koteja, 1996b), or ‘peripherally,’ by the capacity of organs expending energy (e.g. muscles, mammary glands; Hammond et al., 1994; McDevitt and Speakman, 1994). It has been shown that individuals acclimated to a condition requiring increased energy expenditures (e.g. cold-exposure, lactation) are able to JEB3013
We studied house mice (Mus domesticus) that had been artificially selected for high activity to test the hypothesis that a high capacity for energy assimilation in cold-exposed endotherms could evolve as a correlated response to selection for increased locomotor activity. After 10 generations of selection for increased voluntary wheel-running, mice from four selected lines ran 75 % more wheel revolutions per day than did mice from four random-bred, control lines. The maximum cold-induced rates of food consumption (Cmax; mean 10.6 g day−1) and energy assimilation (Amax; mean 141 kJ day−1) were not significantly higher in the selected than in the control mice. However, in cold-exposure trials, mice from the selected lines maintained body mass better than did mice from the control lines. Cmaxand Amaxwere positively correlated with the amount of wheel-running activity measured before cold-exposure and also with the rates of food consumption
measured when the mice had access to running wheels. In females at least, the correlation was significant not only among individuals but also among adjusted means of the replicate lines, which suggests the presence of a positive genetic correlation between the traits. Thus, despite the lack of a significant difference between the selected and control lines in maximum rate of food consumption, the remaining results conform to the hypothesis that a selection for increased locomotor activity could be a factor behind the evolution of the ability to sustain activity and maintain energy balance during prolonged cold-exposure, as occurred during the evolution of mammalian and avian endothermy.
Key words: mouse, Mus domesticus, food consumption, cold exposure, locomotor activity, energy budget, energy assimilation. Summary
Introduction
MAXIMUM COLD-INDUCED FOOD CONSUMPTION IN MICE SELECTED FOR HIGH
LOCOMOTOR ACTIVITY: IMPLICATIONS FOR THE EVOLUTION OF ENDOTHERM
ENERGY BUDGETS
PAWEL
´
KOTEJA1,*, JOHN G. SWALLOW2,‡, PATRICK A. CARTER2,§ ANDTHEODORE GARLAND, JR2 1Institute of Environmental Sciences, Jagiellonian University, ul. Ingardena 6, 30-060 Kraków, Poland and2Department of Zoology, 430 Lincoln Drive, University of Wisconsin-Madison, Madison, WI 53706, USA
*e-mail: [email protected]
‡Present address: Department of Zoology, University of Maryland, College Park, MD 20742, USA §Present address: Department of Zoology, Washington State University, Pullman, WA 99164, USA
assimilate energy at a higher maximum rate (Amax) and are
able to achieve a higher maximum sustained metabolic rate (sensu Hammond and Diamond, 1997) than non-acclimated individuals (e.g. Weiner, 1987; Koteja, 1995; Koteja, 1996a; Hammond and Diamond, 1997). More importantly, Weiner (Weiner, 1987) showed that post-lactating djungarian hamsters
Phodopus sungorus were able to achieve a higher cold-induced Amax than non-reproducing females. Similarly, acclimation to
a low-quality food resulted in an increased cold-induced Amax
in female deer mice Peromyscus maniculatus (Koteja, 1996b). Thus, at least to some extent, the physiological adjustments induced by a physiologically stressful situation may result in an increased performance under a different energy-demanding condition (see Hayes and Chappell, 1986; Hayes and O’Connor, 1999). Therefore, it can be hypothesised that individuals that spend more energy for locomotor activity, and which have an accordingly higher average energy expenditure, might also be able to achieve a higher maximum rate of energy assimilation under cold-exposure.
Tests of the above hypothesis might be performed at three levels. First, at the level of phenotypic flexibility (Piersma and Lindström, 1997), the capacity for energy assimilation of an individual would be predicted to change according to current energy expenditure. Second, at the level of phenotypic variation among individuals, those with higher average energy expenditures would be expected to have higher capacities for energy assimilation. Third, at the level of genetic variation, a positive additive genetic correlation between average energy expenditure and the capacity for energy assimilation would be expected.
The intraspecific studies cited above focused on the first two levels. Even if clear correlations were found in such studies, the results would not provide strong evidence that selection for an increased average energy expenditure (or increased locomotor activity) would result in a correlated evolution of increased capacity for energy assimilation. This is because, although correlations found at the phenotypic level often parallel those at the genetic level, this does not have to be so in general. To illustrate the problem, consider the following imaginary example. Suppose that, in a population of mice, normal development requires the consumption of certain types of high-quality seed (containing high levels of two nutrients, ‘a’ and ‘b’). Individuals growing without access to the high-quality seeds have impaired locomotor abilities (because they do not get enough nutrient ‘a’) and a reduced capacity of the alimentary tract (because they do not get enough nutrient ‘b’). If individuals from the hypothetical population experienced different access to the seeds simply because the seeds were heterogeneously distributed in the environment, then we would probably observe a positive phenotypic correlation between locomotor activity and the capacity for energy assimilation. However, the observed phenotypic correlation would result entirely from differential access to high-quality seeds, in which two important nutrients are correlated, rather than from any inherent biological differences among the individual mice. In
this extreme case, it would be false to expect an increase in the capacity for energy assimilation as a correlated response to selection for high locomotor abilities. Thus, analysis of genetic correlations may yield evolutionary predictions contrary to those suggested by correlations observed at the phenotypic level (e.g. Garland, 1994; Dohm et al., 1996; Falconer and Mackay, 1996).
Artificial selection experiments are a powerful tool for testing hypotheses about the genetic causes of correlated evolution (Garland and Carter, 1994; Lynch, 1994; Gibbs, 1999). As the selected behavioural or physiological trait evolves, other traits can be monitored for correlated responses. A classical example relevant here is the experiment of Rundquist (Rundquist, 1933), who selected for high and low levels of spontaneous locomotor activity in rats. In generation 15 of the experiment, basal metabolic rate was significantly higher in the rats from the high-active line than in the rats from the low-active line (Rundquist and Bellis, 1933).
Recently, we have selected for increased voluntary wheel-running in laboratory house mice Mus domesticus (Swallow et al., 1998a). We have studied a variety of morphophysiological and behavioural traits (e.g. body mass, body composition, body temperature, organ size, maximum aerobic metabolic rate, open-field behaviour, nesting behaviour, time/activity budgets) to test for correlated responses to the selection (Swallow, 1998; Swallow et al., 1998b; Swallow et al., 1999; Koteja et al., 1999a; Koteja et al., 1999b; Carter et al., 2000; Rhodes et al., 2000; Swallow et al., 2001). The experiment presented here was designed to study the relationship between locomotor activity and limits to energy budgets in cold-exposed mice.
We measured rates of food consumption and energy assimilation of mice housed with and without access to running wheels and then in a series of trials at low ambient temperature (to −15 °C). In a first report from the experiment, we showed that mice from the selected lines were more active on the wheels, and that the increased locomotor activity on the wheels indeed added to overall energy expenditures, although the additional cost was very small (Koteja et al., 1999b). In a second report, we showed that the mice did indeed achieve a maximum cold-induced rate of food consumption (Cmax) and
energy assimilation (Amax) and that the traits were highly
repeatable and robust with respect to details of experimental protocol (Koteja et al., 2000).
Materials and methods
Animals
We used 146 mice (Mus domesticus) from eight lines of generation 10 of an artificial selection experiment (Swallow et al., 1998a). In four of the lines, the mice were selected for high levels of voluntary wheel-running measured as the total number of wheel revolutions per day at the age of 35–55 days (for details of the selection protocol, see Swallow et al., 1998a). In the other four lines, the mice were randomly bred and used as controls. The mice were sampled from second litters (not used in the main selection experiment), one male and one female from a family (in some families only one individual was available; additional details are provided by Koteja et al., 1999b; Koteja et al., 2000).
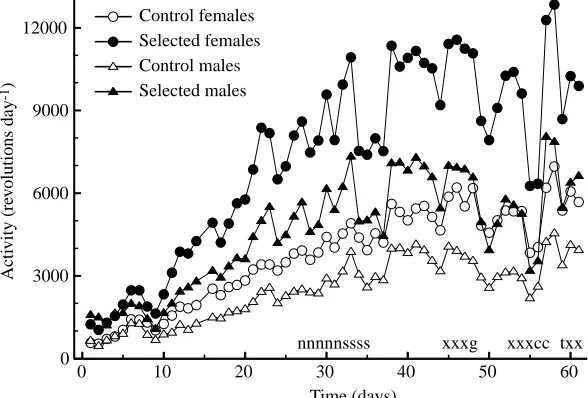
The mice were housed individually from weaning in cages equipped with wheels under a constant 12 h:12 h L:D photoperiod. Wheel-running activity was recorded continuously, with 1 min resolution, from weaning until the end of the first feeding trial (Fig. 1). As a measure of wheel-running activity, we used the average number of wheel revolutions, or the average number of 1 min intervals with any recorded running activity, measured in 8 full days over the last 17 days before taking the animals out of the wheels. Days following manipulations that might influence locomotor activity (e.g. placing on plastic grids instead of bedding, surgery) were excluded from the calculation (Fig. 1).
The feeding experiment began when the mice were 64–80 (average 76) days old. To avoid peripheral injury from frostbite during cold-exposure trials, the tips of the ears and tails of anaesthetised (Metofane) mice were cropped 25 days before the first feeding trial (as described by Konarzewski and Diamond, 1994). No post-operative complications occurred.
Protocol
Rates of food consumption and energy assimilation were measured in plastic mouse cages (27 cm×17 cm×12.5 cm; wire
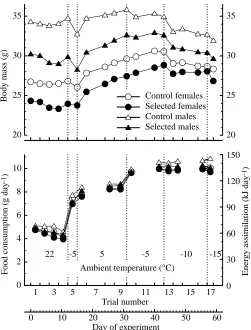
tops) with perforated polypropylene plates suspended over the floor. No nesting material was provided. Grids were placed in the cages 10 days before the first feeding trial. The feeding trials were performed consecutively, so that the end of one trial was the start of the next, as follows (Fig. 2). Trial 1: 3 days at +22 °C, in cages with attached wheels. Further trials were performed in cages without wheels. Trials 2–4: three 3-day trials at +22 °C. Trial 5: 3 days at −5 °C, without prior cold acclimation. Trials 6–9: 16 days at +5 °C, to allow cold acclimation. Energy assimilation was measured during the first 3 days (trial 6) and during the last 7 days (trials 8 and 9). Trials 10–12: 12 days at −5 °C. Energy assimilation was measured during the first and during the last 3 days (trials 10 and 12). Trials 13–16: 14 days at −10 °C. Energy assimilation was measured during the first 6 days (trials 13 and 14) and during the last 3 days (trial 16). Trial 17: 2 days at −15 °C.
Measurements were performed simultaneously on all individuals. To protect the animals from direct streams of cold air produced by the cooling system, the racks were covered with transparent polyvinylchloride curtains during the cold-exposure trials. However, a stratification of temperature under the cover (a difference of up to 2 °C between the top and bottom shelves) could not be avoided. Therefore, the position of the cages in the chamber was used as a cofactor in statistical analyses. In a previous report, however, we showed that the position of the cages did not significantly influence the maximum rate of food consumption or energy assimilation (Koteja et al., 2000), and we will not discuss the issue here.
At the beginning of each trial, animals were weighed (to ±0.1 g), and a weighed portion of food (±0.01 g, Harlan Teklad Laboratory Rodent Diet [W] 8604) was provided. Water was available ad libitum; ice cubes were provided as a source of water at sub-zero temperatures. Samples of the food were taken to measure dry mass content. After each trial, the cages were changed. Uneaten food and faeces were collected, segregated manually, and dried at 60 °C to constant mass. The energy content of dry food (Efood=17.73 kJ g−1dry mass) and faeces
0 10 20 30 40 50 60
Time (days) 0
3000 6000 9000 12000
Acti
vity (re
v
olutions day
-1)
nnnnnssss xxxg xxxcc txx Control females
[image:3.612.272.566.539.738.2]Selected females Control males Selected males
(Efaeces=14.93 kJ g−1dry mass) was measured with a Phillipson
Microbomb Calorimeter (Gentry Instruments, Inc.).
Food consumption rate (C, g day−1), energy assimilation
rate (A, kJ day−1) and coefficients of digestibility of dry mass
(dm, %) and digestibility of energy (de, %) were calculated
according to the method of Droz.dz. (Droz.dz., 1975), as described in detail in previous report from this experiment (Koteja et al., 1999b):
C = (food given ×dry mass content)
−(dry food uneaten) , (1)
dm= 100(C−faeces mass)/C , (2)
de= 100[(C×Efood)
−(faeces mass ×Efaeces)]/(C×Efood) , (3)
A = [(C×Efood) −(faeces mass ×Efaeces)] ×0.97 . (4)
The factor 0.97 in equation 4 is to account for an assumed 3 % energy loss in urine.
To save labour (almost 2000 individual feeding trials were analysed), we did not segregate uneaten food from faeces during the acclimation stage (trials 6–10; days 31–43 in Fig. 2). Instead, all the remaining mass was dried and weighed, and approximate rates of food consumption and energy assimilation were calculated using an average digestibility measured before and after the period:
C = [food given −(food remaining + faeces)]/dm, (5)
A = C×Efood×de×0.97 . (6)
Some individuals achieved their maximum rates of food consumption in trial 10. For those individuals, we segregated faeces from uneaten food and calculated the rates of food consumption and energy assimilation in the usual, more accurate way (above).
Two levels of maximum rate of food consumption and energy assimilation were estimated: (i) that of a non-acclimated individual, measured in the first exposure to −5 °C (trial 5; Cna-max, Ana-max), and (ii) that of a cold-acclimated
individual, measured as a maximum value achieved after cold acclimation (trial 10 or later; Cmax, Amax).
Data analysis
Statistical analysis consisted of two parts. First, we tested the effects of selection, sex, variation among replicate lines (within selection and control groups) and variation among families (within lines) on several traits: body mass, body mass changes, digestibility coefficients, number of wheel revolutions per day, number of 1 min intervals during which any wheel activity occurred and average running speed (the number of wheel revolutions divided by the number of intervals with any revolutions). To this end, we used two-level cross-nested analysis of variance (ANOVA) or analysis of covariance (ANCOVA) with body mass as a covariate (for some variables other covariates, e.g. the position of the cage in the chamber, were also included). Statistical significance of the fixed (selection, sex) and random (lines, families) effects was tested according to Sokal and Rohlf (Sokal and Rohlf, 1981) and Henderson (Henderson, 1989). Comparisons across trials were performed using repeated-measures ANOVA or ANCOVA (more details of the statistical analysis are given in Koteja et al., 1999b; Koteja et al., 2000).
Because males were much larger than females, the results of ANCOVA with body mass as a covariate were very sensitive to the assumption of a common regression slope, and the tests for sex effects are suspect. Therefore, simpler ANCOVA models for separate sexes were also estimated. The models included only one fixed factor (selection) and one nested random effect (lines within selection groups), together with a number of covariates and cofactors (depending on the particular model). Family does not appear in the model, because each individual of a particular sex represents a different family (in no family did we have more than one individual of a given sex). In a few families, only one individual was available; these data were omitted in the 1 3 5 7 9 11 13 15 17
Trial number 0
2 4 6 8 10
F
ood consumption (g day
-1)
0 30 60 90 120 150
Ener
gy assimilation (kJ day
-1)
22 -5 5 -5 -10 -15
Ambient temperature (°C)
0 10 20 30 40 50 60
Day of experiment 20
25 30 35
Body mass (g) Control females Selected females Control males Selected males
20 25 30 35
[image:4.612.45.296.70.400.2]analyses including sex and family effects, but were included in the simpler models for separate sexes.
The second part of the analysis focused on correlations between particular traits. We tested the hypotheses that the maximum rate of food consumption or energy assimilation of non-acclimated mice (Cna-max, Ana-max) is correlated with that
measured after cold-acclimation (Cmax, Amax) and that both are
positively correlated with the rate of food consumption at room temperature in the trial with (trial 1) and without (trial 4) running wheels and with three variables describing locomotor activity on wheels: distance travelled (number of revolutions per day), time spent on the activity (number of active intervals) and average running speed (number of revolutions per active interval). For the last two variables, time and intensity of the activity, we also checked whether they were correlated with Cmax independently from each other, i.e. whether the
correlation was significant when the other variable was included as a covariate in the model tested.
Three types of correlation were tested: (i) between residuals from regression on body mass (variation of mass-independent values of individuals pooled across the eight lines), (ii) between residuals from ANCOVA with lines as categories and body mass as covariate (within-lines variation of mass-independent values), and (iii) between adjusted line means from the same ANCOVA models (among-lines variation of mass-independent values). The entire analysis was performed for separate sexes, because residuals from the models including family level (necessary in the models for both sexes) were not informative in the context of the aim of the analysis. The first two types of correlations are partial correlations, and their significance was tested according to the method of Hayes and Shonkwiler (Hayes and Shonkwiler, 1996).
We hypothesised that mice from the selected lines would run more revolutions per day, spend more time running, run at higher average velocities and have higher rates of food consumption and energy assimilation. We also expected a positive correlation between the rates of consumption or assimilation and wheel-running activity. To test these a priori hypotheses, one-tailed tests are appropriate. Therefore, when the observed difference or correlation was in the expected direction, the significance levels were calculated by halving the usual P values (Sokal and Rohlf, 1981, pp. 225–226), but no
P value is given when the result contradicted our a priori
hypotheses (when a converse testing is carried out after rejecting a one-tailed hypothesis, the usual P value is not a valid estimate of type I error; Sokal and Rohlf, 1981, pp. 224–225). In all other cases, significance levels are for two-tailed tests.
A few individuals appeared as extreme outliers (identified as significant studentized residuals) with respect to running activity, food consumption or changes in body mass in some trials. We assumed that these were the results of a mistake in weighing the food, a malfunction of the wheel recorder or an obstructed water bottle, leading to a large decline in body mass. Hence, these records were excluded from the analysis. A few more records were lost because of technical faults (e.g.
scattering of uneaten food). Preliminary analysis indicated that the distributions of body mass, food consumption, energy assimilation, total revolutions and average running speed were significantly right skewed. Therefore, for the final analyses, these variables were transformed: log10(body mass),
log10(consumption), log10(assimilation), (total revolutions)0.5
and (average speed)0.5(the number of active intervals did not
need transformation). All analyses were performed with SYSTAT 6.0 for Windows (SPSS, Inc.).
Results
Wheel-running activity
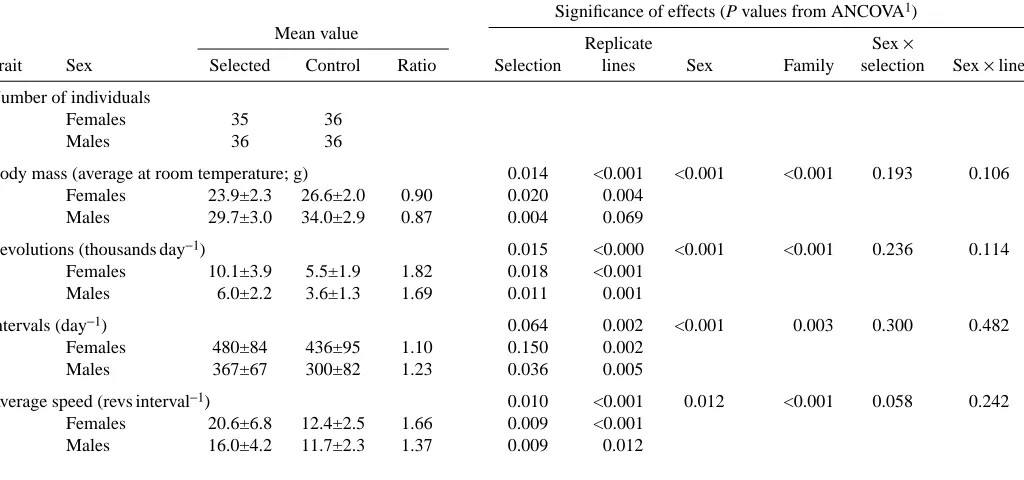
The number of wheel revolutions per day (average from the last 17 days of wheel access; Fig. 1), varied among individuals from approximately 800 to more than 18 000. As expected, mice from the selected lines ran significantly more than the mice from control lines and, within all lines, females ran more than males (Table 1). The difference between the selected and control mice tended to be larger in females (82 %) than in males (69 %), but the sex × line type interaction term was not statistically significant (P=0.114).
The number of 1 min intervals with any wheel activity (average from the last 17 days of wheel access; Fig. 1) ranged from 159 to 672 day−1. On average, it was 37 % higher in
females than in males, but only 16 % (10 % in females, 23 % in males) higher in mice from the selected lines than in those from the control lines, and the effect of selection was significant only in males (Table 1).
The number of revolutions per 1 min active interval (i.e. an estimate of average running speed) varied among individuals from 3.5 to 33. In the control lines, the running speed did not differ significantly between the sexes. Selected females ran 66 % faster than the controls, but selected males ran only 36 % faster than the controls (sex ×selection interaction: P=0.058). For all of the traits (total revolutions, number of active intervals and running speed), the analyses also revealed a significant variation among the lines within selection groups and among families within the lines (Table 1).
In males, the three wheel-activity traits were significantly negatively related to body mass (revolutions, P=0.002; active intervals, P=0.007; running speed, P=0.016) and, with body mass included as a covariate in the ANCOVA models, the effect of selection was not significant. In females, the relationship between wheel-running activity and body mass was not significant (revolutions, P=0.739; active intervals,
P=0.867; running speed, P=0.948), and the difference between
the selected and control lines remained significant in ANCOVA with body mass as a covariate.
Overview of the feeding trials
Average body mass in the trials at 22 °C ranged from 20.3 to 40.1 g (Fig. 3). Males were larger than females (P<0.001), and the selected mice were smaller than the controls (P=0.014; Table 1). During the first exposure to −5 °C, body mass decreased, but in the following trials at +5 °C the mass increased so that it exceeded the values from before cold-exposure (Fig. 2).
The pattern of body mass changes during cold-exposure depended on sex and selection group. Generally, females gained more, or lost less, body mass than males (Fig. 2). Although the effect of selection did not appear to be significant in single trials (except for trial 15 in females and trial 12 in males), cumulative changes in body mass differed significantly between the selected and control lines. Selected males gained 1.7 g more mass between the first cold-exposure (day 12, Fig. 2) and the end of the acclimation at +5 °C (day 31) than control males (effect of selection, P=0.019). They were also able to maintain approximately constant body mass during three trials at −5 °C (days 31–43), whereas the control males lost approximately 1 g of body mass (effect of selection,
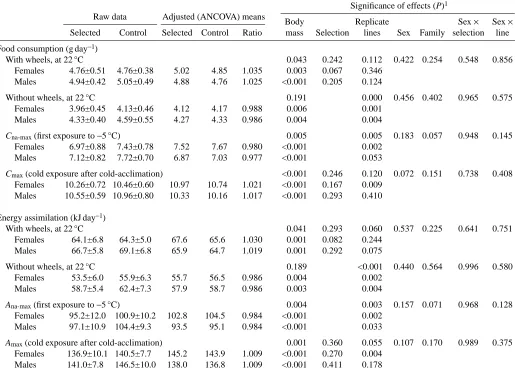
P=0.023). At −10 °C, males from both groups had a negative body mass balance. In females, body mass increased at +5 and at −5 °C. Although selected females gained slightly more mass, the difference was not significant. However, at −10 °C, control females lost 2.1 g, whereas selected females lost only 1.1 g of body mass (days 43–57, Fig. 2; effect of selection: P=0.032). At room temperature, the apparent digestibility of dry mass averaged 74.5 % and digestibility of energy averaged 78.5 %.
In the trials at sub-zero temperatures following the acclimation at +5 °C (trial 10 and later), the digestibilities were approximately 1 % lower than at room temperature. Note that the equations for calculating digestibilities of dry matter and of energy differ only in the constants (because we used a common value for the caloric content of the faeces; see Materials and methods or Koteja et al., 1999b) and, hence, the two variables are perfectly correlated. Therefore, although we present both values, hypothesis testing is performed only once. The coefficients of digestibility never differed significantly between sexes or between selected and control lines. Consequently, the results for energy assimilation were qualitatively similar to those for the rates of food consumption. Therefore, only the latter will be presented in detail here. For the same reason, figures presenting the results of the feeding trials have an additional axis for energy assimilation, but not separate data points (the points would almost completely overlap the corresponding points for food consumption).
[image:6.612.49.561.100.340.2]Food consumption was higher in the trial with wheel access than in the three following trials without wheel access (P<0.001, both for an overall repeated-measures ANOVA and planned contrasts between the trials; Fig. 2). Food consumption was positively correlated with body mass (Table 2; Fig. 3). In all the trials, mass-independent food consumption (ANCOVA adjusted least-square means) tended to be higher in females than in males, but the difference was not significant (Table 2; Fig. 3). In the trial with wheel access, the adjusted food consumption tended to be higher in the Table 1. Summary statistics and significance (ANOVA) of the effects of sex, selection, replicate lines and families on body mass
and wheel-running activity in the mice from selected and control lines
Significance of effects (P values from ANCOVA1)
Mean value
Replicate Sex ×
Trait Sex Selected Control Ratio Selection lines Sex Family selection Sex ×line
Number of individuals
Females 35 36
Males 36 36
Body mass (average at room temperature; g) 0.014 <0.001 <0.001 <0.001 0.193 0.106 Females 23.9±2.3 26.6±2.0 0.90 0.020 0.004
Males 29.7±3.0 34.0±2.9 0.87 0.004 0.069
Revolutions (thousands day−1) 0.015 <0.000 <0.001 <0.001 0.236 0.114
Females 10.1±3.9 5.5±1.9 1.82 0.018 <0.001 Males 6.0±2.2 3.6±1.3 1.69 0.011 0.001
Intervals (day−1) 0.064 0.002 <0.001 0.003 0.300 0.482
Females 480±84 436±95 1.10 0.150 0.002 Males 367±67 300±82 1.23 0.036 0.005
Average speed (revs interval−1) 0.010 <0.001 0.012 <0.001 0.058 0.242
Females 20.6±6.8 12.4±2.5 1.66 0.009 <0.001 Males 16.0±4.2 11.7±2.3 1.37 0.009 0.012
Values are means ±S.D.
*Activity data are based on an average of 8 days, as indicated by x on the x-axis in Fig. 1.
1The first line for each trial shows the results of the analysis for both sexes, the latter two show the results for separate sexes (see Materials
selected lines, but the difference was not statistically significant (Table 2).
Food consumption increased to 7.3 g day−1 during the first
exposure to −5 °C, i.e. to only 1.7 times the consumption in the last trial at room temperature (Figs 2, 3; Table 2). Preliminary measurements indicated that non-acclimated individuals were not able to survive exposure to a lower ambient temperature. Therefore, food consumption measured at −5 °C is considered here as the maximum cold-induced food consumption (Cna-max)
of non-acclimated individuals (or an instantaneous maximum). The values of Cna-maxwere exceeded in the following trials at
+5 °C (Fig. 2). Note, however, that in these trials, the animals were no longer ‘non-acclimated’, because they had already spent 3 days at −5 °C.
During the second exposure to −5 °C (after the acclimation at +5 °C), food consumption averaged 9.8 g day−1. During the
final trial at −5 °C, average food consumption reached 10.2 g day−1, and it did not increase in the following trials at −10 °C or −15 °C (Fig. 2). For each individual, the highest value obtained in one of these trials is considered here as the maximum cold-induced rate of food consumption (Cmax) or
energy assimilation (Amax) of cold-acclimated animal (or an
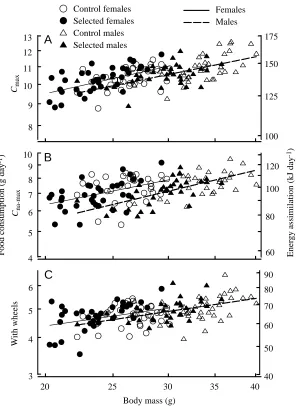
ultimate maximum). The values of Cmax ranged from 8.8 to
12.6 g day−1(mean 10.6 g day−1), and A
maxranged from 117 to
168 kJ day−1(mean 141 kJ day−1; Fig. 3; Table 2).
Correlates of the maximum rate of food consumption
[image:7.612.53.568.100.475.2]Raw values of Cna-maxand Cmaxtended to be slightly higher
Table 2. Summary statistics and significance (ANCOVA) of the effects of body mass, sex, selection, replicate lines and families on food consumption and energy assimilation in the mice from the selected and control lines
Significance of effects (P)1
Raw data Adjusted (ANCOVA) means
Body Replicate Sex × Sex × Selected Control Selected Control Ratio mass Selection lines Sex Family selection line
Food consumption (g day−1)
With wheels, at 22 °C 0.043 0.242 0.112 0.422 0.254 0.548 0.856 Females 4.76±0.51 4.76±0.38 5.02 4.85 1.035 0.003 0.067 0.346
Males 4.94±0.42 5.05±0.49 4.88 4.76 1.025 <0.001 0.205 0.124
Without wheels, at 22 °C 0.191 0.000 0.456 0.402 0.965 0.575 Females 3.96±0.45 4.13±0.46 4.12 4.17 0.988 0.006 0.001
Males 4.33±0.40 4.59±0.55 4.27 4.33 0.986 0.004 0.004
Cna-max(first exposure to −5 °C) 0.005 0.005 0.183 0.057 0.948 0.145
Females 6.97±0.88 7.43±0.78 7.52 7.67 0.980 <0.001 0.002 Males 7.12±0.82 7.72±0.70 6.87 7.03 0.977 <0.001 0.053
Cmax(cold exposure after cold-acclimation) <0.001 0.246 0.120 0.072 0.151 0.738 0.408
Females 10.26±0.72 10.46±0.60 10.97 10.74 1.021 <0.001 0.167 0.009 Males 10.55±0.59 10.96±0.80 10.33 10.16 1.017 <0.001 0.293 0.410
Energy assimilation (kJ day−1)
With wheels, at 22 °C 0.041 0.293 0.060 0.537 0.225 0.641 0.751 Females 64.1±6.8 64.3±5.0 67.6 65.6 1.030 0.001 0.082 0.244
Males 66.7±5.8 69.1±6.8 65.9 64.7 1.019 0.001 0.292 0.075
Without wheels, at 22 °C 0.189 <0.001 0.440 0.564 0.996 0.580 Females 53.5±6.0 55.9±6.3 55.7 56.5 0.986 0.004 0.002
Males 58.7±5.4 62.4±7.3 57.9 58.7 0.986 0.003 0.004
Ana-max(first exposure to −5 °C) 0.004 0.003 0.157 0.071 0.968 0.128
Females 95.2±12.0 100.9±10.2 102.8 104.5 0.984 <0.001 0.002 Males 97.1±10.9 104.4±9.3 93.5 95.1 0.984 <0.001 0.033
Amax(cold exposure after cold-acclimation) 0.001 0.360 0.055 0.107 0.170 0.989 0.375
Females 136.9±10.1 140.5±7.7 145.2 143.9 1.009 <0.001 0.270 0.004 Males 141.0±7.8 146.5±10.0 138.0 136.8 1.009 <0.001 0.411 0.178
Values are means ±S.D. Number of individuals is given in Table 1.
1The first line for each trial shows the results of the analysis for both sexes, the latter two lines show the results for separate sexes (see
Materials and methods).
We hypothesised that mass-adjusted rates of food consumption should be higher in the selected lines than in the control lines. Therefore, the
P-values for the effect of selection are for one-tailed tests; in the cases where this was not so, the effect was not tested.
Amax, Ana-max, maximum rates of energy assimilation of acclimated and non-acclimated mice, respectively; Cmax, Cna-max, maximum rates of
in males than in females and in the control lines compared with the selected lines (differences not significant). However, both these traits were positively correlated with body mass (Table 2; Fig. 3). The values adjusted for differences in body mass (ANCOVA) tended to be higher in females than in males, but the difference approached significance only for Cmax(P=0.072;
Table 3). The adjusted Cmax was slightly higher, whereas the
adjusted Cna-maxslightly lower, in the selected lines than in the
control lines, but neither difference was significant (Table 2). In females, both Cna-maxand Cmax varied significantly among
the replicate lines (within the selection groups). Because digestibility coefficients did not differ between sexes or selection groups, the results for maximum rates of energy assimilation were qualitatively similar to those for food consumption.
As explained in the Materials and methods section, correlations between the maximum rates of food consumption (and energy assimilation) and a planned set of other traits (coefficient of digestibility, food consumption at room temperature and running activity) were tested at three levels: (i) pooled individual variation of mass-independent values, (ii)
within-lines variation of mass-independent values and (iii) among-lines variation of mass-independent values.
At the level of individual variation, the mass-independent maximum rate of food consumption before acclimation (C na-max) was highly correlated with that after acclimation (Cmax)
(Table 3). Most of the correlation resulted from a variation among individuals within the lines, whereas the adjusted line means were not significantly correlated.
At the level of individual variation, both Cna-maxand Cmax
were correlated with food consumption measured at room temperature (Table 3; Fig. 4). Interestingly, however, in all comparisons, the correlation was higher with the consumption measured in the first trial (with wheel access) than with that measured in trial 4 (immediately preceding cold-exposure; Table 3). Adjusted line means of Cmax were correlated with
food consumption in the trial with wheel access, but not with that measured in trial 4 (Table 3; Fig. 4). For Cna-max, the
correlation was not significant with either trial at room temperature. Generally, the correlations between maximum food consumption and the consumption at room temperature tended to be higher in females than in males.
8 9 10 11 12 13
Cmax
100 125 150 175 Control females
Selected females Control males Selected males
Females Males
20 25 30 35 40
Body mass (g) 3
4 5 6
W
ith wheels
40 50 60 70 80 90 4
5 6 7 8 9 10
Cna-max
60 80 100 120
Ener
gy assimilation (kJ day
-1)
F
ood consumption (g day
-1)
A
B
[image:8.612.265.561.70.476.2]C
Fig. 3. Rates of food consumption (dry mass, g day−1) in
the trial at 22 °C with wheel access (C) and during the
first exposure to −5 °C (Cna-max; B), and the maximum
cold-induced rate of food consumption measured after
cold acclimation (Cmax; A) in relation to body mass
of individual mice. The right-hand y-axes show corresponding values of the rate of energy assimilation
Maximum food consumption of non-acclimated individuals (Cna-max) was correlated with the number of active intervals
(i.e. time spent on the wheel-running activity per day), but not with the average running speed (revolutions per active interval) or with the total number of revolutions per day (i.e. distance run per day) (Table 3; Fig. 5). An analysis testing simultaneous effects of the number of active intervals and the running speed
on Cna-max(multiple regression and ANCOVA) also revealed
that only the duration of the activity was a significant predictor of the maximum instantaneous food consumption (Table 3). The correlation between Cna-maxand the number of intervals
was significant only at the level of individual variation, but not among the adjusted line means (Table 3).
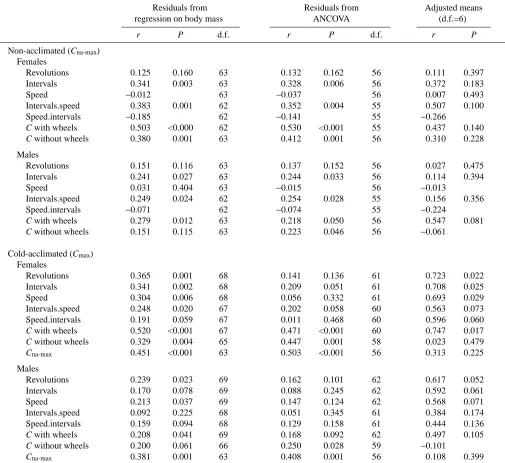
[image:9.612.60.565.98.561.2]The maximum rate of food consumption measured after cold Table 3. Correlations between the maximum rates of food consumption measured in non-acclimated (Cna-max) and
cold-acclimated (Cmax) mice and other traits measured in the study
Residuals from Residuals from Adjusted means regression on body mass ANCOVA (d.f.=6)
r P d.f. r P d.f. r P
Non-acclimated (Cna-max)
Females
Revolutions 0.125 0.160 63 0.132 0.162 56 0.111 0.397 Intervals 0.341 0.003 63 0.328 0.006 56 0.372 0.183
Speed −0.012 63 −0.037 56 0.007 0.493
Intervals.speed 0.383 0.001 62 0.352 0.004 55 0.507 0.100 Speed.intervals −0.185 62 −0.141 55 −0.266
C with wheels 0.503 <0.000 62 0.530 <0.001 55 0.437 0.140
C without wheels 0.380 0.001 63 0.412 0.001 56 0.310 0.228
Males
Revolutions 0.151 0.116 63 0.137 0.152 56 0.027 0.475 Intervals 0.241 0.027 63 0.244 0.033 56 0.114 0.394
Speed 0.031 0.404 63 −0.015 56 −0.013
Intervals.speed 0.249 0.024 62 0.254 0.028 55 0.156 0.356 Speed.intervals −0.071 62 −0.074 55 −0.224
C with wheels 0.279 0.012 63 0.218 0.050 56 0.547 0.081
C without wheels 0.151 0.115 63 0.223 0.046 56 −0.061
Cold-acclimated (Cmax)
Females
Revolutions 0.365 0.001 68 0.141 0.136 61 0.723 0.022 Intervals 0.341 0.002 68 0.209 0.051 61 0.708 0.025 Speed 0.304 0.006 68 0.056 0.332 61 0.693 0.029 Intervals.speed 0.248 0.020 67 0.202 0.058 60 0.563 0.073 Speed.intervals 0.191 0.059 67 0.011 0.468 60 0.596 0.060
C with wheels 0.520 <0.001 67 0.471 <0.001 60 0.747 0.017
C without wheels 0.329 0.004 65 0.447 0.001 58 0.023 0.479
Cna-max 0.451 <0.001 63 0.503 <0.001 56 0.313 0.225
Males
Revolutions 0.239 0.023 69 0.162 0.101 62 0.617 0.052 Intervals 0.170 0.078 69 0.088 0.245 62 0.592 0.061 Speed 0.213 0.037 69 0.147 0.124 62 0.568 0.071 Intervals.speed 0.092 0.225 68 0.051 0.345 61 0.384 0.174 Speed.intervals 0.159 0.094 68 0.129 0.158 61 0.444 0.136
C with wheels 0.208 0.041 69 0.168 0.092 62 0.497 0.105
C without wheels 0.200 0.061 66 0.250 0.028 59 −0.101
Cna-max 0.381 0.001 63 0.408 0.001 56 0.108 0.399
Traits examined were food consumption at room temperature with and without access to wheels, and wheel-running activity (average running speed is estimated as revolutions per interval). ‘Intervals.speed’ denotes the number of intervals controlled statistically for average running speed; ‘Speed.intervals’ denotes average running speed controlled for the number of intervals with running activity (see Materials and methods).
acclimation (Cmax) was correlated with the number of active
intervals, with the running speed and with the total number of revolutions in females. Unlike in the case of Cna-max, the
correlations resulted primarily from significant correlations among the adjusted line means, rather than from correlations among individuals within the lines (Fig. 5; Table 3). In males,
Cmax was not so clearly related to running activity, and it
seemed to be more related to average running speed than to time spent for the activity (Table 3). As in females, the correlations between Cmax and wheel-running activity tended
to be stronger among adjusted line means than among individuals within the lines.
The results for the maximum rate of energy assimilation are qualitatively similar to those for food consumption, but the correlations are usually weaker. This difference is not surprising, because the estimate of energy assimilation includes one more source of error, namely the amount of faeces produced.
Discussion
The main goal of the study was to test the hypothesis that the evolution of high energy budgets and the ability to sustain
activity under prolonged cold-exposure could be driven by selection for increased locomotor activity. We expected that lines of house mice selected for high levels of locomotor activity would also exhibit an increased capacity for energy assimilation during cold-exposure. We measured the maximum rate of food consumption and energy assimilation in mice from four lines selected for high voluntary activity on running wheels (10 generations) and from four random-bred, control lines. Similar to what we observed in the main experimental colony at the age of routine wheel-testing (Swallow et al., 1998a), mice from the selected lines ran 75 % more wheel revolutions per day than mice from control lines (Table 1; Fig. 1). As we expected, at the level of phenotypic variation among individuals, the maximum rate of food consumption or energy assimilation was positively correlated with locomotor activity and also with food consumption measured in the trials with access to the running wheels (Table 3; Figs 4, 5). In females at least, we also observed a significant correlation between the traits at the level of variation among means of the eight lines. This result suggests, but does not prove, that the phenotypic correlations are genetically based. In agreement with the main hypothesis,
0.64 0.66 0.68 0.70 0.80
0.82 0.84 0.86 0.88
Adjusted means for lines
-0.12 -0.06 0 0.06 -0.15
-0.10 -0.05 0 0.05 0.10
Residuals from re
gression
Cna-max
-0.12 -0.06 0 0.06 -0.06
-0.03 0 0.03 0.06
Cmax
-0.12 -0.06 0 0.06
Residuals from
ANCO
V
A
-0.10 -0.05 0 0.05 0.10
-0.12 -0.06 0 0.06 -0.06
-0.03 0 0.03 0.06
0.64 0.66 0.68 0.70 1.00
1.01 1.02 1.03 1.04
Control Selected
log
10
(maximum rate of food consumption)
log10(rate of food consumption at 22°C, with wheels)
A
C
D
B
[image:10.612.289.562.71.444.2]E
F
Fig. 4. The relationship between the rate of food
consumption (g day−1) measured in the trial at 22 °C with
wheel access (x-axes) and the maximum rate of food
consumption of non-acclimated (A,C,E; Cna-max) and
cold-acclimated (B,D,F; Cmax) female mice. (A,B)
cold-exposed mice from the selected lines maintained body mass better than did mice from the control lines. However, although mass-independent values of the maximum rate of food consumption and energy assimilation tended to be slightly higher in the selected than in the control lines, the difference was not statistically significant (Table 2).
Although our main hypothesis was not corroborated by the comparison of maximum rates of food consumption in the selected and control lines, in the following discussion we will argue that the results of the study actually provide some support for our main hypothesis. However, we first explain why we do not take the results of the comparison between the selected and control lines at face value.
One reason is that the selection for increased number of wheel revolutions now appears not to be the best model for testing the hypothesis posed in the Introduction. As we showed in a previous report from this experiment, the energy cost of wheel-running activity is more strongly related to the duration of the activity than to the average running speed (Koteja et al., 1999b). However, the difference in activity between the selected and control lines was primarily a result of an increased average running speed (revolutions per interval), rather than an increase in the amount of time spent active (number of active
intervals per day; Table 1). In a separate study on a later generation, we also found that mice from the selected lines did not exhibit an increased time spent in locomotor activities outside the wheels (Koteja et al., 1999a). Thus, it is not surprising that food consumption in the trial with wheel access did not differ strongly between the selected and control mice (Table 2). Consequently, we could not expect to find a large difference in the maximum rate of food consumption. In the light of our results, a selection for increased time spent on locomotor activity could yield a better model to test the hypothesis that natural selection for extended locomotor activity could result in the inflation of energy budgets (see also Koteja et al., 1999b).
A second reason for being cautious about the apparent lack of difference between selected and control lines is that the comparison is based on the variation among replicate lines, with only six degrees of freedom for the error term, so the power to detect significant correlated responses to selection can be low if the among-line variation is large. Consequently, the genetic correlation between the selected trait (wheel-running in our experiment) and any other trait (e.g. maximum energy assimilation) would have to be very strong to appear as significant after as few as 10 generations of selection. Thus,
2.0 2.5 3.0 3.5 0.80
0.82 0.84 0.86 0.88
Adjusted means for lines
-2 -1 0 1 2 -0.15
-0.10 -0.05 0 0.05 0.10
Residuals from re
gression
-2 -1 0 1 2 -0.06
-0.03 0 0.03 0.06
-1.5 -0.5 0.5 1.5 -0.10
-0.05 0 0.05 0.10
Residuals from
ANCO
V
A
-1.5 -0.5 0.5 1.5 -0.06
-0.03 0 0.03 0.06
2.0 2.5 3.0 3.5 1.00
1.01 1.02 1.03 1.04
Control Selected
log
10
(maximum rate of food consumption)
(Number of revolutions per day × 10-3)0.5
Cna-max Cmax
A
C
D
B
[image:11.612.290.565.74.437.2]E
F
Fig. 5. The relationship between locomotor activity (measured as the average number of wheel revolutions per day; x-axes) and the maximum rate of food consumption
(g day−1) of non-acclimated (A,C,E; Cna-max) and
cold-acclimated (B,D,F; Cmax) female mice. (A,B)
the results of the comparison of the maximum rate of food consumption in the selected and control lines do not support our hypothesis, but they also do not provide a strong argument against it. Therefore, it is worthwhile to consider thoroughly any additional, even if indirect, evidence.
When exposed to cold, mice from the selected lines maintained body mass better than did mice from the control lines (Fig. 2). In the trials at −5 °C, selected males maintained nearly constant body mass, whereas control males lost, on average, 1.0 g. Similarly, in the trials at −10 °C, selected females lost only 1.1 g, whereas control females lost 2.1 g of body mass. The observed 2 % difference in the mass-independent maximum rate of food consumption and energy assimilation might be too small to be significant, but it is just enough to explain the observed 1 g difference in body-mass balance over 10 days of exposure to −5 or −10 °C (10 days × 2 % ×140 kJ=28 kJ or 0.7 g of body fat).
The maximum rate of food consumption was correlated with locomotor activity and also with food consumption in the trial with wheel access. In females, the correlation was significant not only at the level of variation among individuals but also at the level of variation among line means.
Mass-independent maximum food consumption of the individuals, measured both before (Cna-max) and after (Cmax)
cold-acclimation, was clearly correlated with the rate of food consumption measured in the trial with wheel access (Fig. 4; Table 3). Note that the correlation was stronger than that with food consumption measured just before the cold-exposure, but without access to wheels (trial 4). This result is counterintuitive, because correlations among physiological traits usually decrease as the time between the measurements increases (e.g. van Berkum et al., 1989; Chappell et al., 1996). The difference would be easily explained if a random error in the measurement was larger in trial 4 than in trial 1. In contrast, we should expect a larger error in the trial with wheels, because of the additional difficulty of collecting all the uneaten food (Koteja et al., 1999b). Thus, we believe that this result indicates that the capacity for energy assimilation was tightly related to the energy expenditure the mice experienced when living in the cages with access to the wheels, which enabled extended locomotor activity.
Similarly counterintuitive is the pattern of the relationship between Cna-maxand Cmax. It is reasonable to expect that the
two traits should be highly correlated: individuals that are able instantaneously to achieve a higher-than-average rate of food consumption under an acute cold-exposure (trial 5;
−5 °C) should also be able to perform better under prolonged cold-exposure. Indeed, at the level of individual variation, the correlation was significant. However, Cna-maxand Cmaxwere
not correlated at the level of variation among lines, which indicates that the maximum rates of food consumption measured before and after cold-acclimation represent largely independent genetic traits. Instead, the adjusted line means of Cmax were correlated with the line means of food
consumption measured at room temperature (22 °C) with access to wheels (trial 1; Table 3; Fig. 3). Because the
animals from all the lines experienced, on average, the same environment (and some environmental variables were actually statistically controlled in the analysis), the result suggests the presence of a positive genetic correlation between the traits.
The pattern of correlations between the maximum rate of food consumption and the amount of wheel-running activity differed between Cna-maxand Cmax (Fig. 5; Table 3). In
non-acclimated individuals, the maximum rate of food consumption correlated only with time spent running, and only at the level of variation among individuals. This result is consistent with the finding that the energy cost of wheel-running was associated primarily with the amount of time spent on the activity (Koteja et al., 1999b). Individuals that spent more time running had higher energy expenditures (Koteja et al., 1999b) and, when exposed to cold, their instantaneous capacity for energy assimilation was also higher. This pattern corresponds to several observations indicating that the capacity for energy assimilation is regulated rapidly according to current energy expenditure (phenotypic flexibility, according to Piersma and Lindström, 1997). However, adjusted line means of Cna-max
were not significantly correlated with any measure of locomotor activity. Thus, there is no indication of a genetic correlation between the traits. Consequently, we have no reason to expect that selection for increased locomotor activity would result in an increased instantaneous capacity for food consumption in cold-exposed mammals.
In cold-acclimated females, the maximum rate of food consumption (Cmax) was correlated with both the duration and
intensity of the wheel-running activity (i.e. with the number of active intervals and the average running speed). More importantly, unlike in the case of Cna-max, the correlation was
primarily caused by a correlation among line means, rather than among individuals within the lines (Table 3; Fig. 5). In males, the pattern was similar, but all the correlations were weaker. Note also that running activity was very low in females from one of the selected lines and very high in females from one of the control lines (Fig. 5). Not incidentally, we believe, the former had the lowest Cmaxand the latter the highest Cmax
in their respective selection groups. Despite the apparent lack of a statistically significant difference in Cmax between the
selected and control lines, the results suggest a genetically based relationship between the traits.
correlations, allow us to predict that the increasing difference in locomotor activity between the selected and control lines will be accompanied by an increasing difference in the upper limits to energy assimilation. The prediction can be checked in a future experiment, which will enable a stronger test of our main hypothesis.
If locomotor activity and maximum cold-induced energy assimilation are indeed functionally related, then we can enquire about the physiological basis of the connection. The question is closely related to the question of proximate factors that limit sustainable energy budgets (Weiner, 1992; Hammond and Diamond, 1997). Hammond et al. (Hammond et al., 1994) performed an elegant experiment demonstrating that, in cold-exposed house mice, sustainable energy budgets are not limited by a central mechanism associated with energy acquisition, which implied that the limitation must be imposed by a ‘peripheral’ mechanism (Hammond and Diamond, 1997). Our results provide some support for this conclusion. In male siblings of the mice used in this study, the maximum rate of oxygen consumption measured during forced running on a treadmill averaged 310 ml O2h−1 (Swallow et al., 1998b;
wheel-access group), which corresponds to 157 kJ day−1. On
the basis of data from Hayes et al. (Hayes et al., 1992), the corresponding value estimated for a 25.3 g female house mouse (average in our study) is 136 kJ day−1. Thus, the maximum
aerobic metabolic rates measured during short-term treadmill running are comparable with the rates of energy assimilation achieved during several-day trials in the cold (144 kJ day−1in
males and 139 kJ day−1in females; Table 2), which conforms
to the ‘peripheral’ limitation hypothesis (Hammond and Diamond, 1997). The ‘peripheral’ limitation hypothesis is also supported by a significant correlation between average running speed (revolutions per interval) and Cmax (Table 3), which
suggests that the long-term energy budget of the cold-exposed mice may be limited by a mechanism related to the capacity for aerobic metabolism.
Finally, we should consider whether the observed correlation between Cmax and wheel-running activity results
from an ‘intermediate phenotype’ (see also Houle-Leroy et al., 2000) or from a more direct genetic relationship between the traits. First, individuals that are more active on the wheels (because of their genes or their specific environment) undergo a more intensive training (acclimation), which clearly leads to an increased aerobic capacity (e.g. Swallow et al., 1998b) and may also result in an enhanced capacity for energy assimilation in cold-exposed mice. Because Cmaxwas measured 28 or more
days after the mice had been moved to cages without running wheels, it seems unlikely that the correlation could be attributable to a reversible acclimation process. However, all the mice had had continuous access to wheels since weaning, so we cannot exclude the possibility that irreversible developmental effects had occurred (cf. Lindström, 1999). Second, genetically determined structures or processes that cause an individual to be more active on the wheels can also be involved in the pathways that set the limit to the energy budgets of cold-exposed animals. A study of the neurophysiological
basis of motivation for running in the mice, now under way, might reveal such a mechanism.
We are grateful to Bill Karasov for access to his laboratory equipment, to Sarah Davis, Kurt Klomberg, Ewa Koteja and Stephen Newton for technical assistance and to January Weiner, Martin Feder and two anonymous reviewers for critical comments on the manuscript. The experiment was funded by US NSF grants IBN-9111185, IBN-9157268 and IBN-9728434 to T.G. P.K. was supported by stipends from the Foundation for Polish Science and from Jagiellonian University.
References
Bennett, A. F. (1991). The evolution of activity capacity. J. Exp. Biol. 160, 1–23.
Bennett, A. F. and Ruben, J. A. (1979). Endothermy and activity in vertebrates. Science 206, 649–654.
Carter, P. A., Swallow, J. G., Davis, S. J. and Garland, T., Jr (2000). Nesting behavior of house mice (Mus domesticus) selected for increased wheel-running activity. Behav. Gen. 30, 85–94. Chappell, M. A., Zuk, M. and Johnsen, T. S. (1996). Repeatability
of aerobic performance in Red Junglefowl: effects of ontogeny and nematode infection. Funct. Ecol. 10, 578–585.
Dohm, M. R., Hayes, J. P. and Garland, T., Jr (1996). Quantitative genetics of sprint running speed and swimming endurance in laboratory house mice (Mus domesticus). Evolution 50, 1688–1701. Droz.dz., A. (1975). Metabolic cages for small mammals. In Methods for Ecological Bioenergetics. IBP Handbook no. 24 (ed. W. Grodzin´ski, R. Z. Klekowski and A. Duncan), pp. 346–351. Oxford: Blackwell Scientific Publications.
Falconer, D. S. and Mackay, T. F. C. (1996). Introduction to Quantitative Genetics. Fourth edition. Essex: Longman.
Garland, T., Jr (1994). Quantitative genetics of locomotor behaviour and physiology in a garter snake. In Quantitative Genetic Studies of Behavioural Evolution (ed. C. R. B. Boake), pp. 278–301. Chicago, IL: University of Chicago Press.
Garland, T., Jr and Carter, P. A. (1994). Evolutionary physiology. Annu. Rev. Physiol. 56, 579–621.
Gibbs, A. G. (1999). Laboratory selection for the comparative physiologist. J. Exp. Biol. 202, 2709–2718.
Hammond, K. A. and Diamond, J. (1997). Maximal sustained energy budgets in humans and animals. Nature 386, 457–462. Hammond, K. A., Konarzewski, M., Torres, R. M. and Diamond,
J. (1994). Metabolic ceilings under a combination of peak energy demands. Physiol. Zool. 67, 1479–1506.
Hayes, J. P. and Chappell, M. A. (1986). Effects of cold acclimation on maximum oxygen consumption during cold-exposure and treadmill exercise in deer mice, Peromyscus maniculatus. Physiol. Zool. 59, 473–481.
Hayes, J. P. and Garland, T., Jr (1995). The evolution of endothermy: testing the aerobic capacity model. Evolution 49, 836–847.
Hayes, J. P., Garland, T., Jr and Dohm, M. R. (1992). Individual variation in metabolism and reproduction of Mus: are energetics and life history linked? Funct. Ecol. 6, 5–14.
Hayes, J. P. and Shonkwiler, J. S. (1996). Analyzing mass-independent data. Physiol. Zool. 69, 974–980.
Henderson, N. D. (1989). Interpreting studies that compare high-and low-selected lines on new characters. Behav. Genet. 19, 473–503.
Houle-Leroy, P., Garland, T., Jr, Swallow, J. G. and Guderley, H. (2000). Effects of voluntary activity and genetic selection on muscle metabolic capacities in house mice Mus domesticus. J. Appl. Physiol. 89, 1608–1616.
Karasov, W. H. and Diamond, J. (1985). Digestive adaptations for fuelling the cost of endothermy. Science 228, 202–204.
Konarzewski, M. and Diamond, J. (1994). Peak sustained metabolic rate and its individual variation in cold-stressed mice. Physiol. Zool. 67, 1186–1212.
Koteja, P. (1995). Maximum cold-induced energy assimilation in a rodent, Apodemus flavicollis. Comp. Biochem. Physiol. 112A, 479–485.
Koteja, P. (1996a). Limits to the energy budget in a rodent, Peromyscus maniculatus: the central limitation hypothesis. Physiol. Zool. 69, 981–993.
Koteja, P. (1996b). Limits to the energy budget in a rodent, Peromyscus maniculatus: does gut capacity set the limit? Physiol. Zool. 69, 994–1020.
Koteja, P. (2000). Energy assimilation, parental care and evolution of endothermy. Proc. R. Soc. Lond. B 267, 479–484.
Koteja, P., Garland, T., Jr, Sax, J. K., Swallow, J. G. and Carter, P. A. (1999a). Behaviour of house mice artificially selected for high levels of voluntary wheel running. Anim. Behav. 58, 1301–1318.
Koteja, P., Swallow, J. G., Carter, P. A. and Garland, T., Jr (1999b). Energy cost of wheel running in house mice: Implications for coadaptation of locomotion and energy budgets. Physiol. Biochem. Zool. 72, 238–249.
Koteja, P., Swallow, J. G., Carter, P. A. and Garland, T., Jr (2000). Individual variation and repeatability of maximum cold-induced energy assimilation in house mice. Acta Theriol. 45, 455–470.
Lindström, J. (1999). Early development and fitness in birds and mammals. Trends Ecol. Evol. 14, 343–348.
Lynch, C. B. (1994). Evolutionary inferences from genetic analyses of cold adaptation in laboratory and wild populations of the house mouse. In Quantitative Genetic Studies of Behavioural Evolution (ed. C. R. B. Boake), pp. 278–301. Chicago, IL: University of Chicago Press.
McDevitt, R. M. and Speakman, J. R. (1994). Central limits to sustainable metabolic rate have no role in cold acclimation of the short-tailed field vole (Microtus agrestis). Physiol. Zool. 67, 1117–1139.
Nagy, K. A., Girard, I. A. and Brown, T. K. (1999). Energetics of
free-ranging mammals, reptiles and birds. Annu. Rev. Nutrition 19, 247–277.
Peterson, C. C., Nagy, K. A. and Diamond, J. (1990). Sustained metabolic scope. Proc. Natl. Acad. Sci. USA 87, 2324–2328. Piersma, T. and Lindström, Å. (1997). Rapid reversible changes in
organ size as a component of adaptive behaviour. Trends Ecol. Evol. 12, 134–138.
Rhodes, J. S., Koteja, P., Swallow, J. G., Carter, P. A. and Garland, T., Jr (2000). Body temperatures of house mice artificially selected for high voluntary wheel-running behavior: repeatability and effect of genetic selection. J. Therm. Biol. 25, 391–400.
Ruben, J. A. (1995). The evolution of endothermy in mammals and birds: from physiology to fossils. Annu. Rev. Physiol. 57, 69–95. Rundquist, E. A. (1933). Inheritance of spontaneous activity in rats.
J. Comp. Physiol. Psychol. 16, 415–438.
Rundquist, E. A. and Bellis, C. J. (1933). Respiratory metabolism of active and inactive rats. Am. J. Physiol. 106, 670–675. Sokal, R. R. and Rohlf, F. J. (1981). Biometry. Second edition. San
Francisco, CA: Freeman.
Swallow, J. G. (1998). Artificial selection for high voluntary activity in house mice: a study in evolutionary physiology. PhD dissertation, University of Wisconsin-Madison.
Swallow, J. G., Carter, P. A. and Garland, T., Jr (1998a). Artificial selection for increased wheel-running behaviour in house mice. Behav. Gen. 28, 227–237.
Swallow, J. G., Garland, T., Jr, Carter, P. A., Zhan, W.-Z. and Sieck, G. C. (1998b). Effects of voluntary activity and genetic selection on aerobic capacity in house mice (Mus domesticus). J. Appl. Physiol. 84, 69–76.
Swallow, J. G., Garland, T., Jr, Koteja, P. and Carter, P. A. (2001). Food consumption and body composition in mice selected for high wheel-running activity. J. Comp. Physiol. B, in press. Swallow, J. G., Koteja, P., Carter, P. A. and Garland, T., Jr
(1999). Artificial selection for increased wheel-running activity in house mice results in decreased body mass at maturity. J. Exp. Biol. 202, 2513–2520.
van Berkum, F. H., Huey, R. B., Tsuji, J. S. and Garland, T., Jr (1989). Repeatability of individual differences in locomotor performance and body size during early ontogeny of the lizard Sceloporus occidentalis (Baird and Girard). Funct. Ecol. 3, 97–105.
Weiner, J. (1987). Maximum energy assimilation rates in the Djungarian hamster (Phodopus sungorus). Oecologia 72, 297–302. Weiner, J. (1989). Metabolic constraints to mammalian energy
budgets. Acta Theriol. 34, 3–35.