Preferred speed is the most poorly understood locomotory behavior exhibited by terrestrial vertebrates. Preferred speed is the behavioral tendency of animals to utilize a relatively narrow set of speeds near the middle of a much broader range that they are capable of using within a particular gait. Many aspects of vertebrate locomotion have been well studied, including several that might have been expected to provide an explanation of preferred speed. These include internal power (Fedak et al., 1982), external power (Heglund et al., 1982) and the connection between mechanics and energetics (Kram and Taylor, 1990). Perhaps the most promising has been the description of the mechanics of bouncing gaits (Blickhan, 1989; Farley et al., 1993), which can accurately predict changes induced by load-carrying and reduced gravity (He et al., 1991). However, none of these important analyses provides a mechanistic explanation of why animals prefer to use a particular speed within a gait.
Two studies have provided clues about preferred speeds. Hoyt and Taylor (1981) reported that, in one pony, the preferred walking and trotting speeds were very near the speeds at which the cost of covering a unit distance (cost of transport, CT) was minimal. However, it seems unlikely that an animal could directly sense its energetic economy, and so energetics may only correlate with whatever the animal is actually sensing. Perry et al. (1988) showed that the musculoskeletal stresses at preferred speeds were nearly
identical in two different species. However, this observation is difficult to interpret in the absence of more information about how stresses change with running speeds because the two species were using different gaits, had different body masses and one was a biped while the other a quadruped.
If preferred speed is determined by musculoskeletal stresses, then perturbations that change stress should change preferred speed. If preferred speed is determined by metabolic economy (CT), then shifts in preferred speed should produce shifts in CT. To test whether preferred speed is correlated with CT, preferred speed and CTwere measured in horses trotting on the level and up an incline. Preferred speed was also measured during walking, but metabolic rate was not measured. Locomotion up an incline increases metabolic rate (Carello and Snyder, 1999; Eaton et al., 1995; Taylor et al., 1972; Thornton et al., 1987) but increases muscle force relatively little (Roberts et al., 1997). If muscle force determines preferred speed and if this force changes little when going up an incline, then we hypothesize that preferred speed should not change when going up an incline.
Materials and methods
Six Arabian horses, three geldings and three mares, 8±1.9 years of age, with mean body masses of 431±20 kg (means ±1 S.E.M.), were conditioned on a high-speed treadmill (SATO I, Printed in Great Britain © The Company of Biologists Limited 2000
JEB2866
Preferred speed is the behavioral tendency of animals to utilize a relatively narrow set of speeds near the middle of a much broader range that they are capable of using within a particular gait. Possible explanations for this behavior include minimizing musculoskeletal stresses and maximizing energetic economy. If preferred speed is determined by energetic economy (cost of transport, CT), then shifts in preferred speed should produce shifts in CT. To test this hypothesis, preferred speeds were measured in trotting horses on the level and on an incline. The preferred trotting speed decreased from 3.29±0.24 m s−1 on the level to 3.05±0.30 m s−1 (means ± S.D., N=6) on an 11.8 % incline. The rate of oxygen consumption was measured as
a function of trotting speed on a treadmill and was a curvilinear function of speed in all horses under both conditions (level and 10 % incline). This curvilinear relationship resulted in a CTthat was a U-shaped function of speed. The speed at which CTwas minimal (i.e. at which trotting was most energetically economical) was very near the preferred speed on the level and decreased on the incline, again to a speed near the preferred speed on the incline.
Key words: metabolic rate, oxygen consumption, equine, horse, cost of transport, locomotion.
Summary
Introduction
PREFERRED SPEED AND COST OF TRANSPORT: THE EFFECT OF INCLINE
STEVEN J. WICKLER1,*, DONALD F. HOYT2, EDWARD A. COGGER1 ANDMISTY H. HIRSCHBEIN1
Equine Research Center and 1Department of Animal and Veterinary Sciences and 2Department of Biological
Sciences, California State Polytechnic University, Pomona, CA 91768, USA
*e-mail: sjwickler@csupomona.edu
Equine Dynamics Inc., Lexington, KY, USA) for at least 6 months prior to the onset of the study. Horses were randomly assigned to two groups of three, which were rotated on a weekly basis. While one group performed preferred-speed trials on the level in the morning and exercised on the treadmill in the afternoon, the other group was exercised lightly and then performed preferred-speed trials walking and trotting up an incline.
One horse (Ro) was removed from the trial because of lameness prior to the completion of metabolic measurements; however, enough preferred-speed trials on the level and on the incline had been performed to include those data. Another horse (GT; 4 years, female, 460 kg) was then added to the study, and data were collected on preferred speed on the level; oxygen consumption measurements were made on both the level and incline. This animal proved difficult to work with on the incline for preferred-speed measurements.
Preferred speed
Preferred-speed trials were performed on level, compacted soil and on a graded dirt road with an 11.8 % incline. Horses were warmed up by walking, trotting and galloping slowly in a circle with a radius of approximately 5 m on the level for approximately 10 min prior to collection of data. A series of poles placed vertically along a 50 m zone at 10 m intervals made a visual corridor. Three poles in the middle of the timing zone were located at 6 m intervals to create two timing zones. Horses were taught to walk or trot on voice command and were handled by a professional trainer. A preferred-speed trial commenced with a horse being directed to start walking 15 m before the first timing pole. Within one or two strides, the trainer commanded the horse either to continue walking or to proceed at a trot. The animal was trained to continue for 15 m beyond the third pole. Walking and trotting trials were alternated. Food rewards were given only before the start of a trial, and not at the end of the timing zones, to prevent the animals from rushing through to get to the food.
Three observers were seated one behind the other approximately 20 m away from the center pole that divided the two timing zones. Digital stopwatches with a split-timer function were used by the three observers to measure the time elapsed as the animal moved from the first pole to the second pole and from the second pole to the third pole. For a trial to be used in our analysis, the animal’s speeds in the two zones were required to be within 10 % to eliminate trials in which the horse had changed speed. The speeds measured by the observers had to agree within 5 %. After the trials had been completed for the day, the exact distance traveled by the horses between poles as seen by the observers was measured, thus accounting for parallax.
Metabolic rate measurements
Although preferred-speed data were collected at the walk and are included in the results, we only measured the rate of oxygen consumption at the trot. Metabolic rate measurements for all horses were conducted on a high-speed equine treadmill and
were preceded by an 8 min warm-up consisting of 3 min at 1.6 m s−1 and 5 min at 3.5 m s−1on the level. Two, 3 min bouts of exercise were randomly assigned daily, each at 0 % and 10 % incline for trotting speeds ranging between 2.0 and 4.5 m s−1.
All oxygen consumption measurements were made using an open-flow respirometry system. Air was drawn through a facemask at rates of 3100– 6800 l min−1. The airflow rates were monitored using a Meriam Instruments 2110 smart pressure gauge to monitor the pressure drop across a 15 cm Meriam Instruments orifice plate (304SS, Cleveland, OH, USA) with a detection limit of 0.001 %. A sample of gas exiting the mask was withdrawn, and CO2 (Ascarite, Thomas Scientific, Swedesboro, NJ, USA) and water (Dreirite, Hammond Drierite Company, Xenia, OH, USA) were removed prior to determination of oxygen concentration using an AMETEK S3A/II O2analyzer (Pittsburgh, PA, USA). The rate of oxygen consumption was calculated using equation 4b of Withers (1977). Values were calculated as ml O2g−1h−1. Flow rates, V
. e, were determined using a nitrogen-bleed technique (Saltin and Rose, 1994). Nitrogen flow was measured using a Brooks Instrument rotameter flow meter (model R-8M-R5-4F, La Habra, CA, USA) that was calibrated daily with a dry gas meter (model DTM-325, Measurement Control Systems, Santa Ana, CA, USA). Barometric pressure and ambient temperature were recorded daily, and all gas volumes were corrected to standard temperature and pressure. Data from the O2analyzer, a tread speed indicator (an electrical motor connected to the treadmill drum shaft) and the differential pressure transducer were collected simultaneously at 1 Hz using the Sable Systems data-acquisition system (Las Vegas, NV, USA). Tread speed was manually calibrated weekly by timing a minimum of 10 tread revolutions with a horse on the treadmill using a digital stopwatch.
To determine whether a steady-state rate of oxygen consumption could be reliably measured with a 3 min period of sampling, 15 measurements were made on a total of six horses. Oxygen consumption was measured for 15 min, and the data were analyzed using the last 60 s of the first 3 min and the lowest 2 min average over a 15 min period. The results were compared using a paired t-test and indicated that the results from the 3 min bouts of exercise were not significantly different from the 15 min steady-state results (P=0.340, d.f.=14). Thereafter, data were analyzed using the last 60 s of each 3 min bout of trotting.
Statistical analyses
variables were performed with a probability to enter set at 0.05 and the probability to remove set at 0.10. The speeds at the
minimum CTwere determined at 0 % and 10 % incline from
the derivatives of individual polynomial regression equations
for each horse. The speeds at the minimum CTfor locomotion
on the level and up the incline were compared using a paired
t-test. Differences between the preferred speeds and speeds at
the minimum CT were compared using a paired t-test.
Student’s t-tests were conducted using Statview (SAS Institute, Cary, NC, USA). Significance was set at P<0.05.
Results
Preferred speed
The preferred walking speed on the level was
1.48±0.16 m s−1(mean ±S.D., N=6) and decreased to 1.26±0.14
m s−1on the incline (P<0.001). Preferred trotting speeds over
the ground decreased from 3.29±0.24 m s−1on a level surface
to 3.05±0.30 m s−1when trotting up an incline (N=6 for each
condition; Table 1).
Rates of oxygen consumption
The rate of oxygen consumption increased non-linearly when trotting on the level and when trotting up an incline. Second-order polynomial regression equations best described
the relationship between V.O∑and speed at 0 % and 10 % incline
for all animals. In only four of the twelve equations did a linear
component add significantly. In those cases, their addition changed the correlation coefficient, r, by an average of only
0.045, so all relationships are expressed as y=a+bx2, where y
is V˙O∑ in ml O2g−1h−1 and x is speed in m s−1. The linear
component was found to be significant in one horse on the level and in three horses on the incline. The rate of oxygen
consumption averaged 2.56±0.12 (mean ±S.E.M., N=6) times
[image:3.609.315.566.86.211.2] [image:3.609.61.555.414.696.2]higher when trotting up a 10 % incline than on the level (Fig. 1).
Table 1. Preferred speeds on the flat and on the incline
Preferred speed Preferred speed Horse flat (m s−1) N incline (m s−1) N
Rn 3.22±0.18 112 2.97±0.26 51
Ro 3.05±0.24 70 2.76±0.17 32
La 3.48±0.18 27 2.88±0.17 57
Ch 3.03±0.33 72 2.85±0.31 84
Jo 3.65±0.30 30 3.53±0.28 43
Rd 3.28±0.30 53 3.36±0.20 58
GT 3.68±0.31 44 − −
Mean 3.29±0.24 6 3.05±0.30 6
Values are means ±S.D. with the overall mean calculated from the first six horses.
There was a significant effect of condition, level versus incline (repeated-measures ANOVA, P=0.033).
䊊 䊊 䊊䊊 䊊
䊊 䊊 ♦♦ ♦ ♦
♦ ♦
♦
0 1 2 3 4 5 6 Ch
䊊 䊊 䊊䊊䊊䊊䊊䊊 䊊䊊䊊䊊䊊䊊䊊䊊 䊊 䊊 䊊䊊 ♦
♦
♦ ♦ ♦ ♦
♦ ♦
♦♦ ♦
♦♦
䊊 䊊 䊊 䊊䊊䊊䊊䊊
䊊
♦ ♦
♦ ♦♦
♦
0 1 2 3 4 5 6
0 2.0 2.5 3.0 3.5 4.0 4.5 5.0
䊊
䊊 䊊 䊊䊊䊊䊊 䊊 䊊 䊊 䊊 䊊 䊊 䊊
䊊 ♦
♦
♦ ♦ ♦ ♦♦♦♦♦ ♦ ♦ ♦♦
♦♦
0 2.0 2.5 3.0 3.5 4.0 4.5 5.0
䊊
䊊䊊 䊊 䊊䊊䊊䊊䊊䊊䊊䊊䊊 䊊䊊 䊊 ♦
♦♦ ♦♦♦
♦ ♦♦♦♦ ♦
0 2.0 2.5 3.0 3.5 4.0 4.5 5.0 䊊
䊊 䊊 䊊䊊䊊䊊 䊊 䊊 䊊 䊊 ♦♦ ♦ ♦♦
♦♦ ♦
♦ ♦
Rd
La Jo GT
Rn
Rate of oxygen consumption (ml O
2
g
-1 h -1)
Speed (m s-1)
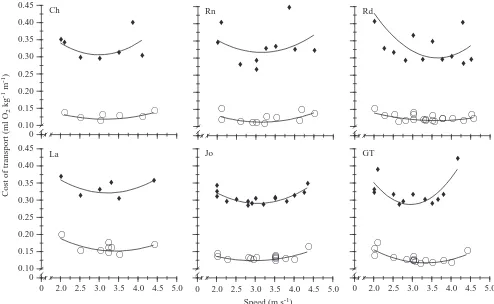
Cost of transport
Cost of transport was calculated for each horse by dividing
V.O∑by speed. Cost of transport, as a function of speed on the
level, was best described by a polynomial regression for each of the six horses. On a 10 % incline, the relationships between
CTand speed were best described by polynomial equations for
four of the horses (Fig. 2).
The speed (VCT,min) at the minimum CT (CT,min) was
calculated for each horse by determining the speed at which the derivative was zero for each individual’s polynomial
regression equation. Speeds at the CT,min were lower on the
incline in four of the six horses (Table 2). The average speeds
at CT,min were 3.40±0.05 m s−1 on 0 % incline and
[image:4.609.53.547.72.376.2]3.17±0.04 m s−1on a 10 % incline (mean ±S.E.M., N=6).
Table 2. The minimum cost of transport for each horse, the speed at which that minimum occurs and the preferred speed for each
horse on the level and the incline
Level Incline
CT,min VCT,min VPS CT,min VCT,min VPS
Horse (ml kg−1min−1) (m s−1) (m s−1) (ml kg−1min−1) (m s−1) (m s−1)
Rn 0.11 3.14 3.22 0.32 3.15 2.97
La 0.14 3.86 3.48 0.32 3.20 2.88
Ch 0.12 3.14 3.03 0.31 2.99 2.85
Jo 0.12 3.36 3.65 0.29 3.05 3.53
Rd 0.11 3.62 3.28 0.30 3.66 3.36
GT 0.12 3.30 3.68 0.29 2.96 −
Mean all horses 0.12 3.40 3.38a 0.31* 3.17* −
Mean excluding GT − − − − 3.19 * 3.11a
CT,min, minimum cost of transport; VCT,min, speed at which CT,minoccurs; VPS, preferred speed.
An asterisk denotes a significant difference from the value on the level (paired t-tests).
aThis table contains data only for horses for which oxygen consumption measurements were made (excludes Ro); another horse (GT) did not
have its preferred speed measured on the incline. Consequently, the mean preferred speeds in this table differ slightly from that in Table 1.
䊊 䊊 䊊䊊 䊊 䊊 䊊 ♦♦
♦ ♦ ♦
♦
♦
0 0.10 0.15 0.20 0.25 0.30 0.35 0.40 0.45
Ch
䊊 䊊
䊊 䊊䊊䊊䊊 䊊 䊊䊊 䊊 ♦
♦
♦ ♦♦ ♦ ♦
♦
♦ ♦
䊊
䊊 䊊䊊䊊䊊䊊䊊䊊䊊䊊䊊䊊䊊䊊䊊 䊊 䊊䊊䊊 ♦
♦ ♦ ♦
♦
♦ ♦
♦ ♦ ♦
♦♦
䊊
䊊 䊊 䊊䊊䊊䊊䊊 䊊 ♦
♦ ♦
♦ ♦
♦
0 0.10 0.15 0.20 0.25 0.30 0.35 0.40 0.45
0 2.0 2.5 3.0 3.5 4.0 4.5 5.0
䊊
䊊 䊊 䊊䊊䊊䊊 䊊䊊䊊䊊䊊 䊊 䊊 䊊 ♦
♦ ♦
♦ ♦ ♦♦♦♦♦ ♦♦ ♦♦ ♦ ♦
0 2.0 2.5 3.0 3.5 4.0 4.5 5.0
䊊 䊊䊊
䊊 䊊䊊䊊䊊䊊䊊䊊䊊䊊 䊊䊊 䊊 ♦
♦ ♦
♦
♦♦♦ ♦♦♦♦ ♦
0 2.0 2.5 3.0 3.5 4.0 4.5 5.0
Rn Rd
Jo GT
La
Cost of transport (ml O
2
kg
-1 m -1)
[image:4.609.42.561.545.692.2]Speed (m s-1)
On the level, there was no significant difference between
preferred speed and VCT,min. On a 10 % incline, there was also
no significant difference.
Discussion
Preferred speeds at both the walk and trot are reduced in horses when locomoting up an incline. The present study is the first to demonstrate an experimental manipulation that changes preferred speed. For all horses and conditions, the rates of oxygen consumption were curvilinear functions of speed and the preferred speeds occurred very near the energetically most economical speeds, i.e. the speed at which the cost of transport
was minimal. The speeds at the minimum CTwere lower on
an incline than on the level in four of the six horses. One of
the horses that did not demonstrate a lower VCT,minalso did not
have a different preferred speed on the incline from that on the level.
Hoyt and Taylor (1981) provided the first empirical examination of preferred speed in a pony for three gaits (walk, trot and gallop). Kenagy and Hoyt (1989) reported that the preferred galloping speed of golden-mantled ground squirrels
in the field was 3.63 m s−1 (close to their maximal aerobic
speed), and Perry et al. (1988) reported the preferred speeds of hopping kangaroo rats and galloping rats.
Why do animals have a preferred speed? One proposal is that having a preferred speed that is lower than maximal speed for that gait results in peak muscle stresses that are only one-third of maximum isometric stresses at that gait. This results in a relatively large reserve capacity to accommodate increased stress (Perry et al., 1988). Lower stresses would permit more repetitions (longer endurance) with less potential for injury. The preferred speed of rats (mean mass 239 g) galloping was
1.48 m s−1, and that of kangaroo rats hopping (106 g) was
1.46 m s−1. Despite a twofold difference in mass and different
gaits, preferred speeds were mechanically equivalent: peak locomotory stresses at the preferred speeds were virtually identical, and the maximal isometric stresses of the ankle extensors were also similar. The significance of this observation is unclear because Perry et al. (1988) did not measure stresses at speeds other than the preferred speed, and it is possible that the stresses in the two species are the same at all speeds.
This argument for reducing stress suggests why preferred speed may be lower than maximum speed at any gait, but it does not explain why the preferred speed falls in the middle of the range of speeds. Because peak muscle stress is proportional to speed (Farley and Taylor, 1991), an animal could reduce stresses even further by running at speeds lower than the preferred speed. Hoyt and Taylor (1981) offered another
explanation for preferred speed. Although V.O∑ has been
described as a linear function of speed in many species on the level (Taylor, 1994; Taylor et al., 1970) and on an incline (Eaton et al., 1995; Margaria et al., 1963), it was demonstrated
in ponies (Hoyt and Taylor, 1981) that V.O∑ increased
curvilinearly with speed at the walk and the trot. When each
V.O∑ value was divided by the speed at which it had been
measured and plotted as a function of speed, the resultant curve (i.e. cost of transport) had a minimum value that occurred in the middle of the range of speeds, and this value correlated with preferred speed. The present study utilized horses (a large breed of the same species) and a larger sample size. The conclusions reached were similar. We found that the minimum
CTon the level occurred at 3.40 m s−1and was not statistically
different from the preferred speed (3.38 m s−1). Trotting up a
10 % incline increased oxygen consumption at 3.5 m s−1by a
factor of 2.56, a value similar to that for Thoroughbreds on a 10 % incline (Eaton et al., 1995). When trotting up an incline,
the speed at minimum CTwas 3.19 m s−1(N=5), and this was
not significantly different from the preferred speed for the same
animals (3.11 m s−1). Preferred speed is the most economical
speed when trotting on the level as well as up a 10 % incline. While it seems reasonable to assume that preferred speeds of geometrically similar animals would be faster in larger species, comparative data are limited. Heglund and Taylor (1988) provided an allometric equation for the prediction of preferred speeds based on the assumption that preferred speed was halfway between the walk–trot and trot–gallop transitions.
The preferred speed of our horses averaged 3.4 m s−1on the
level, and this value indeed occurred approximately halfway
between the minimum trotting speed (close to 1.8 m s−1; S. J.
Wickler, unpublished data) and maximum trotting speed
(5.25 m s−1; D. F. Hoyt, unpublished data). However, this speed
was different from that predicted by the allometric equation of
Heglund and Taylor (4.19 m s−1for a 430 kg animal). It is also
interesting to note that, despite a 3.5-fold difference in body mass, the preferred speed of our horses was virtually identical
to the preferred speed (3.25 m s−1) measured in one 140 kg
pony, a geometrically very similar breed (Hoyt and Taylor, 1981).
Our results show a correlation between preferred speed and the minimum cost of transport, but this is not necessarily a causal relationship. It seems unlikely that an animal can directly sense its cost of transport and use this as the basis for preferring a particular speed. Rather, we hypothesize that the animal senses something that correlates with metabolic rate, such as muscle function or subtle changes in internal or external power requirements. Evidence supporting the idea that an animal can respond to small differences in mechanical power requirements comes from the demonstration that the stride frequency chosen by humans walking at high speeds is the one that minimizes the sum of internal and external power requirements (Minetti et al., 1995).
also like to acknowledge Holly M. Greene, MS, Equine Research Technician.
References
Blickhan, R. (1989). The spring-mass model for running and hopping. J. Biomech. 22, 1217–1227.
Carello, C. A. and Snyder, G. K. (1999). Metabolic cost and efficiency during incline running. Am. Zool. 38, 148A.
Eaton, M. D., Evans, D. L., Hodgson, D. R. and Rose, R. J. (1995). Effect of treadmill incline and speed on metabolic rate during exercise in Thoroughbred horses. J. Appl. Physiol. 79, 951–957. Farley, C. T., Glasheen, J. and McMahon, T. A. (1993). Running
springs: speed and animal size. J. Exp. Biol. 185, 71–86.
Farley, C. T. and Taylor, C. R. (1991). A mechanical trigger for the trot–gallop transition in horses. Science 253, 306–308.
Fedak, M. A., Heglund, N. C. and Taylor, C. R. (1982). Energetics and mechanics of terrestrial locomotion. II. Kinetic energy changes of the limbs and body as a function of speed and body size in birds and mammals. J. Exp. Biol. 79, 23–40.
Fedak, M. A., Rome, L. and Seeherman, H. J. (1981). One-step N2 -dilution technique for calibrating open-circuit V.O∑ measuring systems. J. Appl. Physiol. 51, 772–776.
He, J., Kram, R. and McMahon, T. A. (1991). Mechanics of running under simulated low gravity. J. Appl. Physiol. 71, 863–870. Heglund, N. C., Cavagna, G. A. and Taylor, C. R. (1982). Energetics and mechanics of terrestrial locomotion. III. Energy changes of the centre of mass as a function of speed and body size in birds and mammals. J. Exp. Biol. 79, 41–56.
Heglund, N. C. and Taylor, C. R. (1988). Speed, stride frequency and energy cost per stride. How do they change with body size and gait? J. Exp. Biol. 138, 301–318.
Hoyt, D. F. and Taylor, C. R. (1981). Gait and the energetics of locomotion in horses. Nature 292, 239–240.
Kenagy, G. J. and Hoyt, D. F. (1989). Speed and time–energy budget for locomotion in golden-mantled ground squirrels. Ecology 70, 1834–1839.
Kram, R. and Taylor, C. R. (1990). Energetics of running: a new perspective. Nature 346, 265–267.
Margaria, R., Cerretelli, P., Aghemo, P. and Sassi, G. (1963). Energy cost of running. J. Appl. Physiol. 18, 367–370.
Minetti, A. E., Capelli, C., Zamparo, P., Di Prampero, P. E. and Saibene, F. (1995). Effects of stride frequency on mechanical power and energy expenditure of walking. Med. Sci. Sports Exerc. 27, 1194–1202.
Perry, A. K., Blickhan, R., Biewener, A. A., Heglund, N. C. and Taylor, C. R. (1988). Preferred speeds in terrestrial vertebrates: are they equivalent? J. Exp. Biol. 137, 207–220.
Roberts, T. J., Marsh, R. L., Weyand, P. G. and Taylor, C. R. (1997). Muscular force in running turkeys: The economy of minimizing work. Science 275, 1113–1115.
Saltin, B. and Rose, R. J. (1994). The racing camel (Camelus
dromedarius). Acta Physiol. Scand. 150 (Suppl. 617), 12–18.
Taylor, C. R. (1994). Relating mechanics and energetics during exercise. Adv. Vet. Sci. Comp. Med. 38A, 181–214.
Taylor, C. R., Caldwell, S. L. and Rowntree, V. J. (1972). Running up and down hills: Some consequences of size. Science 178, 1096–1097.
Taylor, C. R., Schmidt-Nielsen, K. and Raab, J. L. (1970). Scaling of energetic cost of running to body size in mammals. Am. J. Physiol. 219, 1104–1107.
Thornton, J., Pagan, J. and Persson, S. (1987). The oxygen cost of weight loading and inclined treadmill exercise in the horse. In Equine Exercise Physiology 2 (ed. J. R. Gillsepie and N. E. Robinson), pp. 206–215. Davis: ICEEP Publications.
Withers, P. C. (1977). Measurement of V.O∑, V .