Printed in Great Britain © The Company of Biologists limited 1985
FLIGHT ENERGETICS OF EUGLOSSINE BEES IN RELATION
TO MORPHOLOGY AND WING STROKE FREQUENCY
BY TIMOTHY M. CASEY, MICHAEL L. MAY
Department of Entomology and Economic Zoology, New Jersey Agricultural Experiment Station, Cook College, Rutgers University, New Brunswick, New Jersey
08903, U.SA.
AND KENNETH R. MORGAN
Department of Biology, University of California, Los Angeles, California 90024, U.SA.
Accepted 10 September 1984
SUMMARY
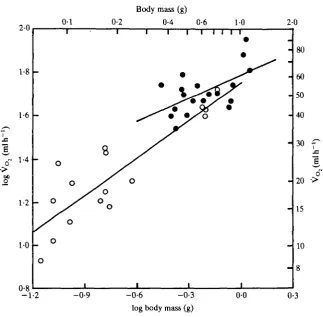
Mass-specific oxygen consumption of euglossine bees during free hovering flight is inversely related to body mass, varying from 66mlO2g~1h~1 in a 1-0-g bee to 154mlO2g~1h~1 in a O10-g bee. Individuals of Eulaema and Eufreisea spp. have smaller wings and higher wing stroke frequency and energy metabolism at any given mass than bees olEuglossa spp. or Exaerete frontalis. Calculated aerodynamic power requirements represent only a small fraction of the energy metabolism, and apparent flight efficiency [aero-dynamic power ( = induced + profile power)/power input] decreases as size declines. If efficiency of flight muscle = 0-2, the mechanical power output of hovering bees varies inversely with body mass from about 480 to 1130 W kg"1 of muscle. These values are 1 -9 to 4-5 times greater than previous predictions of maximum mechanical power output (Weis-Fogh & Alexander, 1977; see also Ellington, 1984c). Mass-specific energy expenditure per wing stroke is independent of body mass and essentially the same for all euglossines. Differences in energy metabolism among bees having similar body mass is primarily related to differences in wing stroke frequency. Scaling of energy metabolism in relation to mass is generally similar to the relationship for sphingid moths despite the fact that bees have asynchronous flight muscle whereas moths have synchronous muscle.
INTRODUCTION
The mechanical power requirements of insects during hovering flight have been analysed in detail (Weis-Fogh, 1972, 1973; Ellington, 1984c). Hovering flight is a particularly costly activity because all downward movement of air necessary to support body weight must be supplied by the beating wings. In addition, inertial
forces associated with wing movement are large (Sotavalta, 1952) and, unless they are counteracted by elastic torques, may place an additional energetic burden on the flight muscle (Weis-Fogh, 1973). Energy metabolism, or power input (Pj), during hovering should reflect mechanical power requirements (the product of metabolism and muscle efficiency should yield the total mechanical power output, Po,m)- Calculation of all mechanical power requires extremely detailed kinematic and morphometric data and relies on a variety of unproven assumptions about how aerodynamic forces are generated (see Ellington, 1984a,b for detailed discussion; also Zarnack, 1972; Weis-Fogh, 1973). Estimates of power requirements based on metabolic data require fewer measurements and assumptions and therefore are useful for providing an independent estimate of mechanical values of flight cost.
The energy metabolism of insects during hovering flight represents the highest rate of sustained aerobic energy expenditure in the animal kingdom. The flight metabolism of Lepidoptera, which have synchronous muscle (i.e. a constant phase relationship between impulses from the central nervous system and contraction of flight muscle; Josephson, 1981) has been relatively well characterized (Zebe, 1954; Heinrich, 1971; Heinrich & Casey, 1973; Casey, 1976a,b, 1980, 1981a,6; Bartholomew & Casey, 1978). Few data are available, however, for the flight metabolism of hovering insects having asynchronous muscle. Performance of these insects is of particular interest for comparison with Lepidoptera because their wing stroke frequency is mechanically determined by the morphology of the wings and the thorax (Sotavalta, 1952; Greenewalt, 1960). Among Hymenoptera, hovering metabolism has been measured in bumble-bees (Heinrich, 1975), honey-bees (Heinrich, 1980; Withers, 1981) and carpenter bees (Nicholson & Louw, 1982; Chappell, 1982), but little concurrent information on other flight characteristics or morphology is available from the same studies. Consequently, few generalizations are currently possible concerning the effects of morphology on the flight energetics of these insects.
The euglossine (orchid) bees are particularly interesting because males routinely hover for long periods and they vary in mass from less than 60 mg to well over 1 g. The euglossines are structurally rather similar except for size and degree of pubescence, but the tribe includes several genera that vary in details of ecology and in morphology (Kimsey, 1982; May & Casey, 1983). The present study was conducted to determine the effects of body size on flight metabolism in a group of taxonomically related insects having asynchronous flight muscle and to examine the interrelationships between energy metabolism, body morphology, wing stroke frequency and mechanical power requirements.
MATERIALS AND METHODS
Morphometrics
Body mass (M) and thoracic mass (Mth) were measured to the nearest 0-1 mg on an analytical balance. Side-to-side thoracic diameter (Lth) was measured to the nearest 0-1 mm with Vernier calipers. To measure wing length (Lw) and area (Aw) one pair of wings was placed between two glass slides and projected at known magnification using a photographic enlarger. The outline of the wing was traced onto paper and the wing length was measured with a ruler. The wing outlines were then cut out and the area measured to the nearest 0-1 cm2 with a Li-Cor area meter.
Oxygen consumption
The bees were placed in a small glass jar and were allowed to warm up (determined by vigorous abdominal pumping movements) spontaneously or after mild agitation. When the bees took off they were placed in a larger jar (218, 452 or 825 ml, depending on the size of the bee) where they flew for at least 2 min, timed by stopwatch. In most cases, the bees hovered continuously for the desired period. Occasionally, a bee was reluctant to remain aloft and the jar was shaken to cause it to resume flight.
Hypodermic syringes were used to remove gas samples from the flight jar through a three-way stopcock cemented to the lid. We lined the inside of the lid with Parafilm® to ensure an airtight seal. Oxygen concentration of the gas sample was determined using a Scholander 0-5-ml gas analysis apparatus (Scholander, 1947). All values for V02 were converted to STPD. Energy expenditure was calculated assuming an energy equivalent of 20-lJmlO2~1. We assume that resting metabolic rate represents a negligible fraction of the energy metabolism during hovering.
Wing stroke frequency
Immediately after gas samples had been taken from the jar and while the bees continued to hover, the lid was removed and the jar top covered with an insect net. The flight tone was recorded on a Sony TCM-600 cassette recorder by holding a directional microphone at the mouth of the jar. Wing stroke frequency («) was determined by playing the tape back on a Tektronix 5113 storage oscilloscope.
Data analysts
regression analysis meaningful. We present average data for this species and include it with the genus Euglossa in some regression analyses to differentiate these bees from the morphologically different bees of the genera Eulaema and Eufriesea.
RESULTS
Morphology
The euglossine bees that we examined fall into one of two superficially distinct types. Individuals of the genera Eulaema or Eufriesea are black or black and yellow and have pubescent thoraces, resembling bumble-bees rather closely. Individuals of the genera Euglossa and Exaerete lack external pubescence and are brightly coloured metallic blue or green. This grouping appears to reflect taxonomic affinity (Kimsey,
1982) and is reflected in our morphometric analysis (see below).
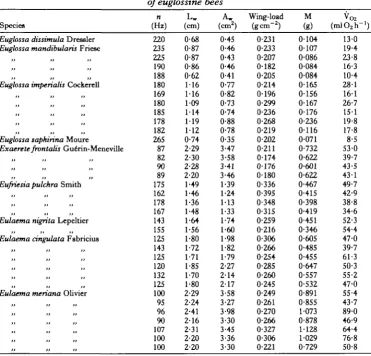
The range of body mass of the genera in our sample is not the same. The Euglossa spp. range in size from about 50 to 250 mg. Exaerete frontalis varies in mass from about 600 to 800 mg. In the genera Eulaema and Eufriesea, mass varies from about 350 mg to well over 1 g and does not overlap the mass of individuals of the genus Euglossa (Table 1). As a consequence of the lack of overlap in size, we are forced to compare characteristics of different bees by extending their respective regression lines well beyond their normal size range (e.g. Fig. 1). While this sometimes indicates morphological or functional differences, it is often difficult to demonstrate statistically significant differences due to the large increases in 95 % confidence interval for the equation beyond the size range for which data are available.
In both groups of bees thoracic mass is approximately a constant fraction of body mass (Table 2) and is proportionately slightly larger in the glabrous bees (42 % of body mass) than in the pubescent bees (38% of body mass). Since thoracic mass varies directly with body mass, we assume that mass of flight muscle is a constant 15 % of total body mass, based on data presented by Greenewalt (1962).
For a given body mass, the wings of the Eulaema-Eufriesea group are shorter and smaller in area than those of the glabrous species (Fig. 1; Table 2). In neither group is geometrical similarity apparent; both groups exhibit significantly higher slopes of wing length in relation to body mass than the predicted value of 0*33. Exaerete frontalis had longer wings than either Eulaema type bees of the same size or predicted
values for Euglossa (Fig. 1A).
here despite the fact that they require extrapolation beyond the range of data, because they are closely correlated with patterns of variation in wing stroke frequency and flight metabolism as discussed below.
[image:5.451.40.412.289.645.2]The relationships of wing size to body mass indicate that shape changes with mass, both among the euglossines as a whole and within the various sub-groups. If geometrical similarity were preserved, wing length should vary with the 1/3 power of body mass and wing area with the 2/3 power of mass. When all bees are considered together, both wing length and area scale according to a significantly higher power than predicted (Table 2). Similar trends in scaling exist for all the groupings in Table 2, and these trends are significant for wing area in Eulaema-Eufriesea and for both area and length when Euglossa and Exaerete are considered together. It appears that large euglossine bees have larger wings than would be predicted by the assumption that they are geometrically similar to related small bees. Wing loading (the ratio of
Table 1. Morphometric parameters, vnng stroke frequency and oxygen consumption of euglossine bees
Species
Euglossa dissimula Dressier Euglossa mandibularis Friese
3> Euglossa impel
3t tl
„
u ,J
j .
, .
ialis Cockerell
Euglossa saphirina Moure
Exaerete frontalis Guirin-Meneville
IJ u JJ
Eufriesia pulch
. j
. j
„
ra Smith
Eulaema nigrita Lepeltier
Eulaema dngulata Fabricius
u u J
JJ JJ
JJ u
JJ u J J
Eulaema meric „
"„ ' u J
u JJ JJ u
ma Olivier n (Hz) ( 220 ( 235 ( 225 ( 190 ( 188 ( 180 169 180 185 178 182 265 ( 87 ; 82 ; 90 2 89 2 175 162 178 167 143 155 125 143 125 120 132 125 100 2 95 ; 96 2 90 ; 107 2 100 2 100 2 U cm) )-68 )-87 )-87 )-86 )-62 1-16 1-16 1-09 1-14 1-19 1-12 )-74 2-29 2-30 '•28 '•20 •49 •46 •36 •48 1-64 1-56 1-80 1-72 1-71 1-85 1-70 1-80 2-29 2-24 2-41 2-16 2-31 2-20 2-20 A . (cm2)
0-45 0-46 0-43 0-46 0-41 0-77 0-82 0-73 0-74 0-88 0-78 0-35 3-47 3-58 3-41 3-46 1-39 1-24 1-13 1-33 1-74 1-60 1-98 1-82 1-79 2-27 2-14 2-17 3-58 3-27 3-98 3-30 3-45 3-36 3-30 Wing-load (gem"2)
0-231 0-233 0-207 0-182 0-205 0-214 0-196 0-299 0-236 0-268 0-219 0-202 0-211 0-174 0-176 0-180 0-336 0-395 0-348 0-315 0-259 0-216 0-306 0-266 0-254 0-285 0-260 0-245 0-249 0-261 0-270 0-266 0-327 0-306 0-221 M (g) 0-104 0-107 0-086 0-084 0-084 0-165 0-156 0-167 0-176 0-236 0-116 0-071 0-732 0-622 0-601 0-622 0-467 0-415 0-398 0-419 0-451 0-346 0-605 0-485 0-455 0-647 0-557 0-532 0-891 0-855 1-073 0-878 1-128 1-029 0-729 V02
(mlO2h ')
body mass to wing area) is not significantly correlated with body mass within groups or in all bees (Table 2).
Wing stroke frequency
The relatively small wings of the euglossine bees operate at high frequencies (80-250 Hz) during hovering. In both the Eulaema group and in Euglossa, n is strongly inversely related to wing length and body mass and is not correlated with wing loading (Table 3). The magnitude and scaling of n on wing length are generally similar to the values for insects in Greenewalt's (1962) group I classification (strongest fliers).
[image:6.451.49.413.324.645.2]In both glabrous and pubescent bees, n is tightly coupled with each morphological parameter except wing loading and sufficiently different between the two groups that the regression for all bees is usually less well correlated and shows a lower slope than the regression for a single group (Table 3). For example, Fig. 2A illustrates the relationship of frequency to body mass for all bees, regardless of taxon. Fig. 2B shows the same data except that regressions are calculated separately for different groups.
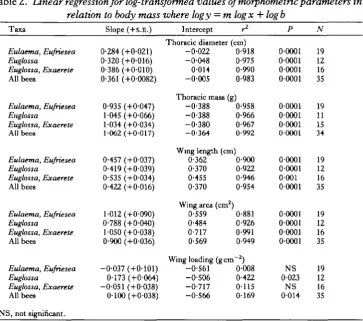
Table 2. Linear regression for log-transformed values of tnorphometric parameters in relation to body mass where logy — m logx + logb
Taxa Eulaema, Eufriesea Euglossa Euglossa, Exaerete All bees Eulaema, Eufriesea Euglossa Euglossa, Exaerete All bees Eulaema, Eufriesea Euglossa Euglossa, Exaerete All bees Eulaema, Eufriesea Euglossa Euglossa, Exaerete All bees Eulaema, Eufriesea Euglossa Euglossa, Exaerete All bees
NS, not significant.
Slope (+S.E.) 0-284 (+0-021) 0-320 (+0-016) 0-386 (+0-010) 0-361 (+0-0082) 0-935 (+0-047) 1-045 (+0-066) 1-034 (+0-034) 1-062 (+0-017) 0-457 (+0-037) 0-419 (+0-039) 0-535 (+0-034) 0-422 (+0-016) 1-012 (+0-090) 0-788 (+0-040) 1-050 (+0-038) 0-900 (+0-036) -0-037 (+0-101) 0-173 (+0-064) -0-051 (+0-038) 0-100 (+0-038)
Intercept r2
Thoracic diameter (cm) -0-022
-0-048 0-014 -0-005
Thoracic mass (g -0-388 -0-388 -0-380 -0-364
Wing length (cm 0-362 0-370 0-455 0-370
Wing area (cm2) 0-559 0-484 0-717 0-569
Wing loading (g cm -0-561 -0-506 -0-717 -0-566 0-918 0-975 0-990 0-983 ) 0-958 0-966 0-967 0-992 ) 0-900 0-922 0-946 0-954 0-881 0-926 0-991 0-949
"2)
I?
-0-2
Mass (g)
0-1 0-2 0-4 1-0.
Mass (g)
0 1 0-2 0-4
• Euglossa
-0-3
- 1 - 3 - 0 - 9
- 0 - 6
- 0 - 5 - 0 1
log mass (g)
0-5
" Euglossa
- 0 - 8
- 1 - 3 - 0 - 9
1-0
- 0 - 5 - 0 - 1 log mass (g)
Fig. 1. (A) The relationship of wing length to body mass in Euglossa spp. ( • ) , Eulaema-Eufiiesea spp. (O), and Exaerete frontalis (if). Each point in this and subsequent figures represents a separate individual. Lines are fitted by the method of least squares; Solid line, Euglossa spp.; long-dashed line,
Euglossa spp. plus Exaerete frontaHs; short-dashed line, Eulaema and EufrUsea spp. (B) The
relationship of wing area to body mass (symbols as in Fig. 1A).
Table 3. Linear regression for log-transformed data relating wing stroke frequency to various morphological parameters
Taxa
Eulaema, Eufriesea Euglossa
Euglossa, Exaerete
All bees
Eulaema, Eufriesea Euglossa
Euglossa, Exaerete
All bees
Eulaema, Eufriesea Euglossa
Euglossa, Exaerete
All bees
NS, not significant.
Slope ( + S . E . )
-1-197 (+0-079) -0-681 (+0-150) -0-914 (+0-44) -0-863 (+0-048)
-0-535 (+0-0064) -0-260 (+0-080) -0-451 (+0-03) -0-347 (+0-032)
-0-600 (+0-315) -0-126 (+0-427) 1-86 (+0-69) 0-0083 (+0-282)
Intercept r2
Wing length (cm) 2-413 0-931 2-291 0-674 2-28 0-96 2-304 0-9O2
Body mass (g) 1-982 0-802 2-062 0-515 1-88 0-93 1-992 0-785
Wing loading (gcm~2) 2-430 0-176 2-213 0-009 3-46 0-316 2-15 0-000027
P
0-0001 0-0011 0-0001 0-0001
00001 0-0086 0-001 0-0001
NS NS
NS
N
15 12 16 35
15 12 16 35
278 T. M. CASEY, M. L. MAY AND K. R. MORGAN
Body mass (g)
0-1 0-2 0-4 0-6 1-0
- 1 - 2 - 0 - 9 - 0 - 6 - 0 - 3 log mass (g)
00 0-3
B
2-4
2-3 •
1 " •
§ 24
I
g" 2-0
1-9 h
Body mass (g)
0 1 0-2 0-4 0-6 1 0
- 1 - 2 - 0 - 9 - 0 - 6 - 0 - 3
log mass (g)
0-0 2-0
0 \ O
X
° \ \
dt ° X* •
\ \
XX. X •v x
o
i i i t
240
220 200
180
160
140
120
100
90
80
70 a
a-a
U.
0-3
Fig. 2. (A) The relationship of wing stroke frequency to body mass in euglossine bees. (B) The relationship of wing stroke frequency to body mass in Eulaema-Eufriesea spp. ( • ) and in Euglossa spp. and Exaerete frontalis (O). Regression equations and statistics describing these relations are given in Table 3.
o-i
Body mass (g)
0-2 0-4 0-6 1-0
o 00 o
r 14
--1-2 - 0 - 9 - 0 - 6 - 0 - 3 log body mass (g)
0-0
2-0
[image:9.451.65.389.76.393.2]0-3
Fig. 3. The relationship of oxygen consumption to body mass in euglossine bees during free hovering flight. Symbols as in Fig. 2B.
comparing Euglossa spp. with the Eulaema-Eufriesea group shows that the slopes of log n vs log mass are not statistically different but the Euglossa regression is significantly lower (P<0-05). The difference is even more marked if Exaerete is included with Euglossa. Differences in wing stroke frequencies of various bees are closely related to differences in their respective wing morphology. Exaerete frontalis with its large wings has the lowest n (Fig. 2B). The glabrous bees have lower frequencies than the pubescent bees (Fig. 2B) and as body mass increases, predicted n for Euglossa becomes more similar to observed values for Eulaetna spp.
Energy metabolism
280
T. M. CASEY, M. L. MAY AND K. R. MORGANopen. The elevations of the regressions do differ significantly (P < 0-05), confirming that at a common mass the pubescent species would be expected to have higher V ^ . Exaerete frontalis is not statistically distinguishable from Eulaema-Eufriesea, although data for all Exaerete individuals fall below the predicted value for the Eulaema group.
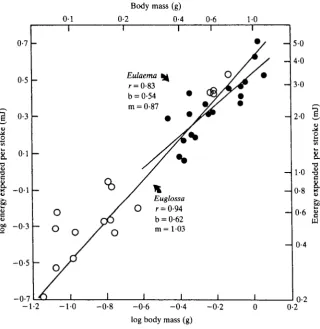
Energy metabolism during flight is a function of wing stroke frequency and the energy expended per wing stroke (En). At any given body mass, wing stroke frequency and energy metabolism are greater in the pubescent bees than in the others (Figs 2B, 3). Stroke energy, obtained by dividing energy metabolism by wing stroke frequency, is of similar magnitude in both groups. In addition, in both groups the stroke energy scales approximately with the first power of body mass (Fig. 4; Table 5; slopes not significantly different from 1-0). Mass-specific energy expenditure for all bees amounts to 3-94mJg~1 stroke"1 (+1-05S.D.). The. Eulaema-Eufriesea group had slightly lower values (3-78 + 0-92) than the glabrous bees (4-14 +1-19). These data indicate that the differences in energy metabolism of bees are the result primarily of differences in wing stroke frequency.
Power output and muscle efficiency
The power output of the flight muscles of these bees appears to be very high. If mechanical efficiency of flight muscle is a constant 0-2 and flight muscle mass is 15 % of total mass, mass-specific mechanical power output of the flight muscle is inversely related to body mass and ranges from about lOOWkg"1 of muscle (HOWkg"1 of body mass) in a 0-1-g bee to about 480 W kg"1 of muscle (72Wkg- 1 body mass) in a
[image:10.451.40.415.448.645.2]1-0-g bee (Table 5). These data are generally similar to those of hovering sphinx
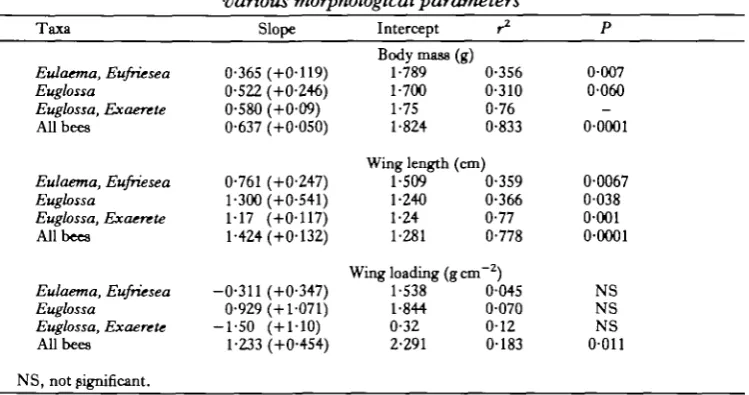
Table 4. Linear regression for log-transformed data relating oxygen consumption to various morphological parameters
Taxa
Eulaema, Eufriesea Euglossa
Euglossa, Exaerete
All bees
Eulaema, Eufriesea Euglossa
Euglossa, Exaerete
All bees
Eulaema, Eufriesea Euglossa
Euglossa, Exaerete
All bees
NS, not significant.
Slope
0-365 (+0-119) 0-522 (+0-246) 0-580 (+0-09) 0-637 (+0-050)
0-761 (+0-247) 1-300 (+0-541) 1-17 (+0-117) 1-424 (+0-132)
-0-311 (+0-347) 0-929 (+1-071)
- 1 - 5 0 ( + 1 1 0 )
1-233 (+0-454)
Intercept
Body mass (g) 1-789 1-700 1-75 1-824
Wing length (cm
Wingl 1-509
•240
•24
[-281
oading (g cm [-538 1-844 0-32 2-291
r2
0-356 0-310 0-76 0-833
) 0-359 0-366 0-77 0-778
-2) 0-045 0-070 0 1 2 0-183
P
0-007 0-060
-0-0001
0-0067 0038 0-001 0-0001
07
05
03
0 1 -•o
I
«• o i
03
05
-- 0 -- 7 - 1 - 2
o-i
Body mass (g)
0-2 0-4 0-6 1-0
1
-o
° °
" V
1
Eulaema 1
r = 0-83 b = 0-54 m = 0-87
1 1 1
* /
-/ Euglossa
/ 0 r = 0-94 gO b = 0-62
/ Q m = 103
1 1 i i i
- 1 0 -0-8 - 0 - 6 - 0 - 4 log body mass (g)
-0-2
50 4-0
- 3-0
2-0 \ 2
1-0 1 a - 0-8
0-6 g
- 0-4
[image:11.451.65.386.84.414.2]0-20-2
Fig. 4. The relationship of energy expenditure per wing stroke (obtained as energy metabolism/wing stroke frequency) to body mass; m = slope, b = y intercept, r = correlation coefficient. Symbols as in Fig.2B.
moths of similar mass (Casey, 1981c) and substantially greater than estimates of maximum mechanical power output (Fig. 5) based on mechanical considerations (Weis-Fogh & Alexander, 1977).
282 T. M. CASEY, M. L. MAY AND K. R. MORGAN
DISCUSSION
Metabolism, mass and morphology
Until recently, data for metabolism of Hymenoptera during free, hovering flight were not available. Earlier data from tethered insects (Hocking, 1953) are less than 50 % of our values. Several recent measurements of the rates of energy metabolism of hovering bees are similar to ours and also support our observation that mass-specific metabolism of bees during hovering is inversely related to body mass (Table 6). Likewise, Chappell (1982) has shown that mass-specific flight metabolism of hovering carpenter bees is inversely related to body mass and similar in magnitude to our values for bees of similar body mass. Honey-bees, however, have appreciably lower Vo2 than euglossines of similar mass (Table 6).
[image:12.451.45.413.404.647.2]Although data for metabolism of Hymenoptera during hovering flight are as high as or higher than previous data for strenuous activity of most insects and vertebrates, several lines of evidence suggest that these values are not unreasonable. First, data on heat transfer coefficients and body temperatures in the field indicate that rates of heat loss are comparable to heat production estimated from V02 measurements. For instance, in Euglossa imperialis (at M = 0-162g, the smallest species for which complete data on heat transfer coefficients are available), heat loss in the field would be equivalent to about 98mlO2g~1h~1, assuming an air flow from forward flight or induced wind of 1-Orris"1, i.e. about 90% of the expected V ^ during hovering (May & Casey, 1983). In addition, three different methods of gas analysis (paramagnetic analyser, Heinrich, 1975; polarographic analyser, Withers, 1981; Chappell, 1982;
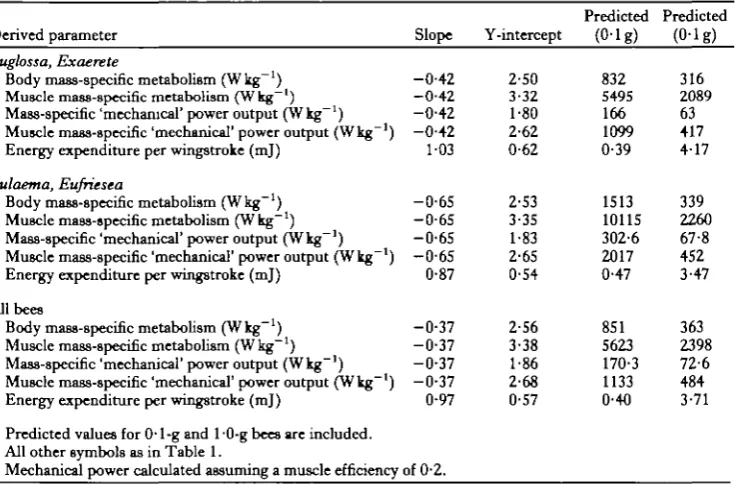
Table 5. Allometry of various derived energetic parameters
Derived parameter Slope Y-intercept
Predicted (0-lg)
Predicted (0-lg) Euglossa, Exaerete
Body mass-specific metabolism (Wkg"1) Muscle mass-specific metabolism (Wkg"1) Mass-specific 'mechanical' power output (Wkg"1) Muscle mass-specific 'mechanical' power output (Wkg"1) Energy expenditure per wingstroke (mj)
Eulaema, Eufriesea
Body mass-specific metabolism (Wkg"1) Muscle mass-specific metabolism (Wkg"1) Mass-specific 'mechanical' power output (Wkg"1) Muscle mass-specific 'mechanical' power output (Wkg"1) Energy expenditure per wingstroke (mj)
All bees
Body mass-specific metabolism (Wkg"1) Muscle mass-specific metabolism (Wkg"1) Mass-specific 'mechanical' power output (Wkg"1) Muscle mass-specific 'mechanical' power output (Wkg"1) Energy expenditure per wingstroke (mj)
Predicted values for 0-1-g and 10-g bees are included. All other symbols as in Table 1.
Mechanical power calculated assuming a muscle efficiency of 0-2.
Nicholson & Louw, 1982; Scholander apparatus, present study) all yield more or less similar results for different bees.
Differences in flight metabolism in the different subgroups of euglossine bees are generally consistent with differences in their respective morphological or functional characteristics. Higher levels of flight metabolism at any given mass in Eulaema-Eufriesea spp. are associated with higher wing stroke frequencies than in Euglossa or Exaerete, which in turn are a consequence of relatively smaller wings. It is tempting to suggest that the concordant departures from geometrical similarity within both groups of euglossines and the differences between groups in the magnitude of morphological and functional parameters reflect the division of the euglossines into two different 'adaptive types', corresponding to the pubescent and glabrous groups of genera. However, Exaerete frontalis has larger wings, lower n and lower V ^ than predicted from extrapolations of Euglossa spp. regressions (Figs 1A,B, 2B, 3) and may well form a third type. The ecological and behavioural significance of these differences awaits investigation.
It is interesting that wing loading of euglossines is a poor indicator of their wing stroke frequency and energetics. While the Eulaema-Eufriesea group have higher
3-4
32
30
28
26
24
-2-2 - 1 - 6
Body mass (g)
0-04 0-1 0-2 0-4 1-0 2-0
1
-1
o
Euglossa
^ O
1
1
o
\
0
I
8
o
Po.mt \
>
o
nax
1 1
Eulaema
i
i
•
/ ^
-_
Sphinx moths
-6 0 "I
- 2000
- 1500
1200
1000
- 800
- 600
- 400
- 1 - 2 -0-8 -0-4 0 log body mass (g)
0-4
- 200
0-8
wing loading than the glabrous species (Table 2), within-group wing loading is independent of body mass and invariably less well correlated with n or V ^ than other morphological parameters (Tables 3,4). Previous studies have attempted to explain differences in flight energetics as a result of differences in wing loading (Heinrich, 1971; Bartholomew & Heinrich, 1973; Casey, 1976a; May, 1981). Our data suggest that both within and between closely related taxa of asynchronous fliers, wing stroke frequency is strongly coupled to energy metabolism, and that wing si2e and shape rather than wing loading are the primary determinants of n.
Power requirements and muscle power output
Mechanical power output is related to flight metabolism by the efficiency with which the flight muscle converts energy into mechanical work. Insect flight muscle, like vertebrate skeletal muscle, has generally been assumed to have a mechanical efficiency of about 0-2, yielding mechanical power output ranging from 400 to nOOWkg"1 of muscle in euglossines (Fig. 5). However, Weis-Fogh & Alexander (1977) have calculated that the maximum mechanical power output (P0,m max) of muscle, irrespective of size, is about 250 W kg"1 of muscle, only a fraction of the values above. These authors used maximal measured metabolic rates for vertebrates and flying locusts (assuming 20 % efficiency) and found that those values were in basic agreement with the calculations from their mechanical theory. Unfortunately, those metabolic rates were well below the values obtained for freely hovering insects (Kammer & Heinrich, 1978). Based on a much wider survey of flight metabolism, Ellington (1984c) noted, as we do, the large discrepancy between Po m as calculated from metabolic rate and values based on mechanical considerations. He concluded that insect flight probably is appreciably less than 20 % efficient.
If Weis-Fogh & Alexander's (1977) model is quantitatively correct and 250 W kg"1 is a reasonable estimate of maximum mechanical power output, then the mechanical efficiency (Po,m/Pi) of the flight muscle must decrease progressively with size in the Euglossa spp., varying from about 10*4 % in a 1 -0-g bee to about 4*4 % in a 0- 1-g bee.
However, in small insects which operate at high n the ability of the mitochondria to
Table 6. A comparison of oxygen consumption during hovering flight ofeuglossine bees with that of other Hymenoptera
Species
Apis mcllifera
Bombus edwardsii and vosnesenskii Xylocopa califomica
Xylocopa capensis
Body" mass
(g) O-O^
0-4 0-6 1-2
Mean
VO2
( m l g - ' h -1)
90
80
63d
53
Euglossineb
VO2
(mlg-'h-1)
160
89 80
(58)"
Source
Withers, 1981 Heinrich, 1975 Chappell, 1982
Nicholson & Louw, 1982
* Mean values except X. capensis. b
Predicted from body mass based on equation for all bees, Table 4. CP. C. Withers, personal communication.
d
Table 7. A comparison of calculated mechanical power requirements (Ellington, 1984c) for honey-bee (0-094g) and bumble-bee (0-205g) with measured energy
metabolism of euglossine bees of similar body mass
Honey-bee Bumble-bee
(Wkg-1) (W kg" 'muscle) (Wkg"1) (Wkg"1 muscle)
Aerodynamic power (induced power) (profile power) Inertial power P0.. + P0.1 Mechanical power* Metabolic rate
26-7 15-3 11-4 102 129 166
832
178 102 76 680 860
1109 5546
26-4 16-7
9-7 95 122 132 658
• Mechanical power output assumes mechanical efficiency of 0-2 for flight muscle.
176 111 65 633 813 877
4386
supply power to the contractile apparatus rather than the maximum rate at which the fibrils can work is probably the limiting factor for maximum mechanical power output (Weis-Fogh & Alexander, 1977). Since metabolic rates are very high at small size, our data suggest that current values of Pommax may be underestimated by their approach.
If muscle efficiency rather than POim is constant over this size range, then what work is being done? We do not have sufficiently detailed kinematic data for full analysis of aerodynamic and inertial forces in euglossines. Ellington (1984c) has calculated these parameters for a honey-bee and a bumble-bee, however. In order to compare metabolic data with mechanical power estimates (Table 7), we calculated Vc^ based on our equation for all bees. For bees of similar mass to the bumble-bee (0-200) and honey-bee (0-095) in Ellington's analysis, predicted values are 120 and 149 ml Ozg1^1 (derived from values in Table 6). Aerodynamic power requirements for these animals are far below 20 % of P; and are essentially size-independent. The profile power component of the total aerodynamic power may be underestimated by the blade element analysis of Weis-Fogh (1973). However, until new data are available to evaluate this suggestion, these calculations represent the best estimates of aero-dynamic power currently available (see Ellington, 1984a,6,c). Despite the uncertainties in calculating the magnitude of aerodynamic work, it seems unlikely that such errors could account for this large discrepancy. Addition of inertial power brings calculated values much closer to our values predicted as 0-2 P;, although the scaling of mechanical power still does not conform to our lines.
more recent data it appears that elastic storage need not be invoked to explain flight energetics since aerodynamic plus inertial power is always less than 20 % of the power input. Casey (1981c) showed that predicted inertial power output, in the absence of elastic storage, would almost exactly account for the difference between calculated Po a and 20 % of P, in sphinx moths. On the other hand, if maximum power output is fixed at a level well below 20 % of the metabolic rate and the mechanical efficiency of the muscle is reduced, Weis-Fogh's conclusion that elastic storage is important in flying insects is supported. The actual inertial power that could be supplied during hovering would then be represented by Po mmax-PO i a. As shown in Table 7, aerodynamic power requirements for honey-bees and bumble-bees are about 185 W kg"1 of muscle, i.e. about three-quarters of the maximum aerodynamic power output predicted by Weis-Fogh & Alexander (1977). Under these circumstances, inertial power would only be about 30 % of the aerodynamic power requirements, indicating that about 90 % of the energy cost of accelerating the wing mass is reclaimed by elastic storage (see Ellington, 1984c for further discussion). If this is correct, however, the reason that power input and power output and their components scale so differently is unclear. Further information on in vivo muscle efficiency is clearly needed.
It is of interest that a similar discrepancy occurs between mechanical power requirements and metabolic rate of running vertebrates. Mechanical power requirements of runners are size-independent while mass-specific metabolism is inversely related to body mass. Taylor, Heglund, McMahon & Looney (1980) suggested that much of the energy is used in generating force in the muscle without any change in muscle length and hence without producing work. Flight muscles might generate force without work during wing deceleration in each half stroke (Ellington, 1984c) or if there were appreciable overlap in activity of antagonistic muscles (Neville & Fogh, 1963). The second explanation seems improbable since Neville & Weis-Fogh showed little overlap at normal flight temperature even in locusts, and highly endothermic insects should experience even less (Heinrich, 1974). It remains possible that more frequent activation of the flight muscles, even without increased power output, could increase metabolic rate in small insects either due to increased cycling of actin-myosin crossbridges or increased muscle activation power requirements (Heglund, Fedak, Taylor & Cavagna, 1982). Another alternative, as suggested by Ellington (1984c), is that elastic recovery of energy may be less efficient in small insects, Here, too, more data on the functioning of the flight system are required.
Comparison of Hymenoptera with Lepidoptera
The relationship of energy metabolism to body mass for all euglossine bees is very similar to that exhibited by sphinx moths (Fig. 6). Over the range of size where these groups overlap (approximately 300 mg to l-0g) their energy metabolism differs by less than 10%. Both the bees and the sphingids are high performance fliers that operate at wing stroke frequencies that are higher than most insects of comparable mass (e.g. see Greenewalt, 1962) and that routinely hover for extended periods in nature. Both groups have V02 values about 30% higher than the saturniid moths, which have larger wings, lower stroke frequency and which hover less readily.
While energy metabolism of the sphingids and euglossines is essentially the same, differences in morphology between the groups result in differences in required wing stroke frequencies. Although sphingids operate at high wing stroke frequencies (25-66 Hz) relative to other synchronous fliers, the bees with their smaller wings operate at still higher frequencies (about 80-240 Hz; Table 1; Fig. 2) over the same range of body mass. For the sphingids, En is about 12-25 mj g"1 body mass while for
0-01
Body mass (g)
0 1 1-0
3-2
2-8
2-4
i 2-0 o.
8. 1-6
1-2
0-8
b = 2-61 m = 0-77 Sphinx moths.
.
v-Euglossine bees b = 2-56 m = 0-63
Other moths b = 2-40 m = 0-74
-2-0 - 1 0 0
log body mass (g)
10
1000
700
400
200 E
100 ^ o. 50 £
30
20
10
[image:17.451.68.394.277.594.2]1 0
bees it is only about 4 m j g- 1. The trade-off between frequency and En in these two groups is a consequence both of mechanical differences caused by different wing morphology and physiological limitations that apparently preclude insects with synchronous, non-fibrillar flight muscle from attaining stroke frequencies much above 120 Hz. Thus sphingids are precluded from operating at very high stroke frequencies but their relatively larger wings compared with the bees make such high frequencies unnecessary since more air can be accelerated per wing stroke.
We thank Dr Lynn Kimsey for identification of and assistance in collecting bees, Jeri Hegel and Rosemary Knapp for technical assistance, Dr R. McN. Alexander for helpful comments and Dr C. P. Ellington for useful discussions and for allowing us access to his data prior to publication. Supported primarily by National Geographic Society Grant 2262-80, with additional support from U.S. National Science Foundation Grants PCM 8011158 and DEB 7912229.
R E F E R E N C E S
ALEXANDER, R. M C N . & BENNETT-CLARK, H. C. (1977). Storage of elastic strain energy in muscle and other tissues. Nature, Land. 265, 114-117.
BARTHOLOMEW, G. A. & CASEY, T . M. (1978). Oxygen consumption of moths during rest, pre-flight warm-up, and flight in relation to body size and wing morphology. J. exp. Biol. 76, 11-25.
BARTHOLOMEW, G. A. & HEINRICH, B. (1973). A field study of flight temperatures in moths in relation to body weight and wing loading. J. exp. Biol. 58, 123-135.
CASEY, T . M. (1976a). Flight energetics of sphinx moths: power input during hovering flight. J. exp. Biol. 64, 529-543.
CASEY, T . M. (19766). Flight energetics in sphinx moths: heat production and heat loss uiHyles lineata during free flight. J . exp. Biol. 64, 545-560.
CASEY, T . M. (1980). Flight energetics and heat exchange of gypsy moths in relation to air temperature. J. exp.
Biol. 88, 133-145.
CASEY, T . M. (1981a). Energetics and thermoregulation of Malacosoma americanum (Lepidoptera: Lasiocampidae) during hovering flight. Physiol. Zool. 54, 362-371.
CASEY, T . M. (19816). Insect flight energetics. In Locomotion and Energetics in Arthropods, (edsC. F. Herreid& C. R. Fourtner), pp. 419-452. New York: Plenum Press.
CASEY, T . M. (1981C). A comparison of mechanical and energetic estimates of flight cost for hovering sphinx moths. J. exp. Biol. 91, 117-129.
CHAPPELL, M. (1982). Temperature regulation of carpenter bees (Xylocopa califormca.) foraging in the Colorado desert of Southern California. Physiol. Zool. 55, 267-280.
ELLINGTON, C. P. (1984a). The aerodynamics of hovering insect flight. I. The quasi-steady analysis. Phil.
Trans. R. Soc. Ser. B 305, 1-15.
ELLINGTON, C. P. (19846). The aerodynamics of hovering insect flight. V. A vortex theory. Phil. Trans. R. Soc.
Ser. B 305, 115-144.
ELLINGTON, C. P. (1984c). The aerodynamics of hovering insect flight. VI. Lift and power requirements. Phil.
Trans. R. Soc. Ser. B 305, 145-181.
GREENEWALT, C. H. (1960). The wings of insects and birds as mechanical oscillators. Proc. Am. phil. Soc. 104, 605-611.
GREENEWALT, C. H. (1962). Dimensional relationships for flying animals. Smithson. misc. Collns 144, 1-46.
HEGLUND, N. C , FEDAK, M. A., TAYLOR, C. R. & CAVAGNA, G. A. (1982). Energetics and mechanics of
terrestrial locomotion. IV. Total mechanical energy changes as a function of speed and body size in birds and mammals. J. exp. Biol. 97, 57-66.
HEINRICH, B. (1971). Temperature regulation in the sphinx moth, Manduca sexta. I. Flight energetics and body temperature during free and tethered flight. J . exp. Biol. 43, 141-152.
HEINRICH, B. (1974). Thermoregulation in endothermic insects. Science, N.Y. 185, 747-756.
HEINRICH, B. (1975). Thermoregulation in bumblebees. I I . Energetics of warm-up and free flight. J . comp.
HEINRICH, B. (1980). Mechanisms of body temperature regulation in honey hces,Apis mellifera. II. Regulation of thoracic temperatures at high air temperatures. J. exp. Biol. 85, 73-87.
HEINRICH, B. & CASEY, T. M. (1973). Metabolic rate and endothermy in sphinx moths. J. camp. Physiol. 82, 195-206.
HOCKING, B. (1953). The intrinsic range and speed of flight of insects. Trans. R. ent. Soc. Land. 104, 223-345. JOSEPHSON, R. K. (1981). Temperature and mechanical performance of insect muscle. In Insect
Thermoregulation, (ed. B. Heinrich), pp. 19—44. New York: Wiley-Interscience.
KAMMER, A. E. & HEINRICH, B. (1978). Insect flight metabolism. Adv. Insect Physiol. 13, 133-228.
KAMMER, A. E. & RHEUBEN, M. B. (1981). Neuromuscular mechanisms of insect flight. In Locomotion and
Energetics in Arthropods, (eds C. F. Herreid & C. R. Fourtner), pp. 163-194. New York: Plenum Press.
KJMSEY, L. S. (1982). A revision of the genus Eufriesea Cockerell. Univ. Calif. Publs Entomol. 95, 1-125. MAY, M. L. (1981). Wingstroke frequency of dragonflies (Odonata: Anisoptera) in relation to temperature and
body size. 7. comp. Physiol. 144, 229-240.
MAY, M. L. & CASEY, T . M. (1983). Thermoregulation and heat exchange in euglossine bees. Physiol. Zool. 56, 541-551.
NEVILLE, A. C. & WEIS-FOGH, T . (1963). The effect of temperature on locust flight muscle. J . exp. Biol. 40, 111-121.
NICHOLSON, S. W. & Louw, G. (1982). Simultaneous measurement of evaporative water loss, oxygen consumption and thoracic temperature during flight in a carpenter bee. J. exp. Zool. Z22, 287-296. PRINGLE, J. W. S. (1981). The Bidder Lecture, 1980. The evolution of fibrillar flight muscle in insects..?, exp.
Biol. 94, 1-14.
SCHOLANDER, P. F. (1947). Analyzer for accurate estimation of respiratory gases in one half cubic centimeter samples. J. biol. Chem. 167, 235-250.
SOTAVALTA, O. (1952). The essential factor regulating the wing stroke frequency of insects in wing mutilation and loading experiments at subatmospheric pressure. Ann. Zool. Soc. Vanamo' 15, 1—67.
TAYLOR, C. R., HEGLUND, N. C , MCMAHON, T . A. & LOONEY, T . R. (1980). Energetic cost of generating
muscular forces during running: a comparison of large and small animals. J. exp. Biol. 86, 9-18. WEIS-FOGH, T . (1972). Energetics of hovering flight in humming birds andDmsophila.J. exp. Biol. 56, 79-104. WEIS-FOGH, T . (1973). Quick estimates of flight fitness in hovering nnimnia including novel mechanisms of lift
production. J. exp. Biol. 59, 169-230.
WEIS-FOGH, T . & ALEXANDER, R. M C N . (1977). The sustained power output obtainable from striated muscle. In Scale Effects in Animal Locomotion, (ed. T. J. Pedley), pp. 511—526. New York: Academic Press. WITHERS, P. C. (1981). The effect of ambient air pressure on flight and oxygen consumption in the honeybee.
J. comp. Physiol. 141, 433-437.
ZARNACK, W. (1972). Flugbiophysik der Wanderheuschrecke (Locusta migratoria L.). I. Die Bewegungen der Vorderflugel.J. comp. Physiol. 78, 356-395.