1
Physiotherapy as a
fi
rst point of contact
2
in general practice: a solution to a
3
growing problem?
4 Rob W. Goodwin1andPaul A. Hendrick2
Q1
5 1Musculoskeletal Clinics Team, Nottingham City Care, Nottingham, UK
6 2School of Health Sciences, University of Nottingham, Nottingham, UK
7 Aim: To evaluate the clinical effectiveness, patient satisfaction and economic efficacy
8 of a physiotherapy service providing musculoskeletal care, as an alternative to GP care.
9 Background:There is a growing demand on general practice resources. A novel
10 ‘1st Line Physiotherapy Service’was evaluated in two GP practices (inner city practice,
11 university practice). Physiotherapy, as a first point of contact, was provided as an
12 alternative to GP care for patients with musculoskeletal complaints. Participants:
13 A convenience cohort sample of over 500 patients with a musculoskeletal complaint was
14 assessed within the physiotherapy service. For the economic evaluation a cohort of 100
15 GP patients was retrospectively reviewed.Method:Clinical outcome measures were
16 collected at assessment, one and six months following assessment. Patient satisfaction
17 was collected at assessment. An economic evaluation was undertaken on the
18 physiotherapy cohort of patients and compared to a retrospective cohort of patients
19 (n=100) seen by a GP. This evaluation considered only the health care perspective
20 (primary and secondary care). Societal issues such as absence from employment were not
21 considered.Results:There were no adverse events associated with the physiotherapy
22 service. Patients reported high levels of satisfaction with the physiotherapy service.
23 Patients managed within the 1st Line Physiotherapy Service demonstrated clinical
24 improvements (EQ-5D-5L, Global Rating of Change) at the six-month point. There was
25 a statistically significant difference in favour of the physiotherapy groups using a
non-26 parametric bootstrap test; inner city practice, mean difference in costs=£538.01
27 (P =0.006; 95% CI; £865.678, £226.98), university practice mean difference in costs=
28 £295.83 (P=0.044; 95% CI; £585.16, £83.69). Conclusion:The limitations of this
29 pragmatic service evaluation are acknowledged. Nevertheless, the physiotherapy
30 service appears to provide a safe and efficacious service. The service is well received by
31 patients. There appear to be potential financial implications to the health economy.
32 Physiotherapists, as a first point of contact for patients with musculoskeletal-related
33 complaints, could contribute to the current challenges faced in primary care.
34 Key words:NHS costs; physiotherapy; primary care
35 Received 28 July 2015; revised 5 February 2016; accepted 15 May 2016
36 Introduction
37 A number of factors are currently aligning and 38 potentially drawing general practice to the edge of
39
a perfect storm. These factors include an ageing
40
population, the subsequent increase in age-related
41
health problems, the almost epidemic increases
42
seen in what are essentially lifestyle-related
43 health complaints and the challenges in the 44 training, recruitment and retention of general 45 practitioners (GPs).
46 Currently, the percentage of the UK population 47 over the age of 65 is over 17%. This is compared with 48 15% in 1985 (Office for National Statistics, 2012). 49 The prediction is that by 2035 this will have risen 50 again to 23% (Office for National Statistics, 2012). 51 As a consequence of this rise in population 52 there is an anticipated rise in health conditions 53 associated with old age. In particular arthritis and 54 degenerative joint pains can be expected to 55 increase significantly (Department of Health, 56 2006) as can a range of common musculoskeletal 57 (MSK) disorders including back pain, shoulder 58 pain and knee pain (Urwinet al., 2011; Picavet and 59 Schouten, 2003). Currently, the
Q2 primary burden
60 for thefirst point of management of these condi-61 tions is shouldered by GPs. The prevalence of 62 patients with musculoskeletal complaints within 63 a GPs workload has been estimated to range from 64 18 to 33% (Mallenet al., 2007; Jordanet al., 2010; 65 Margham, 2011). For
Q3 a general practice with
66 a patient population of 10 000 patients this equates 67 to a full-time equivalent caseload.
68 Running in parallel to these changes in the 69 anticipated MSK health of the nation are the 70 acknowledged work force issues within general 71 practice. The training and recruitment of GPs is 72 recognised as a significant current challenge to the 73 efficacy of general practice provision. The Royal 74 College of General Practitioners (RCGP) predicted 75 that up to 600 practices could face closure in 2015 76 because of the deepening crisis in GP recruitment 77 and retention (Royal College of General 78 Practitioners, 2014). These
Q4 challenges to general
79 practice, in its current guise, make it almost 80 untenable moving further into the 21st century. 81 A number of potential solutions have been 82 proposed to ensure the survival of a free-at-point-83 of-contact primary care service which forms the 84 bedrock of the National Health Service (NHS). 85 These include developing training pathways for 86 GPs with a special interest in MSK conditions 87 or the transfer offirst-contact care to alternative 88 health care providers.
89 The arguments for the re-development of 90 primary care services have been debated and the 91 increased role of physiotherapy in the first 92 line management of MSK conditions previously 93 advocated (Fosteret al., 2012). Such a move would
94
align the primary care management of MSK
95
problems with the core competencies of the
96
physiotherapy profession. Furthermore,
physio-97
therapists have demonstrated competence in
98
extended roles (McClellan et al., 2006; Stanhope
99 et al., 2012; Sutton et al., 2015). Good patient
100
satisfaction has also been demonstrated where
101
these initiatives have been implemented (Reeve
102
and May, 2009; Kennedy et al., 2010). However,
103
this evidence has been predominantly generated in
104
secondary care environments.
105
Ludvigsson and Enthoven (2012) undertook an
106
evaluation of physiotherapists as primary assessors
107
of patients with MSK problems in a GP practice in
108
Sweden. They found that the service was safe and
109
almost all patients (85%) could be managed solely
110
by the physiotherapist. They reported good
111
patient satisfaction and of those patients managed
112
by the physiotherapists the majority did not return
113
to see their GP in the following three-months with
114
the same complaint. This compared favourably to
115
GP care. In summary the authors reported that the
116
use of physiotherapists as primary assessors for
117
patients with musculoskeletal disorders was
118
a viable alternative to GP care.
119
At a time when this topic is growing ever more
120
relevant this investigation attempts to further
121
the work of Ludvigsson and Enthoven (2012)
122
within the NHS. This evaluation explores the
123
implementation of a ‘1st Line Physiotherapy
124
Service’which deliversfirst point of contact care,
125
in a general practice setting, to patients with MSK
126
complaints. Funding for this service evaluation
127
was provided by the Nottingham City Clinical
128
Commissioning Group (CCG). This funding
129
extended to the clinical provision of the service
130
and research time for the lead researcher and
131
a project assistant (PA).
132
Methods
133
A prospective, evaluative design was applied to
134
the clinical evaluation of the 1st Line
Physio-135
therapy Service with a convenience, cohort sample
136
recruited during the 12-months that the service
137
was delivered.
138
For the economic evaluation of the
physio-139
therapy service this same cohort was used. For the
140
economic evaluation a retrospective, GP sample
141
142 between January 2013 and December 2013, 143 preceding the introduction of the 1st Line 144 Physiotherapy Service. The patients were selected 145 by searching under a MSKfilter on the electronic 146 records system (EMIS Web). This was undertaken 147 by GP practice administration staff who then 148 passed on the unique identification numbers of 149 the cohort to the PA.
150 All data were collected via standardised 151 questionnaires (physiotherapy sample) or from 152 clinical records (GP sample). The PA role 153 included the data collection and collation and the 154 development of excel spread sheets for data 155 storage and manipulation. The PA was not blinded 156 during the data collection process.
157 Context
158 Physiotherapists, working at an advanced level 159 and employed at band 7 level, were placed in two 160 general practices within Nottingham City. This 161 advanced role allowed the Physiotherapists to 162 refer for diagnostic tests (x-ray and magnetic 163 resonance imaging (MRI) scan) and refer to 164 secondary care. The two physiotherapists both 165 had over 10-years clinical experience and had 166 undertaken Masters level modules in advanced 167 practice skills.
168 The two practices differed in their patient 169 population in that one was a traditional inner city 170 practice and the other a university practice. Each 171 physiotherapist provided two half-day clinics 172 per week in their respective practice. The initial 173 trial of the service was for a period of one-year 174 from April 2014 to April 2015.
175 On contacting the practice to book an appoint-176 ment, patients were offered the choice of seeing 177 the physiotherapist, as an alternative to a GP, by 178 the receptionist staff, if they were experiencing 179 a MSK-related complaint. The reception staff 180 undertook no triage duties but instead 181 showed patients a list of ‘common MSK related 182 complaints’ to highlight the type of conditions 183 suitable for physiotherapy assessment. If patients 184 chose to see the physiotherapist they were offered 185 an appointment. There was an expectation, based 186 on capacity: demand modelling before the launch 187 of the service, that the demand for physiotherapy 188 would exceed the capacity. As such the decision 189 was taken to set the maximum wait for 190 a physiotherapy appointment at 10 days.
191
This acknowledged the limited capacity of the
192
service and ensured patients were seen in a timely
193
manner, matching, as far as possible, existing GP
194
waiting times.
195
Appointments were 20-min in length and
196
patients were limited to two appointments with the
197
physiotherapist. This was aimed at replicating
198
normal GP care as closely as possible. If patients
199
were felt to require on-going physiotherapy input
200
they were referred to the main primary care
201
physiotherapy provider at their second
appoint-202
ment. Within the physiotherapy assessment
203
patients were screened for non-MSK pathology
204
and, where appropriate, offered advice and any
205
relevant interventions, primarily based within
206
a self-management paradigm.
207
Analysis
208
Safety and governance
209
The safety of the 1st Line Physiotherapy Service
210
was analysed retrospectively by review of incidents
211
reported by either the physiotherapists or the
212
general practices themselves. This was done
213
through subjective, monthly reporting and review
214
of electronic incident reporting systems.
215
Descriptive outcomes
216
The following descriptive measures were taken;
217
the region and the chronicity of the complaint.
218
Interventions provided by the physiotherapists,
219
which included exercise prescription and advice,
220
and any onward referrals, for diagnostic
investi-221
gations or secondary care, were recorded. The
222
outcome of the assessment, and any subsequent
223
follow-up appointment, was also recorded. For
224
consistency a standardised excel spread sheet
225
for recording the data was used. Codes used for
226
collating the descriptive data are described in
227
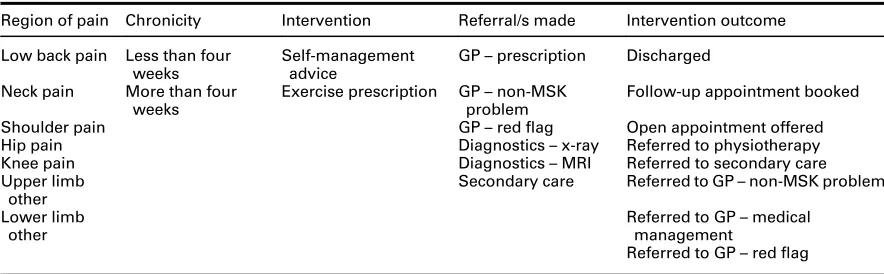
Table 1. This data were collected by the PA.
228
Quantitative outcomes
229
At assessment patients were issued with a
self-230
complete questionnaire booklet with outcome
231
measures as detailed below. This was completed
232
independently outside the consultation room. The
233
completion of the questionnaire booklet was
234
voluntary. As this was a service evaluation no
235
236 did not agree to complete the questionnaire 237 booklet. Clinical outcome measures were only 238 taken for the patients managed within the 1st Line 239 Physiotherapy Service; there was no GP clinical 240 comparison group.
241 For the follow-up data (one, six months) the 242 plan was for patients to be contacted by the PA via 243 either telephone or email. It was immediately 244 apparent that patients were not responding to the 245 email system and as such this was abandoned. As 246 a result, patients completed the questionnaires 247 verbally, in conversation with the PA, over the 248 telephone. No other method of contact was 249 attempted. A period of five working days was 250 accepted either side of the scheduled data 251 collection points. Beyond this the data was 252 accepted as lost to the evaluation and as such 253 a degree of attrition was anticipated.
254 Patient satisfaction
255 Following liaison with the authors of the original 256 Swedish study (Ludvigsson and Enthoven, 2012) 257 an English translation of their patient satisfaction 258 questionnaire was used.
259 Outcome of intervention
260 Two clinical outcome measures were used: 261 The EQ-5D-5L descriptive system (EuroQol 262 Group, 1990) was used as a standardised measure 263 of health status. Percentage of patients demon-264 strating improvement between the two time points 265 was reported. Effect size was calculated for the
266
change in median score for the EQ-5D-5L index.
267
In order to determine the percentage of patients
268
whose EQ-5D index score changed from baseline
269
to six months (improved or deteriorated) a change
270
score of>0.1 was chosen. Thisfigure was based on
271
the reported minimally important difference
272
for the EQ-5D of 0.074 (range −0.011 to 0.140)
273
(Walters and Brazier, 2005).
274
The Global Rating of Change (GROC)
275
questionnaire (Kamper et al., 2009) is a scale
276
designed to quantify a patient’s improvement
277
or deterioration over time. The scale asks that
278
a person assess his or her current health status,
279
recall that status at a previous time point, and then
280
calculate the difference between the two.
281
All data were inputted onto excel spread sheets.
282
An EQ-5D-5L excel calculator was used for the
283
EQ-5D-5L data. This enables the EQ-5D data to
284
be easily translated into simple utility scores.
285
These scores can be further used to demonstrate
286
the change in an individual’s quality of life, due
287
to physiotherapy intervention. This can also be
288
collated to show the change for a whole service
289
or a specified population.
290
Cost data
291
Although there was no clinical comparison
292
group costs were calculated for a GP group
293
of patients. A retrospective cohort of 100 patients
294
(50 from each practice) who were randomly
295
selected from GP records and who had been seen
296
for a primary MSK complaint were selected. These
297
[image:4.536.45.487.77.214.2]patients were selected from the 12 months Table 1 Descriptive coding options for; region of pain, chronicity, intervention provided, referral/s made, and intervention outcome
Region of pain Chronicity Intervention Referral/s made Intervention outcome
Low back pain Less than four weeks
Self-management advice
GP–prescription Discharged
Neck pain More than four weeks
Exercise prescription GP–non-MSK problem
Follow-up appointment booked
Shoulder pain GP–redflag Open appointment offered
Hip pain Diagnostics–x-ray Referred to physiotherapy
Knee pain Diagnostics–MRI Referred to secondary care
Upper limb other
Secondary care Referred to GP–non-MSK problem
Lower limb other
Referred to GP–medical management
298 between January 2013 and December 2013, 299 preceding the introduction of the 1st Line 300 Physiotherapy Service. The patients were selected 301 by searching under a MSKfilter on the electronic 302 records system (EMIS Web). This was undertaken 303 by GP practice administration staff who then 304 passed on the unique identification numbers of 305 the cohort to the PA who subsequently reviewed 306 the records and retrieved the descriptive data, as 307 per the physiotherapy cohort, with the exception 308 of the chronicity of the complaint.
309 Economic analysis
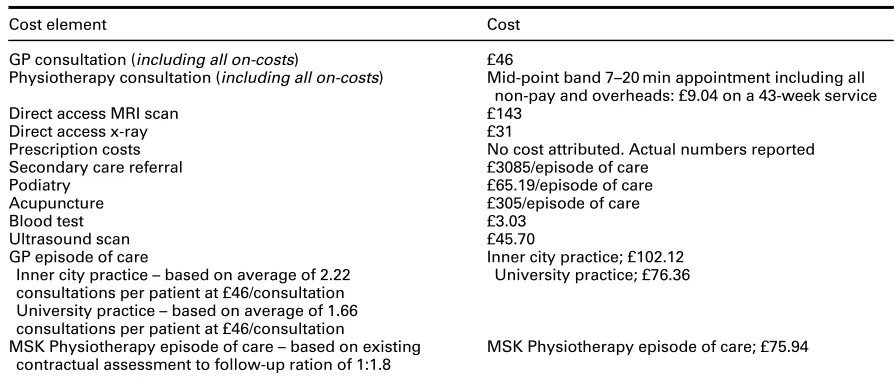
310 Advice was sought, throughout, from a health 311 economist. Despite the fact that equivalence has 312 been demonstrated in interventions by GP and 313 physiotherapy, when comparing outcome to 314 treatment (Scholten-Peeters et al., 2006), as this 315 had not been proved formally within this evalua-316 tion it was not felt appropriate to undertake a cost 317 minimisation evaluation. As such the average cost 318 per episode of care was calculated for each group. 319 This approach has been used elsewhere in similar 320 cohorts of patients (Holdsworthet al., 2007). Costs 321 per case were calculated using key data relating 322 costs acquired from sources (Table 2). Where 323 possible, costs were taken from 2014 figures for 324 unit costs of health and social care (Curtis, 2014). 325 When this document did not provide specific costs 326 the CCG provided up to date costs for procured
327
services. Specifically, this included an average cost
328
per case for a secondary care referral to trauma
329
and orthopaedic surgery based on data from 2014/
330
2015. This included new outpatient activity,
follow-331
up activity and procedures undertaken; both day
332
case and inpatient. This subsequent value did not
333
include any diagnostic referrals made in secondary
334
care. The number of new outpatient appointments
335
was used as a proxy measure for unique episodes
336
of care. As a result of this calculation the average
337
cost for a secondary care referral to trauma and
338
orthopaedics was £3085/patient.
339
The CCG also provided the costs figures
340
for direct access MRI scan, direct access x-ray,
341
average cost per episode of care podiatry, average
342
cost per episode of care acupuncture, primary
343
care cost for blood test, primary care cost for
344
musculoskeletal diagnostic ultrasound scan.
345
Physiotherapy costs were based on appointment
346
lengths of 20 min at mid-point band 7 level. Any
347
additional expenditure associated with onward
348
referral from physiotherapy was calculated using
349
the above figures. All key data relating costs are
350
shown in Table 3.
351
Costs for GP care and physiotherapy care were
352
calculated as an average cost per patient. This was
353
based on the retrieved data around new
appoint-354
ment: follow-up appointment ratios for each
ser-355
vice, within each practice. On average a GP at the
356
inner city practice saw a patient 2.22 times and in
357
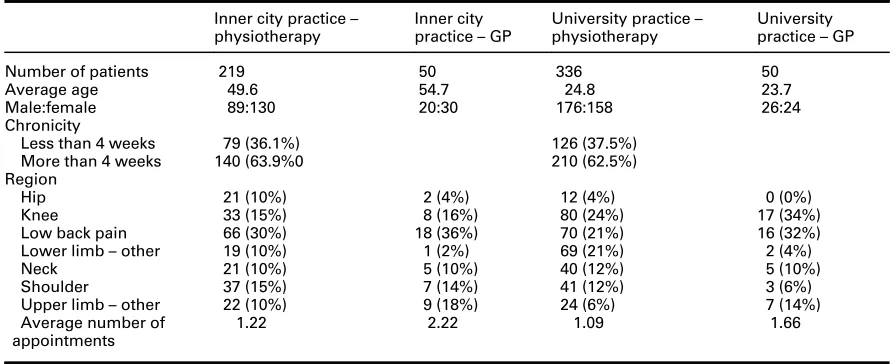
[image:5.536.46.493.69.251.2]the university practice 1.66 times. Table 2 Descriptive demographic data of patients
Inner city practice– physiotherapy
Inner city practice–GP
University practice– physiotherapy
University practice–GP
Number of patients 219 50 336 50
Average age 49.6 54.7 24.8 23.7
Male:female 89:130 20:30 176:158 26:24
Chronicity
Less than 4 weeks 79 (36.1%) 126 (37.5%)
More than 4 weeks 140 (63.9%0 210 (62.5%)
Region
Hip 21 (10%) 2 (4%) 12 (4%) 0 (0%)
Knee 33 (15%) 8 (16%) 80 (24%) 17 (34%)
Low back pain 66 (30%) 18 (36%) 70 (21%) 16 (32%)
Lower limb–other 19 (10%) 1 (2%) 69 (21%) 2 (4%)
Neck 21 (10%) 5 (10%) 40 (12%) 5 (10%)
Shoulder 37 (15%) 7 (14%) 41 (12%) 3 (6%)
Upper limb–other 22 (10%) 9 (18%) 24 (6%) 7 (14%)
Average number of appointments
358 Costs for any onward physiotherapy input were 359 based on existing contractual assessment: follow-360 up ratio of 1:1.8 for the main physiotherapy service 361 at a cost of £75.94.
362 Of importance, and relevance, is the issue of 363 medication prescription. It was initially intended 364 that this data would be collected and included 365 in the economic evaluation. However, accurate 366 prescription data was not available from the GP 367 records to attribute costs to. Furthermore, the 368 national average ‘cost-per-GP-prescription’ was 369 felt likely to exaggerate the costs as most MSK 370 prescription costs would be less expensive than this 371 figure. As such the decision was made to exclude 372 prescription costs from the economic evaluation 373 but to report of the actual number of times 374 prescriptions were issued for the two groups. 375 Costs per case were calculated, as described. 376 Total costs for the four patient cohorts (inner city 377 physiotherapy, inner city GP, university phy-378 siotherapy, university GP) were then calculated 379 and the average cost per episode of care was 380 calculated by dividing this total by the number of 381 patients in the cohort.
382 Furthermore, a non-parametric bootstrap was 383 used to obtain confidence intervals for the mean 384 differences in cost. The mean of each of these 385 samples was calculated, and the bias-corrected 386 bootstrap method used to calculate 95% con-387 fidence intervals for the mean differences in cost.
388
Results
389
Descriptive outcomes
390
The demographic information collected from
391
the two practices is presented in Table 4. It was
392
clear from these demographics that the cohort of
393
patients differed between the inner city and the
394
university practice. As a result all outcomes will be
395
considered separately. However, based on the
396
data obtained the physiotherapy and GP groups
397
of patients, at the respective practices, appear to
398
be similar in terms of age, gender and region of
399
MSK complaint.
400
The 1st Line Physiotherapy Service appears to
401
have been safe with no adverse events reported
402
by either of the physiotherapists or, subsequently,
403
by either of the practices.
404
The physiotherapist based at the inner city
405
practice assessed 219 patients, assessment
406
outcome measures were obtained for 140 patients.
407
One-month outcomes measures were obtained
408
for 108 patients and at six-months outcome
409
measures were obtained for 71 patients. At the
410
university practice the figures were; assessed 336,
411
assessment outcome measures 208, one-month
412
outcome measures 75, six-month outcome
413
measures 59. The majority of patients attended for
414
a single physiotherapy consultation. In the inner city
415
practice 78% of patients were seen once and in the
416
[image:6.536.41.489.66.258.2]university practice 92% of patients were seen once. Table 3 Key data relating costs
Cost element Cost
GP consultation (including all on-costs) £46
Physiotherapy consultation (including all on-costs) Mid-point band 7–20 min appointment including all non-pay and overheads: £9.04 on a 43-week service
Direct access MRI scan £143
Direct access x-ray £31
Prescription costs No cost attributed. Actual numbers reported
Secondary care referral £3085/episode of care
Podiatry £65.19/episode of care
Acupuncture £305/episode of care
Blood test £3.03
Ultrasound scan £45.70
GP episode of care
Inner city practice–based on average of 2.22 consultations per patient at £46/consultation University practice–based on average of 1.66 consultations per patient at £46/consultation
Inner city practice; £102.12 University practice; £76.36
MSK Physiotherapy episode of care–based on existing contractual assessment to follow-up ration of 1:1.8
417 Almost all patients, regardless of practice, were 418 offered both advice on self-management and 419 exercise prescription on their initial assessment 420 with the physiotherapist. Advice was provided 421 verbally and, where necessary, patients were 422 provided with written resources, for example 423 exercise sheets.
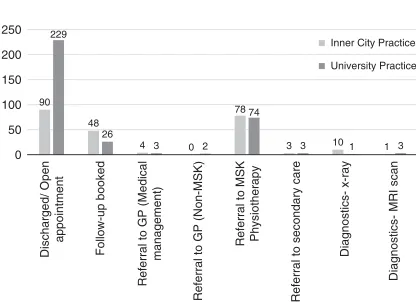
424 Resource utilisation is reported graphically 425 as follows (Figures 1 and 2):
426 In both practices the physiotherapists managed 427 almost all of the patients independently, without 428 recourse to a GP (university practice 99%, inner 429 city practice 98%). This was to some extent 430 facilitated by the extended roles they held with 431 access to referral for diagnostics and secondary 432 care available.
433 A proportion of patients were offered a follow-434 up appointment for review with the Physiothera-435 pist within the 1st Line Service. In the inner
436
city practice there were 48 (21%) follow-up
437
appointments with 11 subsequently referred
438
onwards to the MSK Physiotherapy Service
439
and the remainder discharged. In the university
440
practice there were 26 (7.7%) follow-up
appoint-441
ments with seven patients subsequently referred
442
onwards to the MSK Physiotherapy Service
443
and the remainder discharged. In the university
444
practice one patient was also referred for a MRI
445
scan at follow-up.
446
Within the 1st Line Physiotherapy Service
447
onwards referrals, excluding the MSK
Physio-448
therapy Service, were low. Within the inner
449
city practice onward resource utilisation was 6.4%
450
and within the university practice onward resource
451
[image:7.536.46.491.69.180.2]utilisation was 2%.
Table 4 Change in EQ-5D-5L at the patients attending physiotherapy from initial consultation to six-month follow-up
Practice Inner city practice University practice
Post-pre treatment change Post-pre treatment change Change in EQ-5D-5L Index
Median 0.10 0.08
Mean 0.13 0.10
Standard deviation of mean 0.27 0.14
No. of patients 64 59
% Patients improved 72 73
% Patients not improved 28 27
Effect size 0.45 1.19
90 48
4 0 78
3 10 1 229
26
3 2 74
3 1 3
0 50 100 150 200 250
Discharged/ Open
appointment
Follow-up booked
Referral to GP (Medical
management)
Referral to GP (Non-MSK)
Referral to MSK Physiotherapy
Referral to secondary care
Diagnostics- x-ray
Diagnostics- MRI scan
[image:7.536.51.259.198.349.2]Inner City Practice University Practice
Figure 1 Resource utilisation and referral pattern of 1st Line Physiotherapy Service within inner city practice (n=219) and university practice (n=336)
21
4 3 1
24
4 16 16
2 7
2 55
1 1 8
0 10 20 30 40 50 60
MSK Physiotherapy Diagnostics- x-ray
Diagnostics- MRI
Diagnostics- blood tests Diagnostics- ultrasound
scan
Medication prescription
Acupuncture
Podiatry
Secondary care
University practice
Inner city practice
[image:7.536.280.486.204.376.2]452 Less than 2% of patients assessed by the 453 physiotherapist, within either practice, were 454 referred back to see the GP for either a medical 455 review or because they were not felt to be 456 presenting with a MSK-related problem.
457 Quantitative outcomes
458 Patient satisfaction
459 The patient satisfaction questionnaire was 460 translated into English from the original research 461 by Ludvigsson and Enthoven (2012). Patients were 462 asked, following their assessment with the 463 physiotherapist, to score their response on a Likert 464 scale, range 0–5. There were three questions and 465 the scores for the two practices are represented 466 in Figure 3.
467 Clinical outcomes
468 As stated, these results are only available for the 469 1st Line Physiotherapy Service.
470 Global Rating of Change (GROC)
471 The GROC is designed to quantify a patient’s 472 improvement or deterioration over time. The scale 473 asks that a person assess his or her current health 474 status, recall that status at a previous time point, 475 and then calculate the difference between the 476 two. Patients at the inner city practice reported 477 a median GROC of 0 (no different) at one-month 478 and at the university practice the median score for
479
the GROC was 5 (quite a bit better). Patients at
480
the inner city practice reported a median GROC
481
of 3 (somewhat better) at the six-month time point
482
and at the university practice the median score
483
for the GROC was 5 (quite a bit better).
484 EQ-5D-5L
485
EQ-5D-5L is a standardised measure of health
486
status developed by the EuroQol Group (1990) in
487
order to provide a generic measure of health for
488
clinical and economic appraisal. Table 4 shows
489
change in EQ-5D-5L, percentage of patients
490
improved and effect size for patients attending
491
physiotherapy at the two practices from initial
492
consultation to six-month follow-up. As the
493
EQ-5D-5L describes a change only patients with
494
both pre and post scores were included in the
495
analysis. As such the numbers are as follows; inner
496
city practice, n=64, university practice, n=59.
497
Effect sizes were calculated using the formula;
498
ES=(M1-M2)/SD where M1 is the assessment
499
median score and M2 the six-month median score
500
and SD is the standard deviation of the median
501
assessment score (Maher and Kilmartin, 2012).
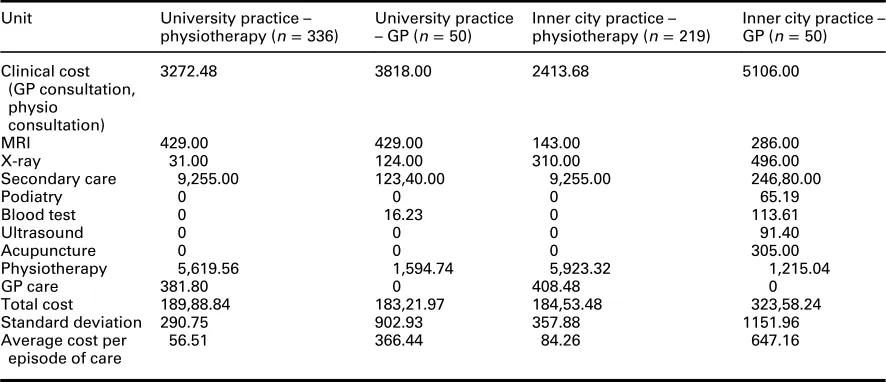
502 Cost per average episode of care calculation
503
Using the previously described key data relating
504
to costs the following cost per average episode of
505
care calculations were made for the two practices
506
(Table 5). The average cost per episode of care are
507
shown in Table 5.
508
The overall costs per average episode of care
509
were significantly different between both GP
510
practices and their respective 1st Line
Physio-511
therapy Service equivalent. In the inner city
512
practice the GP costs were £647.16/patient and
513
the physiotherapy costs were £84.26/patient.
514
In the university practice the GP costs were
515
£366.44/ patient and the physiotherapy costs were
516
£56.51/patient.
517
There was a statistically significant difference in
518
favour of the physiotherapy groups within both
519
practices using a non-parametric bootstrap test;
520
inner city practice, mean difference in costs=
521
£538.01 (P=0.006; 95% CI; £865.678, £226.98),
522
university practice mean difference in costs=
523
£295.83 (P=0.044; 95% CI; £585.16, £83.69).
524
The greatest difference between the two
525
services arose due to the differences in actual
526
consultation costs between the two professions.
527
With respect to resource utilisation; referrals to
0 10 20 30 40 50 60 70 80 90 100
Have you received sufficient information
about your problem at today’s visit to the
physiotherapist?
Have you received sufficient information about self-care, e.g. regarding advice or exercise programme?
Do you have confidence in the physiotherapist’s competency to assess
your problems? Inner City Practice University Practice
528 secondary care demonstrate a two-and-a-half fold 529 increase seen in the inner city practice and an, 530 almost, six-fold difference seen in the university 531 practice. As previously noted costs for prescrip-532 tions was excluded from the cost calculations. 533 Actual prescription activity for each practice were 534 as follows; inner city practice (GP 55 prescri-535 ptions: physiotherapy 0 prescriptions), university 536 practice (GP 24 prescriptions: physiotherapy 537 0 prescriptions).
538 Discussion
539 Summary of mainfindings
540 This service evaluation found that the 1st Line 541 Physiotherapy Service was safe, with no adverse 542 incidents recorded at either of the two practices. 543 Additionally, the service appears to be well 544 received by patients. Furthermore, within the 545 limitations of this service evaluation, significant 546 costs per average episode of care differences were 547 demonstrated between usual GP care and the 548 1st Line Physiotherapy Service.
549 In the study by Ludvigsson and Enthoven 550 (2012), of the cohort of patients who saw the 551 physiotherapist over 80% reported complete 552 satisfaction with the information they received 553 from the physiotherapist and their confidence in
554
the physiotherapists’ competency to assess their
555
problem. Both practices within this evaluation
556
reported over 70% complete satisfaction with the
557
same questions. This is comparable to the Swedish
558
study generally and compares favourably to the
559
Swedish GP cohort where satisfaction levels were
560
closer to 50%.
561
The number of patients that the
physiothera-562
pists managed independently compared positively
563
to the Swedish study. Ludvigsson and Enthoven
564
(2012) reported that, in their study, 85% of the
565
patients did not need to be seen by a GP. Similar
566 figures were reported in a study of physiotherapy
567
self-referral (Holdsworth et al., 2007) in Scotland
568
where 85% of patients needed no further referral
569
beyond physiotherapy. The physiotherapist in the
570
inner city practice and the university practice
571
managed 63% and 75% of patients independently,
572
respectively. However, this does include those,
573
relatively few, patients who were able to make use
574
of the physiotherapists advanced roles (x-ray,
575
MRI scans).
576
Additionally, the above figures do not include
577
those patients referred to the main MSK
578
physiotherapy service (university practice 22%,
579
inner city practice 36%). The criteria for
manage-580
ment within the 1st Line Physiotherapy Service
581
was restricted to two appointments. It is not
582
[image:9.536.48.491.77.268.2]unreasonable to think that those patients referred Table 5 Cost per average episode of care for service offered (GP care or 1st Line Physiotherapy care) and practice (inner city practice or university practice)
Unit University practice–
physiotherapy (n=336)
University practice
–GP (n=50)
Inner city practice– physiotherapy (n=219)
Inner city practice– GP (n=50)
Clinical cost (GP consultation, physio
consultation)
3272.48 3818.00 2413.68 5106.00
MRI 429.00 429.00 143.00 286.00
X-ray 31.00 124.00 310.00 496.00
Secondary care 9,255.00 123,40.00 9,255.00 246,80.00
Podiatry 0 0 0 65.19
Blood test 0 16.23 0 113.61
Ultrasound 0 0 0 91.40
Acupuncture 0 0 0 305.00
Physiotherapy 5,619.56 1,594.74 5,923.32 1,215.04
GP care 381.80 0 408.48 0
Total cost 189,88.84 183,21.97 184,53.48 323,58.24
Standard deviation 290.75 902.93 357.88 1151.96
Average cost per episode of care
583 to the main physiotherapy service could, if 584 resources allowed, have been managed satisfacto-585 rily by those physiotherapists based in the practice 586 itself. Certainly the figures given in the Swedish 587 study extend beyond the two-session allowance 588 in this evaluation to allow for management to 589 completion of care.
590 The numbers referred on for either a diagnostic 591 procedure or a secondary care opinion were 6.4% 592 (inner city practice) and 2% (university practice). 593 This compares favourably where, even discounting 594 referrals to the MSK Physiotherapy Service, the 595 rate of onward resource utilisation for the GP 596 cohort was 33% at the inner city practice and 597 14% at the university practice.
598 The number of patients who represented with 599 the same complaint appears to also correlate well 600 with the work of Ludvigsson and Enthoven (2012). 601 For the inner city practice 25% of patients 602 re-presented in the following six months and in 603 the university practice this figure was just 604 9%. The Swedish Physiotherapy Service had 605 a re-presentation rate of 12%. However, this was 606 in a three-month period and it would be reason-607 able to expect this to rise over a further three 608 months. Furthermore, they reported 48% of 609 patients seen by a GP as representing in the sub-610 sequent three months. This would seem to allude 611 to greater improvements in clinical outcome 612 for the cohort of patients managed by the 613 physiotherapists.
614 Clinically the 1st Line Physiotherapy Service 615 appears to demonstrate good efficacy. There are 616 self-reported improvements in both the GROC 617 and the EQ-5D-5L.
618 Patients at the inner city practice reported a 619 median GROC of 0 (no different) at one-month 620 and at the university practice the median score for 621 the GROC was 5 (quite a bit better). Patients at the 622 inner city practice reported a median GROC of 3 623 (somewhat better) at the six-month time point and 624 at the university practice the median score for the 625 GROC was 5 (quite a bit better). Both these 626 six-month scores and the rate of change in score 627 probably reinforce the difference between the two 628 cohorts of patients with the demographic informa-629 tion suggesting a younger patient population with 630 a greater proportion of peripheral musculoskeletal 631 complaints in the university practice.
632 In hypothesising about the lack of change in
the inner city practice at one-month, the
633
physiotherapists anecdotally, reported a greater
634
degree of chronicity in the inner city practice
635
cohort of patients. This is not reflected in the data
636
collected (inner city practice; <4 weeks 36.1%,
637 >4 weeks 63.9%), (university practice; <4 weeks
638
37.5%, >4 weeks 62.5%). Nevertheless, this
639
may be due more to the limited parameters of
640
measurement. Certainly, three months is often
641
used a delineating chronicity of MSK complaints.
642
If this had been used it may be that the data would
643
have reflected the clinical impression and as such
644
accounted for the slower improvement, as might
645
be expected for a chronic complaint, described
646
by the GROC.
647
The results for the EQ-5D-5L demonstrate, of
648
those patients providing data at baseline and six
649
months’ (n =123), over 70% reported an
650
improvement. Previous work in musculoskeletal
651
health, albeit in surgery, have suggested effect
652
sizes between 0.2 and<0.5 are considered small,
653
0.5 to <0.8 considered moderate and >0.8
con-654
sidered large (Maher and Kilmartin, 2012). Using
655
these parameters the effect size in the inner city
656
practice is just below moderate (0.45) and in the
657
university practice large (1.19).
658
In summary, from a clinical perspective, this
659
evaluation appears to corroborate the work of
660
Ludvigsson and Enthoven (2012) in that
661
physiotherapists can safely and effectively act
662
asfirst line practitioners for patients with
muscu-663
loskeletal complaints.
664
Economic evaluation
665
Of particular relevance and topicality is the cost
666
efficiency of health services. Within the limitations
667
of a pragmatic service evaluation, this piece of
668
work appears to intimate financial incentives
669
for the implementation of a service providing
670
physiotherapists as a first point of contact for
671
patients with musculoskeletal complaints.
672
The cheapest of the physiotherapy services was
673
the university practice with an average cost per
674
episode of care of £56.51/patient. This is compared
675
to £366.44/patient for the GP cohort in the same
676
practice. The costs for the inner city practice
677
were £84.26/patient and £647.16/patient for
678
the physiotherapy package and GP package,
679
respectively.
680
Clearly, a significant proportion of these savings
681
682 physiotherapists and GPs. This saving was 683 demonstrated despite the fact that the 684 physiotherapy appointment time was double that 685 of the GP time. However, this does not account 686 for the whole picture. There were also differences 687 demonstrated in the difference in rates of referrals 688 for diagnostic procedures and secondary care. 689 GP onward resource utilisation exceeded that of 690 the physiotherapists. Of most note was the use 691 of secondary care referrals. Over six-months GPs 692 in the inner city practice spent £493.60/ patient 693 on secondary care compared to £42.26/ patient by 694 the physiotherapist and in the university practice 695 GPs spent £246.80/ patient on secondary care 696 compared to £27.54/ patient by the physio-697 therapist. It is tempting, and perhaps not 698 inappropriate, to hypothesise as to the reasons, 699 and indeed the impact, of these differences but 700 this falls outside the remit of this evaluation. 701 Nevertheless, there does not seem to have been an 702 under-referral by the physiotherapists’ as the 703 majority of patients appear to have been managed 704 within the 1st Line Physiotherapy Service 705 itself or subsequent conservative physiotherapy 706 management.
707 Previous concerns expressed with regards to 708 the proposition of physiotherapists as first line 709 practitioners centred on both safety of patients 710 and the expectation of an increase in resource 711 utilisation. This evaluation seems to reinforce 712 previous evidence that physiotherapists, with 713 extended roles, do not utilise resources any more 714 than their medical colleagues and in fact less so 715 (Carr, 2003; Rabeyet al., 2009).
716 Strengths and limitations of this study
717 As an evaluation of a clinical service a pragmatic 718 approach had to be taken and, as such, there are 719 acknowledged weaknesses in the methodology 720 and subsequent data generated. The primary 721 short-coming is the lack of a comparison group. 722 The resultant lack of clinical equivalence of 723 difference also compromises the economic 724 evaluation with no cost minimisation or cost 725 effectiveness analysis possible. However, as 726 previously stated there has been, at least, equiva-727 lence demonstrated between such services in 728 the past (Scholten-Peeterset al., 2006) and similar 729 physiotherapy services have demonstrated clinical 730 efficacy (Holdsworthet al., 2007).
731
Further challenge could be ascribed to the
732
economic evaluation; despite costs being
733
attributed to any further physiotherapy
interven-734
tion, beyond the 1st Line Physiotherapy Service,
735
these costs were not fully explored; were patients
736
subsequently referred to secondary care, were
737
patients subsequently referred for additional
738
diagnostic tests? Nevertheless, these challenges
739
could equally be ascribed to the GP cohort.
740
With regards to prescription costs neither of the
741
physiotherapists were prescribers (supplementary
742
or independent). As such any recourse to
743
prescription medication would have been made
744
via the GP. No recommendations for GP
745
consultations for medication reviews were made
746
by either Physiotherapist. The Physiotherapists
747
described recommending patients consult with
748
their local pharmacist with respect to over the
749
counter medication and it would seem reasonable
750
to hypothesise that this accounts for the absence
751
of recourse to GPs.
752
Clearly, the prescribing activity is different
753
between the physiotherapy and GP groups. As
754
previously stated we were unable to feel confident
755
about attributing a cost to this difference due the
756
lack of specificity about prescriptions issued.
757
Nevertheless, this difference somewhat results in
758
an underestimation of the cost difference for the
759
average cost per case.
760
Nonetheless, despite these limitations the
761
evidence for the cost efficiency of a service
762
providing physiotherapy as afirst point of contact
763
appears positive but requires further controlled,
764
comparative studies to fully evaluate the costs
765
differences between the two approaches.
766
The fact that two very different practices were
767
used is both a strength and a weakness of this
768
evaluation. It is acknowledged that the university
769
practice stands outside the usual inner city practice
770
typical for Nottingham city and as such it was
771
felt inappropriate to combine the physiotherapy
772
outcomes. Alternatively, the clear consistencies
773
between the two practices reinforce the efficacy of
774
the 1st Line Physiotherapy Service.
775
In addition, as only one physiotherapist, at each
776
practice, provided the clinical input this evaluation
777
could be seen as an analysis of their individual
778
practice rather than physiotherapyper se. Clearly
779
this could have been addressed by changing the
780
therapists within the practices during the
evalua-781
782 consistency within the practices a decision was 783 made not to do this. It is also within the parameters 784 of the pragmatic nature of the evaluation that 785 acknowledgement is made of the non-blinding 786 of the PA.
787 The issues of response/loss to both baseline 788 and follow-up bias are also acknowledged. The 789 pragmatic approach meant that the plan was to 790 contact patients in the physiotherapy group either 791 by email or over the telephone by the PA. It 792 immediately became apparent that patients were 793 not responding to the email contact and as such 794 this was abandoned. As such the follow-up details, 795 at one and six months, were all collected over the 796 telephone. To maintain some reliability a period of 797 five working days either side of the scheduled date 798 was permitted but inevitably this meant patients 799 were lost from the data set. Outcome measures 800 for 130 patients (23% of total physiotherapy 801 cohort) were collected at six months. This could 802 reasonably be said to potentially bias the sample. 803 However, the PA sought to contact all patients 804 as timetabled and indeed this somewhat reduces 805 this potentiality. Again, the authors would 806 propose addressing this through a more robust 807 methodology.
808 Impact
809 The impact of this evaluation is potentially wide-810 spread. Clearly, one of the greatest motivations for 811 the instigation of the 1st Line Physiotherapy Service 812 was the potential reduction in GP burden. Of 813 importance is the fact that the service proved to be 814 safe for patients. Furthermore, the service was well 815 received by patients and the clinical outcomes 816 proved satisfactory. As such, the potential positive 817 impact of this novel service has been shown. It has 818 been estimated that up to 30% of a general practice 819 caseload presents with a musculoskeletal problem. 820 Theoretically this could also reduce the GP burden. 821 There is also potential impact for physiotherapy 822 and physiotherapists with greater skill develop-823 ment and professional autonomy. Physiotherapists 824 continue to push back their traditional boundaries 825 and in this evaluation the Physiotherapists 826 were able to make referrals to secondary care 827 and for some diagnostics (x-ray, MRI scan). 828 Clearly, physiotherapy scope has extended 829 elsewhere to include further diagnostic referrals, 830 injection therapy and independent prescribing.
831
Hypothetically, this has the potential of further
832
reducing GP burden.
833
Anotherfinding of this evaluation is the potential
834
cost implications of implementing a 1st Line
835
Physiotherapy Service. Whilst acknowledging the
836
pragmatic nature of this service evaluation the
eco-837
nomic analysis demonstrates encouraging results.
838
Future research
839
There are acknowledged short-comings of this
840
pragmatic service evaluation. This clearly leaves
841
opportunities for future research. Of fundamental
842
importance is a randomised comparative study
843
between GP and physiotherapy care. Not only
844
would this validate, or otherwise, the clinicalfi
nd-845
ings of this evaluation but it would also allow for a
846
more robust economic evaluation.
847
There are also potentially interesting societal
848
issues that could be explored. Anecdotal evidence
849
from the evaluation demonstrates potential
850
barriers to the implementation of a novel service
851
like 1stLine Physiotherapy. Further research into
852
these barriers would seem to be important if the
853
traditional model of health care delivery, in the
854
NHS, is to be successfully modified. Certainly, this
855
challenge appears to be necessary due to the rising
856
demands on an increasingly unsustainable service.
857
Conclusion
858
Based on the average cost per episode of care
859
evaluation and the clinical evaluation undertaken
860
the 1stLine Physiotherapy Service appears to offer
861
a safe, clinically efficacious and financially
expe-862
dient service for patients with musculoskeletal
863
complaints in primary care. This would appear to
864
offer a part-solution to the rising clinical and
865 financial pressures currently encountered in
866
primary care.
867
It is acknowledged that this is an area of little
868
research and it would be useful to undertake
869
a more controlled, comparative trial.
870
Acknowledgements
871
The support of Daniel Hammersley, Practice
872
Manager and Linda Lawton, Practice Manager is
873
874 acknowledged. The support of Simon Oliver, 875 Commissioning Manager, Nottingham City Clin-876 ical Commissioning Group is acknowledged.
877 Financial Support
878 This work was supported by the Nottingham City 879 Clinical Commissioning Group.
880 Conflicts of Interest
881 None.
882 Ethical Standards
883 Ethical approval was not necessary.
884
References
885 Carr, A.J. 2003: Orthopaedic outpatient departments: an 886 evaluation of appropriateness, effectiveness, cost effectiveness 887 and patient satisfaction associated with the assessment and 888 management of defined referrals by physiotherapists.
889 London: Department of Health.
890 Curtis, L.2014: Unit Costs of Health and Social Care 2014.
891 Kent, UK.
892 Department of Health 2006: The musculoskeletal services 893 framework – a joint responsibility: doing it differently.
894 London: Department of Health.
895 EuroQol Group. 1990: EuroQol – a new facility for the
896 measurement of health-related quality of life.Health Policy 897 16, 199–208.
898 Foster, N.E., Hartvigsen, J. and Croft, P.R. 2012:
899 Taking responsibility for the early assessment and
900 treatment of patients with musculoskeletal pain:
901 a review and critical analysis.Arthritis Research & Therapy 902 14, 205.
903 Holdsworth, L.K., Webster, V.S.andMcFadyen, A.K.2007:
904 What are the costs to NHS Scotland of self-referral to
905 physiotherapy? Results of a national trial. Physiotherapy 906 93, 3–11.
907 Jordan, K.P., Kadam, U.T., Hayward, R., Porcheret, R., 908 Young, C.andCroft, P.2010: Consultation prevalence of
909 regional musculoskeletal problems in primary are: an
910 observational study. BMC Musculoskeletal Disorders 911 11, 144.
912 Kamper, S.J., Maher, C.G.andMackay, G.2009: Global rating
913 of change scales: a review of strengths and weaknesses and
914 considerations for design.Journal of Manual & Manipula-915 tive Therapy17, 163–70.
916 Kennedy, D.M., Robarts, S. and Woodhouse, L. 2010:
917 Patients are satisfied with advanced practice
physio-918 therapists in a role traditionally performed by
919 orthopaedic surgeons. Physiotherapy Canada 62,
920 298–305.
921 Ludvigsson, M.L. and Enthoven, P. 2012: Evaluation of
922
physiotherapists as primary assessors of patients with
923
musculoskeletal disorders seeking primary health care.
924 Physiotherapy98, 131–37.
925 Maher, A.J.andKilmartin, T.E.2012: An analysis of Euroqol
926
EQ-5D and Manchester Oxford Foot Questionnaire scores
927
six months following podiatric surgery.Journal of Foot and 928 Ankle Research5, 17.
929 Mallen, C.D., Peat, G., Thomas, E., Dunn, K.M.andCroft, P.R.
930
2007: Prognostic factors for musculoskeletal pain in primary
931
care: a systematic review.British Journal of General Practice 932
57, 655–61.
933 Margham, T. 2011: Musculoskeletal disorders: time for joint
934
action in primary care.British Journal of General Practice 935
61, 657–58.
936 McClellan, C.M., Greenwood, R.andBenger, J.R.2006: Effect
937
of an extended scope physiotherapy service on patient
938
satisfaction and the outcome of soft tissue injuries in an
939
adult emergency department.Emergency Medicine Journal 940
23, 384–87.
941 Office for National Statistics.2012: Population Ageing in the
942
United Kingdom, its Constituent Countries and the
943
European Union [online]. Retrieved 10 June 2015 from
944
http://www.ons.gov.uk/ons/dcp171776_258607.pdf.
945 Picavet, H.S.andSchouten, J.S.2003: Musculoskeletal pain in
946
the Netherlands: prevalences, consequences and risk
947
groups, the DMC3-study.Pain102, 167–78.
948 Rabey, M., Morgans, S. and Barrett, C.2009: Orthopaedic
949
physiotherapy practitioners: surgical and radiological
950
referral rates.Clinical Governance: An International Journal 951
14, 15–19.
952 Reeve, S.andMay, S.2009: Exploration of patients’
perspec-953
tives of quality within an extended scope physiotherapists’
954
spinal screening service.Physiotherapy Theory and Practice 955
25, 533–43.
956 Royal College of General Practitioners. 2014: Over 500
957
surgeries at risk of closure as GP workforce crisis deepens
958
[online]. Retrieved 10 June 2015 from http://www.
959
rcgp.org.uk/news/2014/october/over-500-surgeries-at-risk-of-960
closure-as-gp-workforce-crisis-deepens.aspx.
961 Scholten-Peeters, G.G.M., Neeleman-van der Steen, C.W.M.,
962 van der Windt, D.A.W.M., Hendriks, E.J.M., Verhagen, A.P.
963
andOostendorp, R.A.B.2006: Education by general
practi-964
tioners or education and exercises by physiotherapists for
965
patients with whiplash-associated disorders? A randomized
966
clinical trial.Spine31, 723–31.
967 Stanhope, J., Grimmer-Somers, K., Milanese, S., Kumar, S.and
968 Morriss, J. 2012: Extended scope physiotherapy roles for
969
orthopaedic outpatients: an update systematic review
970
of the literature.Journal of Multidisciplinary Healthcare5,
971
37–45.
972 Sutton, M., Govier, A., Prince, S. and Morphett, M.2015:
973
Primary-contact physiotherapists manage a minor trauma
974
caseload in the emergency department without
misdiag-975
977 Urwin, M., Symmons, D., Allison, T., Brammah, T., 978 Busby, H., Roxby, M., Simmons, A.andWilliams, G.2011:
979 Estimating the burden of musculoskeletal disorders in
980 the community: the comparative prevalence of symptoms
981 at different anatomical sites, and the relation to
982
social deprivation. Annals of the Rheumatic Diseases 983
57, 649–55.
984 Walters, S.J.andBrazier, J.E.2005: Comparison of the minimally
985
important difference for two health state utility measures:
986
EQ-5D and SF-6D.Quality of Life Research14, 1523–532.