1 Differential modulation of the N2 and P3 event-related potentials by response conflict and inhibition
Madeleine J. Grooma* and Lucy Craggb
a Division of Psychiatry & Applied Psychology, Institute of Mental Health, School of Medicine,
University of Nottingham Innovation Park, Triumph Road, Nottingham, NG7 2TU, U.K. Email: maddie.groom@nottingham.ac.uk
b
School of Psychology, University Park, University of Nottingham, Nottingham, NG7 2RD, U.K. Email: lucy.cragg@nottingham.ac.uk
*Corresponding author Madeleine Groom
2 Abstract
Background: Developing reliable and specific neural markers of cognitive processes is essential to improve understanding of healthy and atypical brain function. Despite extensive research there remains uncertainty as to whether two electrophysiological markers of cognitive control, the N2 and P3, are better conceptualised as markers of response
inhibition or response conflict. The present study aimed to directly compare the effects of response inhibition and response conflict on the N2 and P3 event-related potentials, within-subjects.
Method: A novel hybrid go/no-go flanker task was performed by 19 healthy adults aged 18 to 25 years while EEG data were collected. The response congruence of a central target stimulus and 4 flanking stimuli was manipulated between trials to vary the degree of response conflict. Response inhibition was required on a proportion of trials. N2 amplitude was measured at two frontal electrode sites; P3 amplitude was measured at 4 midline electrode sites.
Results: N2 amplitude was greater on incongruent than congruent trials but was not
enhanced by response inhibition when the stimulus array was congruent. P3 amplitude was greater on trials requiring response inhibition; this effect was more pronounced at frontal electrodes. P3 amplitude was also enhanced on incongruent compared with congruent trials.
4 1 Introduction
The term cognitive control refers to a suite of cognitive processes that enable us to navigate the world in a goal-directed manner. There is consensus that the pre-frontal cortex and its anatomical connections with other brain regions, particularly the basal ganglia and parietal and motor cortices, underpin effective cognitive control (Arnsten & Rubia, 2012; Ridderinkhof, van den Wildenberg, Segalowitz, & Carter, 2004). However, the degree to which the sub-processes of cognitive control can be fractionated remains unclear. More precise characterisation of the sub-processes of cognitive control and the degree to which they rely on distinct or overlapping neural circuits will refine understanding of human brain function. To achieve this it is crucial to identify neural markers specific to one or a set of cognitive processes and to understand the factors that influence the morphology and presentation of such markers.
Developing reliable and specific neural markers of cognitive processes also has implications for improving our understanding of atypical brain function. Impaired cognitive control has been reported in a range of neurodevelopmental disorders, particularly
5 1.1 The N2 event-related potential
One area which may benefit from more precise definition of neural markers is the study of action selection and control. In electrophysiological studies the N2 event-related potential (ERP), a fronto-central stimulus-locked component with a latency of between 200 and 350ms, has traditionally been interpreted as an index of response inhibition
(Falkenstein, Hoormann, & Hohnsbein, 1999; Jodo & Kayama, 1992), defined in this context as the cancellation of a prepotent or prepared motor response. In the visual go/no-go task, in which a rapid unimanual response to a ‘go’ stimulus must be inhibited when an
infrequent ‘no-go’ stimulus is presented, and in the stop signal task, in which the go
stimulus is followed occasionally by a signal to cancel the prepared response, N2 amplitude is larger on no-go trials than on go trials and on successful compared to failed stop trials (Enriquez-Geppert, Konrad, Pantev, & Huster, 2010; Kok, Ramautar, De Ruiter, Band, & Ridderinkhof, 2004; Ramautar, Kok, & Ridderinkhof, 2006; Schmajuk, Liotti, Busse, & Woldorff, 2006).
An alternative school of thought is that the N2 is not modulated by response inhibition specifically but by conflict between competing responses (Donkers & van Boxtel, 2004; Randall & Smith, 2011; Smith, Smith, Provost, & Heathcote, 2010; van Veen & Carter, 2002). According to this model, the N2 is modulated in inhibitory control tasks because the ratio of go to no-go or stop trials creates conflict between the prepotent response tendency and the infrequent requirement to inhibit the response (Braver, Barch, Gray, Molfese, & Snyder, 2001), not because of inhibition per se. In support of this, N2 amplitude is greater on go than no-go trials when the ratio of go: no-go trials is reversed (Donkers & van Boxtel, 2004; Enriquez-Geppert et al., 2010; Nieuwenhuis, Yeung, van den Wildenberg, &
6 task (Bartholow et al., 2005; Clayson & Larson, 2011; Kopp, Rist, & Mattler, 1996; Purmann, Badde, Luna-Rodriguez, & Wendt, 2011). In the flanker task participants must respond to a central target stimulus while simultaneously suppressing an opposing response associated with the flanking stimuli. Thus, response inhibition is not required but N2 amplitude
enhancement is observed, providing support for the hypothesis that the N2 is modulated by response conflict rather than inhibition specifically.
Few studies have directly compared no-go and incongruent flanker trials and it is therefore unclear whether they produce equivalent effects on the N2. Of the studies
conducted to date, Brydges et al., (2012) report a more frontal topography for the N2 on no-go trials than on incongruent flanker trials and Heil, Osman, Wiegelmann, Rolke, &
Hennighausen (2000) report N2 amplitude enhancement on both no-go and incongruent flanker trials. However, neither study successfully dissociated inhibition and conflict: the congruence of the array differed between go and no-go stimuli and in Brydges et al., (2012) the stimuli also differed in colour. Kopp, Mattler, Goertz, & Rist (1996) compared no-go trials in which a central no-go stimulus was flanked either by stimuli associated with a left/right hand response (specific primes) or by neutral stimuli (non-specific primes). The N2 was larger to no-go stimuli flanked by specific primes which the authors suggested reflected inhibition of the primed response; however there was no direct comparison between no-go and go flanker trials and it could be argued that the specific prime induced conflict between competing response options rather than inhibition of the primed response. It is therefore unclear from the research published so far whether the N2 responds differently to flanker-induced response conflict and response inhibition.
7 have often reported high rates of inhibitory errors coupled with reduced N2 amplitude (Barry, Johnstone, & Clarke, 2003; Brandeis et al., 1998; Groom et al., 2010; Liotti, Pliszka, Perez, Kothmann, & Woldorff, 2005) interpreted as poor inhibitory control. However, as outlined above, response inhibition paradigms may reflect conflict between competing responses as well as (or instead of) the cancellation of a planned or prepotent response. Moreover, recent research suggests more widespread impairment in action regulation and monitoring in ADHD (Johnson et al., 2007; Kuntsi & Klein, 2012; Simmonds et al., 2007). Increasing understanding of the factors that influence the N2 could lead to more precise characterisation of the nature of impaired performance on action control tasks in ADHD and other disorders associated with impaired action control.
1.2 The P3 event-related potential
8 (Kropotov, Ponomarev, Hollup, & Mueller, 2011; Meel, 2005; Randall & Smith, 2011; Smith et al., 2007).
P3 amplitude is also enhanced by response conflict (Clayson & Larson, 2011; Smith et al., 2007). However, to our knowledge no studies have compared P3 amplitude and
topography on no-go and incongruent flanker trials within the same task design and it remains unclear whether the amplitude enhancement and frontal shift in topography are specific to response inhibition or also occur in relation to flanker-induced response conflict. Moreover, the P3 is altered in clinical groups such as those with schizophrenia and ADHD (Bekker et al., 2005; Groom et al., 2008; Groom et al., 2010; Hughes, Fulham, Johnston, & Michie, 2012; Wiersema & Roeyers, 2009) and the NGA described by Fallgatter et al is also reduced in these groups (Fallgatter, 2001; Fallgatter et al., 2004; Fallgatter & Muller, 2001). Improving understanding of the role of the P3 as a marker of action regulation could
therefore enhance knowledge of the neuro-cognitive factors underpinning these disorders.
1.3 Aims and hypotheses
To determine whether the N2 and P3 are modulated by response inhibition,
9 signalling either a left- or right-hand response or no-go (up arrow). The congruence of the central target stimulus and flanking stimuli was manipulated between trials to produce trials with minimal conflict and no response inhibition (low conflict, no inhibition), trials requiring inhibition but within a congruent stimulus array (low conflict, inhibition), trials with conflict between competing left and right responses (high conflict, no inhibition) and trials with conflict between a unimanual right-hand response and response inhibition (high conflict, inhibition). The task included trials in which a no-go stimulus was flanked by stimuli
associated with a unimanual response and vice versa to ensure that any stimulus (right, left, no-go) could be part of a congruent or an incongruent array. This provided greater
separation of congruence and response type and consistency while maintaining the visual properties of the different trial types.
With reference to Table 1, we reasoned that if the N2 is a marker of response inhibition, amplitude will be significantly greater on congruent no-go (NNN) than go (RRR) trials. The task was designed so that the frequency of congruent go and no-go trials was equal. This ensured minimal conflict between ‘go’ and ‘no-go’, providing a strong test of whether either ERP is modulated by response inhibition when response conflict is minimal. If the N2 is a marker of conflict between competing responses rather than response
inhibition, amplitude will be greater on incongruent left and right (RLR, LRL) than congruent left and right (LLL, RRR) but will not differ between NNN and RRR.
10 response is not required. Alternatively, if the P3 responds to trials with high response
conflict as well as to those with inhibitory requirements, amplitude will be greater and topography more frontal for all trial types requiring response inhibition or the resolution of response conflict (NNN, RNR, LRL, RLR, NRN) relative to those free from inhibition or conflict (RRR, LLL).
Finally, if response inhibition and response conflict produce different effects on either the N2 and/or the P3, we reasoned that this would provide evidence for at least some separation of the neural circuits underlying these cognitive processes and would suggest that response inhibition and response conflict are not wholly equivalent.
2 Methods
2.1 Participants
Nineteen right-handed healthy young adults (4 males) aged 18 to 25 years (mean age 19.74 ± 2.75) with normal or corrected-to-normal vision completed an EEG experiment in the Division of Psychiatry, University Of Nottingham, United Kingdom. The study was reviewed and approved by the University of Nottingham Faculty of Medicine and Health Sciences ethics committee and informed written consent was obtained from each
11 2.2 Stimuli & Apparatus
The task was presented on a 17-inch computer monitor positioned approximately 60cm in front of the participant, using E-Prime version 1 (Psychology Software Tools, Inc., Pittsburgh, USA). The computer keyboard was used to record responses. The trial structure was the same throughout but the degree of inhibitory control and/or response conflict was manipulated between trials (Table 1). On each trial a visual stimulus of 200ms duration was presented. The array comprised 5 images, each of which was either a left arrow, right arrow or upwards arrow measuring 43mm by 43mm, spaced 5mm apart (the total array cast 5.9 by 1.07 degrees of visual angle). Stimuli were black on a light grey background.
[Table 1]
The configuration of the 5 images within the stimulus array yielded 7 trial types which differed according to the degree of response inhibition and response conflict elicited by each (Table 1). Congruent trials were: a central left (LLL) or right (RRR) arrow flanked by congruent arrows, requiring a left or right response respectively, or no-go trials (NNN) consisting of upward arrows which signalled the need to withhold the response. Incongruent trials were: a central right arrow flanked by left arrows (LRL), a central left arrow flanked by right arrows (RLR); a central right arrow flanked by up arrows (NRN) or a central up arrow flanked by right arrows (RNR). The labels reflect the direction of the 3 central arrows of the stimulus array and will be used throughout to refer to specific trial types.
12 accurately. Average RT was displayed at the end of each block with a reminder to
participants to respond quickly. Pilot testing suggested accuracy was likely to be high and so no feedback message was delivered on incorrect trials, although these were removed from all analyses. The inter-stimulus interval (ISI) was randomly selected on each trial from a range of values between 1500 and 2500ms; a fixation cross was presented for the duration of the ISI.
2.3 Procedure
Participants completed 12 blocks of 64 trials. Pilot testing showed that combining trials requiring response inhibition with those requiring selection of a left or right response in the same block undermined the inhibitory demands of the task, reflected in equal
accuracy and ERP amplitudes on go and no-go trials. For this reason, the trials were blocked such that RRR, NNN, NRN and RNR trials were presented within 6 blocks (‘Inhibition Set’) and RRR, LLL, LRL and RLR were presented separately in another 6 blocks (‘Conflict Set’). Participants completed each set once sequentially with the order of the sets randomised between subjects. Trial order was randomised within each set but was the same for all participants. The ratio of trial types in each block is shown in Table 1. A practice block of 20 trials was administered first to ensure all participants understood the stimulus-response relationships.
2.4 Electrophysiological data recording and analysis
13 mastoid and adjacent to and below each eye to facilitate the identification and correction of ocular and other artefacts during data analysis. Data were recorded at a sampling rate of 256Hz, yielding a low-pass cut-off of 67Hz.
Analysis was performed using BVA 2.0 (Brain Products, Munich, Germany). After filtering between 0.5 and 30Hz with Butterworth zero-phase filters (slope 24 Db/octave) and re-referencing the data at each electrode to the average of all electrodes, eye blinks and lateral eye movements were corrected using a linear regression method (Gratton, Coles, & Donchin, 1983). To correct blinks and vertical eye movements, the correction algorithm was referenced to the data recorded at the ocular electrode positioned below the right eye and a right frontal scalp electrode located immediately to the right of Fpz. To correct lateral saccades the algorithm was referenced to the left and right lateral ocular electrodes. Data were then segmented into 1500ms stimulus-locked epochs spanning 500ms pre- and 1000ms post-stimulus, for each trial type. Movement and other artefacts were defined according to the following parameters and rejected from further analysis: voltage gradient of at least 30µV/ms; amplitude greater than ±120 µV; amplitude less than .5µV over a 400ms time window. Data were baseline-corrected according to a 200ms window immediately prior to stimulus onset. Trials with an incorrect or slow (>900ms) response were excluded.
Following visual inspection of the grand average waveforms and the scalp
distribution of each ERP, peak N2 amplitudes on each trial type were defined as maximum amplitude within a 250-350ms post-stimulus time window at the frontal and fronto-central midline electrodes Fz and FCz. The N2 was not detected reliably at any other midline channels and as we did not develop specific a priori predictions about the effects of
14 P3 amplitudes were defined as maximum amplitude in a 350 to 550ms window at midline electrodes Fz, FCz, Cz and Pz. The P3 topography extended further than the N2 topography and the inclusion of frontal, central and parietal electrodes ensured we could determine whether there was a fronto-central shift in topography for trials requiring response inhibition. Peak amplitudes were exported for each trial type and electrode. Statistical analysis revealed no significant differences between RRR and LLL or between LRL and RLR in the Conflict Set. The data were therefore averaged across left and right to create two variables: RRR/LLL and LRL/RLR. The mean number of trials included in the ERP average of each condition was: RRR=143, NNN=136, NRN=47, RNR=41, RRR/LLL=287, LRL/RLR=95.
2.5 Statistical analysis
2.5.1 Performance
To examine the effects of trial type on accuracy a 2 (Congruence) by 3 (Response) repeated-measures ANOVA was performed. The Congruence factor comprised two levels, Congruent, Incongruent and the Response factor comprised 3 levels, Simple Response (trials for which the target stimulus is associated with a unimanual right-hand response), No Response (the target stimulus requires inhibition of the unimanual right-hand response), Choice Response (the target stimulus requires a left or right-hand response to be selected). For analysis of RT data, the Response factor comprised only 2 levels, Simple Response and Choice Response. Table 2 shows the correspondence between ANOVA factors and specific trial types.
2.5.2 ERPs
15 levels (Fz, FCz) for the N2 analysis and 4 levels (Fz, FCz, Cz, Pz) for the P3 analysis. The
Congruence and Response factors were as described above (see Table 2).
For all analyses (performance and ERPs) interactions and main effects significant at p<.05 were followed up with appropriate univariate ANOVAs and paired t-tests. Specifically, Congruence*Response interactions were followed with paired t-tests to compare Congruent and Incongruent trials at each level of the Response factor (Simple Response: RRR vs NRN; No Response: NNN vs RNR; Choice Response: RRR/LLL vs LRL/RLR) and then by repeated measures ANOVA to analyse the effects of Response at each level of Congruence
(Congruent: RRR vs NNN vs RRR/LLL; Incongruent: NRN vs RNR vs LRL/RLR). Where the assumption of sphericity was violated (Mauchley’s test statistic significant at p<.01), Greenhouse-Geisser adjustment was performed.
[Table 2 here]
3 Results
3.1 Performance
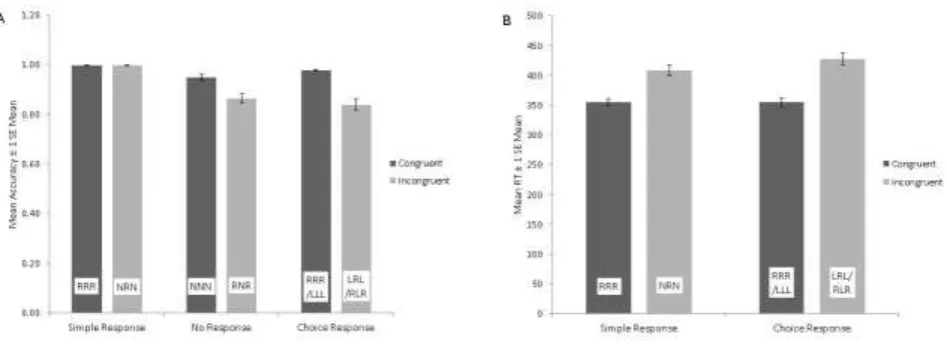
Performance data (for all trial types) are shown in Figure 1.
3.1.1 Accuracy
16 Response (RRR, NRN) (mean = .997, SE = .01) than No Response (NNN, RNR) (mean = .91, SE = .01) trials (all p<.001)
To further investigate the interaction, paired t-tests were conducted to compare the Congruent and Incongruent trial types at each level of the Response factor, and then to compare main effects of Response at each level of Congruence. Firstly, accuracy was significantly greater on Congruent than Incongruent Choice Response trials (RRR/LLL vs LRL/RLR) [t (1, 18) = 6.92, p<.001] confirming the standard conflict effects in this paradigm. Secondly, accuracy was significantly greater on Congruent than Incongruent No Response trials (NNN vs RNR) [t (1, 18) = 5.06, p<.001] but there was no difference for Simple
Responses trials (RRR vs NRN) (p>.1). Finally, there was a significant main effect of Response on Congruent trials [F (2, 36) = 9.37, p<.001] with greater accuracy for Simple Response (RRR) than No Response (NNN) [t (1, 18) = 3.70, p<.01], confirming the typical inhibitory effects on accuracy.
[Figure 1]
3.1.2 RT
Analysis of RT revealed a main effect of Congruence [F (1, 18) = 251.39, p<.001] with shorter RT for Congruent (mean = 355.38, SE = 6.29) than Incongruent (mean = 418.30, SE = 8.64) trials. There was no main effect of Response but a Congruence by Response
17 for Simple Response than Choice Response (NRN vs LRL/RLR) [t (1, 18) = 2.45, p<.05] trials. No other comparisons were significant.
3.2 ERPs
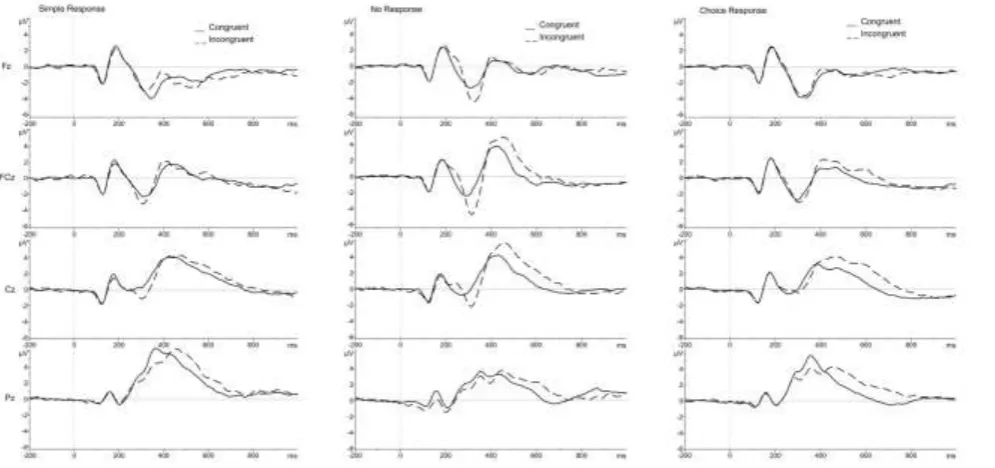
Grand average waveforms for each trial type are shown in Figure 2. [Figure 2]
3.3 Modulation of N2 amplitude by trial type
Descriptive data are shown in Table 3. The 3-way ANOVA revealed a main effect of Congruence [F (1, 18) = 16.03, p=.001] with greater amplitude on Incongruent (mean = -4.42, SE = .48) than Congruent (mean = -3.65, SE = .38) trials. There was no main effect of Response. There were also significant interactions between Electrode and Congruence [F (1, 18) = 32.55, p<.001], Electrode and Response [F (2, 36) = 3.30, p<.05], Congruence and Response [F (2, 36) = 6.02, p<.01] and between all 3 factors, Electrode, Congruence and Response [F (2, 36) = 3.55, p<.05]. To explore these interactions further, 2 (Congruence) by 3 (Response) ANOVAs were conducted at each Electrode (Fz, FCz).
At Fz, there was a significant Congruence by Response interaction [F (2, 36) = 9.33, p=.001]. Paired t-tests were performed to analyse the effect of Congruence at each level of the Response factor. N2 amplitude was significantly greater on Incongruent than Congruent No Response trials (RNR vs NNN) [t (1, 18) = 3.68, p<.05] but there was no effect of
18 [Table 3 here]
3.4 Modulation of P3 amplitude by trial type
Descriptive data are shown in Table 4. Analysis of P3 amplitude at 4 electrode sites revealed main effects of Electrode [F (3, 54) = 20.41, p<.001], Congruence [F (1, 18) = 10.14, p<.01] and Response [F (2, 36] = 7.93, p=.001]. Amplitude was significantly greater for Incongruent (mean = 4.16, SE = .35) than Congruent (mean = 3.44, SE = .27) trials and for No Response trials (mean = 4.49, SE = .41) compared with Simple Response (mean = 3.62, SE = .28) (p<.01) and Choice Response (mean = 3.29, SE = .33) (p<.01) trials, which did not differ significantly from one another. The Congruence*Response and
Electrode*Congruence*Response interactions were non-significant (p>.1).
Electrode interacted significantly with Congruence [F (3, 54) = 3.78, p<.05] and Response [F (6, 108) = 16.97, p<.001]. Further analysis of the Electrode by Congruence interaction revealed significantly greater amplitude for Incongruent (mean = 4.40, SE = .49) than Congruent (mean = 3.19, SE = .34) trials at FCz [F (1, 18) = 11.26, p<.01] and also greater amplitude for Incongruent (mean = 5.74, SE = .59) than Congruent (mean = 4.56, SE = .36) trials at Cz [F (1, 18) = 10.43, p<.01] but no significant difference at Fz or Pz. This indicates that the effect of Congruence on P3 amplitude is greatest at fronto-central electrode sites.
[Table 4 here]
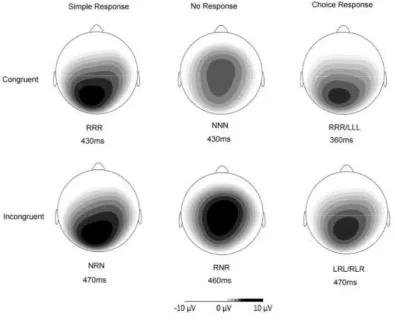
19 p<.05] and Pz [F (2, 17) = 12.93, p<.001]. The main effect of Response at each electrode was explored further using pairwise t-tests. Amplitude was significantly greater for No Response than Simple Response or Choice Response trials at Fz and FCz (all p<.01) (see Table 4 for relevant means and SDs). At Cz, amplitude was greater for No Response than Choice Response trials only (p<.05) and at Pz, amplitude was greater for Simple Response than No Response only (p<.01). As shown in Figure 3, trials requiring response inhibition have a more fronto-central topography whereas the Simple Response trials elicited greater amplitude than No Response trials at Pz.
[Figure 3]
4 Discussion
The aims of this study were to measure and compare the effects of response inhibition and response conflict on N2 amplitude and P3 amplitude and topography. To this end we designed a novel hybrid flanker-go/no-go paradigm consisting of trials with varying levels of response conflict and inhibitory control but with minimal differences in the visual properties of the trial types. Analysis of performance data confirmed the standard effects reported in previous studies of longer RT and greater accuracy on incongruent than congruent flanker trials and greater accuracy on go than no-go trials.
4.1 N2 amplitude
20 inhibition (Brydges et al., 2012; Donkers & van Boxtel, 2004; Enriquez-Geppert et al., 2010; Randall & Smith, 2011; Smith et al., 2010; van Veen & Carter, 2002). The task employed in the present study equated the frequency of go and no-go trials; the findings therefore provide further support for previous studies in which N2 amplitude is not enhanced on no-go trials when these are equally frequent to no-go trials (Donkers & van Boxtel, 2004; Enriquez-Geppert et al., 2010; Nieuwenhuis et al., 2003). In this particular study we compared
response inhibition with response conflict induced by incongruent flankers, rather than conflict induced by different frequencies of trial types. The task design in the present study provided greater separation of response inhibition and flanker-induced response conflict than in previous studies (Brydges et al., 2012; Heil et al., 2000) and facilitated a within-subjects comparison of these cognitive processes and their effect on N2 amplitude. The findings therefore provide compelling evidence that N2 amplitude is modulated by flanker-induced response conflict as well as the conflict between a prepotent and rare response. Our findings are consistent with those of Kopp, Mattler, et al., (1996) who reported
significant N2 enhancement on no-go trials flanked by left/right-hand response flankers but not on trials where the flankers were response-neutral.
Interestingly, although there was no effect of response inhibition on N2 amplitude when the stimulus array was congruent (RRR vs NNN), the congruence effect was greater for No Response than Simple Response or Choice Response trials; thus amplitude was
21 different neural systems when the demands of inhibiting a response and resolving response conflict are combined. There is some support for this from neuroimaging studies in which response conflict activates a core region of anterior cingulate cortex but this activity is supplemented by activity in other ACC regions and in inferior frontal gyrus when response inhibition is required (Braver et al., 2001). Further research combining electrophysiology with source localisation techniques is required to determine whether this explains the pattern of scalp effects identified here.
An alternative explanation of the effect is that the RNR trial type was less frequent than either the RRR or NNN trial types within the Inhibition Set; thus, greater response conflict could have been induced by the lower frequency of the RNR trial type compared with NNN. This seems unlikely however as RNR trials produced significantly greater N2 amplitude then NRN trials although these two trial types were equally frequent. Further research is needed to fully establish the cause of N2 enhancement on the RNR trial type and to determine whether additional neural generators are active when conflict and inhibition must be resolved simultaneously.
Although there was no difference in N2 amplitude between RRR and NNN trials, accuracy was significantly greater for RRR than NNN indicating that participants found it more difficult to withhold than to commit a unimanual response. This suggests that the task produced some challenge to response inhibition despite the equal frequency of go and no-go trials, but that this was not reflected in N2 amplitude.
4.2 P3 amplitude and topography
22 occurred despite the equivalent frequency of congruent go and no-go trials (RRR and NNN) supporting previous studies suggesting that the P3 is a reliable marker of response inhibition than the N2 (Enriquez-Geppert et al., 2010; Fallgatter & Strik, 1999; Kropotov et al., 2011; Randall & Smith, 2011; Smith et al., 2007). In line with previous research (Fallgatter et al., 1997; Fallgatter & Strik, 1999) the P3 also showed a more frontal topography on No Response trials than on any other trial type, potentially reflecting activation in pre-frontal brain regions on trials requiring response inhibition. Further research is needed to establish the neural generators of the frontal P3 in relation to response inhibition, but suggested sources include the pre-SMA (Kropotov et al., 2011) and the cingulate cortex (Fallgatter et al., 2002). These vary depending on the imaging modality, cognitive task and analysis methods employed however (reviewed in (Huster et al., 2011).
P3 amplitude was also significantly enhanced on incongruent compared with congruent trials. Huster et al., (2011) point out that the latency of the P3 means it cannot be a marker of inhibition itself but may instead reflect evaluation of the response process. It seems plausible to suggest that this evaluative function could be invoked by response inhibition and by conflict between competing responses. Interestingly, in the present study,
23 4.3 Implications and limitations
When developing the study hypotheses we reasoned that if either the N2 or P3 were differently affected by response inhibition and response conflict this would suggest that the neural systems underlying these cognitive processes are at least partially separable. The pattern of results supports this interpretation: N2 amplitude was enhanced by trials with high versus low response conflict but not by response inhibition when conflict was low. Conversely, P3 topography was more frontal on trials requiring response inhibition than on those that did not require response inhibition or the resolution of response conflict. Recent models of action control posit a mid-cingulate conflict monitoring system that is
supplemented in a task-dependent manner by information from other brain regions (Braver et al., 2001; Goghari & MacDonald, 2009; Mostofsky & Simmonds, 2008). The N2 is thought to be one of a number of mid-frontal generated electrophysiological processes that reflect the activity of this general conflict monitoring system across a range of task designs and stimulus-response modalities (Cavanagh, Zambrano-Vazquez, & Allen, 2012). Thus, the N2 probably responds to a range of situations where there is a need to monitor conflict and select between competing responses, as found in the present study. P3 amplitude may also reflect activity in this conflict monitoring system although at a different stage than the N2, possibly the evaluation of a response (Huster et al., 2011). The findings further suggest that in addition to its role as a marker of response conflict, the P3, particularly anteriorisation of the P3 on no-go trials, is a marker of the active suppression of a motor response (Enriquez-Geppert et al., 2010; Fallgatter & Strik, 1999; Smith et al., 2007).
24 often been hailed as a marker of impaired inhibitory control in ADHD (Barry et al., 2003; Brandeis et al., 1998; Groom et al., 2010; Liotti et al., 2005). However, this population also tend to show reduced P3 amplitude (Bekker et al., 2005; Groom et al., 2008; Groom et al., 2010; Hughes et al., 2012; Wiersema & Roeyers, 2009) and altered P3 topography (Fallgatter et al., 2004) as well as a much wider range of deficits in action control (Johnson et al., 2007; Kuntsi & Klein, 2012; Simmonds et al., 2007). Establishing the parameters that modulate the N2 and P3 will improve the measurement of action control in ADHD and other clinical populations, potentially leading to a more refined understanding of the particular neural systems that underlie in specific disorders or symptom dimensions. The findings of the present study provide greater confidence in the role of the N2 as a marker of response conflict and of no-go anteriorisation of the P3 as a marker of response inhibition. If applied to the measurement of action control in clinical populations, the task presented here could therefore help determine whether specific disorders or symptom dimensions are explained by deficits in monitoring and resolving response conflict and/or by failures in the inhibition of a motor response.
25 frequencies, this suggests that the frequencies of different trial types did not contribute significantly to the pattern of results. A further limitation is that the task design does not allow us to rule out the possible confounding influence of motor-related potentials on P3 amplitude and topography. It has been suggested that the amplitude increase and
topographical shift on no-go relative to go trials reflects differential overlap with a response-related negativity (Salisbury, Rutherford, Shenton, & McCarley, 2001), although others have shown the effects cannot be entirely attributed to motor potentials (Smith, Jamadar, Provost, & Michie, 2013). P3 amplitude in the present study was similar between NNN and LRL/RLR trials which differ in their motor requirements and therefore presumably the presence/absence of a motor potential. Although not conclusive, this suggests that the findings presented here cannot be fully explained by the influence of motor-related potentials, although further research is needed to completely rule this out.
4.4 Conclusions
This study compared electrophysiological markers to response inhibition and
26 Acknowledgements
27 5 References
Arnsten, A. F. T., & Rubia, K. (2012). Neurobiological Circuits Regulating Attention, Cognitive Control, Motivation, and Emotion: Disruptions in Neurodevelopmental Psychiatric Disorders. Journal of the American Academy of Child and Adolescent Psychiatry, 51(4), 356-367.
Barry, R. J., Johnstone, S. J., & Clarke, A. R. (2003). A review of electrophysiology in attention- deficit/hyperactivity disorder: II. Event-related potentials. Clinical Neurophysiology, 114(2), 184-198.
Bartholow, B. D., Pearson, M. A., Dickter, C. L., Sher, K. J., Fabiani, M., & Gratton, G. (2005). Strategic control and medial frontal negativity: beyond errors and response conflict.
Psychophysiology, 42(1), 33-42.
Bekker, E. M., Overtoom, C. C., Kooij, J. J., Buitelaar, J. K., Verbaten, M. N., & Kenemans, J. L. (2005). Disentangling deficits in adults with attention-deficit/hyperactivity disorder. Arch Gen Psychiatry, 62(10), 1129-1136.
Brandeis, D., van Leeuwen, T. H., Rubia, K., Vitacco, D., Steger, J., Pascual-Marqui, R. D., et al. (1998). Neuroelectric mapping reveals precursor of stop failures in children with attention deficits. Behavioural Brain Research, 94(1), 111-125.
Braver, T. S., Barch, D. M., Gray, J. R., Molfese, D. L., & Snyder, A. (2001). Anterior cingulate cortex and response conflict: Effects of frequency, inhibition and errors. Cerebral Cortex, 11(9), 825-836.
28 Cavanagh, J. F., Zambrano-Vazquez, L., & Allen, J. J. B. (2012). Theta lingua franca: A
common mid-frontal substrate for action monitoring processes. Psychophysiology, 49(2), 220-238.
Clayson, P. E., & Larson, M. J. (2011). Conflict adaptation and sequential trial effects: Support for the conflict monitoring theory. Neuropsychologia, 49(7), 1953-1961.
Donkers, F. C. L., & van Boxtel, G. J. M. (2004). The N2 in go/no-go tasks reflects conflict monitoring not response inhibition. Brain and Cognition, 56(2), 165-176.
Enriquez-Geppert, S., Konrad, C., Pantev, C., & Huster, R. J. (2010). Conflict and inhibition differentially affect the N200/P300 complex in a combined go/nogo and stop-signal task. Neuroimage, 51(2), 877-887.
Falkenstein, M., Hoormann, J., & Hohnsbein, J. (1999). ERP components in Go/Nogo tasks and their relation to inhibition. Acta Psychol (Amst), 101(2-3), 267-291.
Fallgatter, A. J. (2001). Electrophysiology of the prefrontal cortex in healthy controls and schizophrenic patients: a review. J Neural Transm, 108(6), 679-694.
Fallgatter, A. J., Bartsch, A. J., & Herrmann, M. J. (2002). Electrophysiological measurements of anterior cingulate function. J Neural Transm, 109(5-6), 977-988.
Fallgatter, A. J., Brandeis, D., & Strik, W. K. (1997). A robust assessment of the NoGo-anteriorisation of P300 microstates in a cued continuous performance test. Brain Topography, 9(4), 295-302.
Fallgatter, A. J., Ehlis, A. C., Seifert, J., Strik, W. K., Scheuerpflug, P., Zillessen, K. E., et al. (2004). Altered response control and anterior cingulate function in
attention-deficit/hyperactivity disorder boys. Clinical Neurophysiology, 115(4), 973-981.
29 Fallgatter, A. J., & Strik, W. K. (1999). The NoGo-anteriorization as a neurophysiological standard-index for cognitive response control. Int J Psychophysiol, 32(3), 233-238.
Goghari, V. M., & MacDonald, A. W. (2009). The neural basis of cognitive control: Response selection and inhibition. Brain and Cognition, 71(2), 72-83.
Gratton, G., Coles, M. G., & Donchin, E. (1983). A new method for off-line removal of ocular artifact. Electroencephalogr Clin Neurophysiol, 55(4), 468-484.
Groom, M. J., Bates, A. T., Jackson, G. M., Calton, T. G., Liddle, P. F., & Hollis, C. (2008). Event-related potentials in adolescents with schizophrenia and their siblings: A comparison with attention-deficit/hyperactivity disorder. Biological Psychiatry, 63(8), 784-792.
Groom, M. J., Scerif, G., Liddle, P. F., Batty, M. J., Liddle, E. B., Roberts, K. L., et al. (2010). Effects of Motivation and Medication on Electrophysiological Markers of Response Inhibition in Children with Attention-Deficit/Hyperactivity Disorder. Biological Psychiatry, 67(7), 624-631.
Heil, M., Osman, A., Wiegelmann, J., Rolke, B., & Hennighausen, E. (2000). N200 in the Eriksen-task: Inhibitory executive processes? Journal of Psychophysiology, 14(4), 218-225. Hughes, M. E., Fulham, W. R., Johnston, P. J., & Michie, P. T. (2012). Stop-signal response inhibition in schizophrenia: Behavioural, event-related potential and functional
neuroimaging data. Biological Psychology, 89(1), 220-231.
Huster, R. J., Eichele, T., Enriquez-Geppert, S., Wollbrink, A., Kugel, H., Konrad, C., et al. (2011). Multimodal imaging of functional networks and event-related potentials in performance monitoring. Neuroimage, 56(3), 1588-1597.
30 Johnson, K. A., Kelly, S. P., Bellgrove, M. A., Barry, E., Cox, M., Gill, M., et al. (2007).
Response variability in Attention Deficit Hyperactivity Disorder: Evidence for neuropsychological heterogeneity. Neuropsychologia, 45(4), 630-638.
Kiehl, K. A., Smith, A. M., Hare, R. D., & Liddle, P. F. (2000). An event-related potential
investigation of response inhibition in schizophrenia and psychopathy. Biol Psychiatry, 48(3), 210-221.
Kok, A., Ramautar, J. R., De Ruiter, M. B., Band, G. P., & Ridderinkhof, K. R. (2004). ERP components associated with successful and unsuccessful stopping in a stop-signal task. Psychophysiology, 41(1), 9-20.
Kopp, B., Mattler, U., Goertz, R., & Rist, F. (1996). N2, P3 and the lateralized readiness potential in a nogo task involving selective response priming. Electroencephalogr Clin Neurophysiol, 99(1), 19-27.
Kopp, B., Rist, F., & Mattler, U. (1996). N200 in the flanker task as a neurobehavioral tool for investigating executive control. Psychophysiology, 33(3), 282-294.
Kropotov, J. D., Ponomarev, V. A., Hollup, S., & Mueller, A. (2011). Dissociating action
inhibition, conflict monitoring and sensory mismatch into independent components of event related potentials in GO/NOGO task. Neuroimage, 57(2), 565-575.
Kuntsi, J., & Klein, C. (2012). Intraindividual variability in ADHD and its implications for research of causal links. Current topics in behavioral neurosciences, 9, 67-91.
Liotti, M., Pliszka, S. R., Perez, R., Kothmann, D., & Woldorff, M. G. (2005). Abnormal brain activity related to performance monitoring and error detection in children with ADHD. Cortex, 41(3), 377-388.
31 Mostofsky, S. H., & Simmonds, D. J. (2008). Response Inhibition and Response Selection: Two Sides of the Same Coin. Journal of Cognitive Neuroscience, 20(5), 751-761.
Nieuwenhuis, S., Yeung, N., van den Wildenberg, W., & Ridderinkhof, K. R. (2003).
Electrophysiological correlates of anterior cingulate function in a go/no-go task: effects of response conflict and trial type frequency. Cogn Affect Behav Neurosci, 3(1), 17-26. Pliszka, S. R., Liotti, M., & Woldorff, M. G. (2000). Inhibitory control in children with attention- deficit/hyperactivity disorder: Event-related potentials identify the processing component and timing of an impaired right-frontal response-inhibition mechanism. Biological Psychiatry, 48(3), 238-246.
Polich, J. (2004). Clinical application of the P300 event-related brain potential. Phys Med Rehabil Clin N Am, 15(1), 133-161.
Purmann, S., Badde, S., Luna-Rodriguez, A., & Wendt, M. (2011). Adaptation to Frequent Conflict in the Eriksen Flanker Task An ERP Study. Journal of Psychophysiology, 25(2), 50-59. Ramautar, J. R., Kok, A., & Ridderinkhof, K. R. (2006). Effects of stop-signal modality on the N2/P3 complex elicited in the stop-signal paradigm. Biol Psychol, 72(1), 96-109.
Randall, W. M., & Smith, J. L. (2011). Conflict and inhibition in the cued-Go/NoGo task. Clinical Neurophysiology, 122(12), 2400-2407.
Ridderinkhof, K. R., van den Wildenberg, W. P., Segalowitz, S. J., & Carter, C. S. (2004). Neurocognitive mechanisms of cognitive control: the role of prefrontal cortex in action selection, response inhibition, performance monitoring, and reward-based learning. Brain & Cognition, 56(2), 129-140.
32 Salisbury, D. F., Rutherford, B., Shenton, M. E., & McCarley, R. W. (2001). Button-pressing affects P300 amplitude and scalp topography. Clinical Neurophysiology, 112(9), 1676-1684. Schmajuk, M., Liotti, M., Busse, L., & Woldorff, M. G. (2006). Electrophysiological activity underlying inhibitory control processes in normal adults. Neuropsychologia, 44(3), 384-395. Simmonds, D. J., Fotedar, S. G., Suskauer, S. J., Pekar, J. J., Denckla, M. B., & Mostofsky, S. H. (2007). Functional brain correlates of response time variability in children.
Neuropsychologia, 45(9), 2147-2157.
Smith, J. L., Jamadar, S., Provost, A. L., & Michie, P. T. (2013). Motor and non-motor inhibition in the Go/NoGo task: An ERP and fMRI study. International Journal of Psychophysiology, 87(3), 244-253.
Smith, J. L., Johnstone, S. J., & Barry, R. J. (2007). Response priming in the Go/NoGo task: The N2 reflects neither inhibition nor conflict. Clinical Neurophysiology, 118(2), 343-355. Smith, J. L., Smith, E. A., Provost, A. L., & Heathcote, A. (2010). Sequence effects support the conflict theory of N2 and P3 in the Go/NoGo task. International Journal of Psychophysiology, 75(3), 217-226.
Strik, W. K., Fallgatter, A. J., Brandeis, D., & Pascual-Marqui, R. D. (1998). Three-dimensional tomography of event-related potentials during response inhibition: evidence for phasic frontal lobe activation. Electroencephalogr Clin Neurophysiol, 108(4), 406-413.
van Veen, V., & Carter, C. S. (2002). The anterior cingulate as a conflict monitor: fMRI and ERP studies. Physiol Behav, 77(4-5), 477-482.
33 Yong-Liang, G., Robaey, P., Karayanidis, F., Bourassa, M., Pelletier, G., & Geoffroy, G. (2000). ERPs and behavioral inhibition in a Go/No-go task in children with attention-deficit
38 Figure 1: Effects of Congruence and Response Type on performance
A) Accuracy: bars represent group mean (± 1 standard error of the mean) correct response rate for each trial type
B) RT: bars represent group mean (± 1 standard error of the mean) response time (RT) for each trial type requiring a response
39 Figure 2: ERP waveforms at midline electrode sites
Group average ERP waveforms are shown for each trial type arranged according to the Electrode, Response and Congruence factors. Solid lines are shown for Congruent trials and dashed lines for incongruent trials. The left column shows Congruent (RRR) and Incongruent (NRN) trials for Simple Response at the frontal (Fz), fronto-central (FCz), central (Cz) and parietal (Pz) electrodes. The central column shows waveforms for the Congruent (NNN) and Incongruent (RNR) trials for No Response and the right hand column shows waveforms for the Congruent (RRR/LLL) and Incongruent (LRL/RLR) trials for Choice Response. Each plot shows amplitude in microvolts on the y axis and time in milliseconds on the x-axis.
40 Figure 3: Scalp topography of P3 for each trial type