NemaFlex: A microfluidics-based technology for standardized measurement of
1muscular strength of
C. elegans
2Mizanur Rahman,a Jennifer E. Hewitt,a Frank Van-Busselb, Hunter Edwardsa, Jerzy Blawzdziewiczb, Nathaniel J.
3
Szewczykc, Monica Driscolld and Siva A. Vanapalli*a
4
a Department of Chemical Engineering, TexasTech University, Lubbock, TX 79409, USA. E-mail:
5
b Department of Mechanical Engineering, Texas Tech University, Lubbock, TX 79409, USA. E-mail:
7
8
cMRC/Arthritis Research UK Centre for Musculoskeletal Ageing Research, University of Nottingham, Derby DE22
9
3DT, UK. E-mail: [email protected] 10
dDepartment of Molecular Biology and Biochemistry, Rutgers University, Piscataway, NJ 08854, USA. E-mail:
11
13
*Corresponding author: Siva A. Vanapalli (E-mail: [email protected])
14
Abstract 15
Muscle strength is a functional measure of quality of life in humans. Declines in muscle strength
16
are manifested in diseases as well as during inactivity, aging, and space travel. With conserved
17
muscle biology, the simple genetic model C. elegans is a high throughput platform in which to
18
identify molecular mechanisms causing muscle strength loss and to develop interventions
19
based on diet, exercise, and drugs. In the clinic, standardized strength measures are essential to
20
quantitate changes in patients; however, analogous standards have not been recapitulated in
21
the C. elegans model since force generation fluctuates based on animal behavior and
22
locomotion. Here, we report a microfluidics-based system for strength measurement that we
23
call ‘NemaFlex’, based on pillar deflection as the nematode crawls through a forest of pillars.
24
We have optimized the micropillar forest design and identified robust measurement conditions
25
that yield a measure of strength that is independent of behavior and gait. Validation studies
26
using a muscle contracting agent and mutants confirm that NemaFlex can reliably score
27
muscular strength in C. elegans. Additionally, we report a scaling factor to account for animal
28
size that is consistent with a biomechanics model and enables comparative strength studies of
29
mutants. Taken together, our findings anchor NemaFlex for applications in genetic and drug
30
screens, for defining molecular and cellular circuits of neuromuscular function, and for
31
dissection of degenerative processes in disuse, aging, and disease.
32
33
34
35
36
I. Introduction
38Skeletal muscle provides the contractile system critical for animal locomotion across phyla. The
39
conserved biology of muscle includes sarcomere composition and organization, the
calcium-40
initiated contractile mechanism, and the ATP-driven translocation of actin and myosin for force
41
generation1, 2. A powerful indicator of muscle health is strength —a measure of maximum force
42
that can be voluntarily exerted for a given task. Diagnosis of muscle degenerative disorders
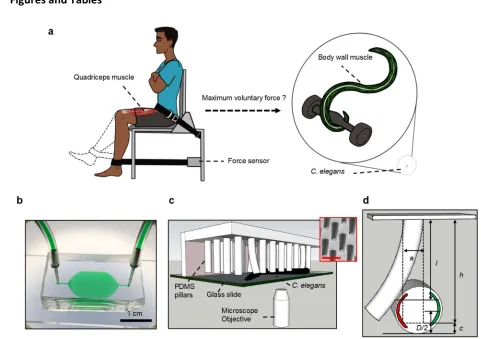
43
such as muscular dystrophy relies on strength and physical performance tests in the clinic3, 4.
44
Similar diagnostic evaluation is crucial for, sarcopenia and dynapenia, the age-related
45
progressive loss of muscle mass and muscle strength, respectively5, 6. Additionally, muscle
46
atrophy and strength declines are a major impediment for manned deep space exploration7.
47
Given conservation of basic muscle biology, simple genetic models such as Drosophila
48
melanogaster8 and the 959-celled Caenorhabditis elegans9, 10 constitute attractive platforms
49
with which to decipher the molecular mechanisms of age-10,11, disease-12, or microgravity-13
50
associated muscle decline. For example, studies in C. elegans have led to important new
51
insights into the assembly, maintenance, and regulation of striated muscle10, 14-16, with the
loss-52
of-function mutants in sarcomeric proteins showing reduced capacity to swim or crawl17-19.
53
These model organisms also offer a powerful means with which to investigate how diet,
54
exercise protocols, and drug interventions may combat muscle dysfunction. Still, the notion of
55
muscle strength and its measurement in these simple models has remained elusive.
56
A technical challenge in reporting muscle strength in invertebrate models is that its definition
57
crucially depends on system geometry and measurement protocol. As a result, even though
58
forces on the order of microNewtons have been reported to be exerted by C. elegans20-26; the
59
approaches used yield different values of forces due to worm locomotion, body posture, and
60
behavior. Without a measurement protocol that is reproducible and system geometry that is
61
validated, fluctuating forces cannot be used to extract a meaningful metric for strength.
62
Additionally, the influence of animal size on force production has not been established, even
63
though it is well recognized that animals from the same culture as well as mutants can have
64
different body sizes. Thus, force measures that reveal muscular strength independent of animal
65
behavior and approaches to compensate forces for variations in animal size, have not been
66
established in the C. elegans model.
67
In humans, precisely defined strength metrics such as maximum voluntary force (MVF) and one
68
repetition maximum (1RM) are absolutely essential to quantitate and compare subjects, which
69
constitutes the clinical basis of muscle physiology investigations27 (Fig. 1a). Here, MVF is
70
defined as the peak force recorded for a particular set of muscle (leg extensor, elbow extensor
71
etc.) during one trial28, 29, and 1RM is defined as the maximum weight that a person can lift for
72
one repetition30. It is imperative to recapitulate analogous metrics and standardize them in the
C. elegans model for the field to move forward with genetic studies on problems ranging from
74
Duchenne muscular dystrophy to muscle wasting due to aging to metabolic disorders.
75
Here we define a microfluidics-based system for strength measurement in nematodes by pillar
76
deflection that we call “NemaFlex” (Fig. 1b-d). We study the effects of micropillar forest design
77
and animal behavior to identify robust measurement conditions that define maximum
78
exertable force (MEF) as a measure that is reproducible and insensitive to animal locomotion
79
and behavior. Our force-velocity analysis in animals experiencing different confinements and
80
validation studies using a muscle contracting agent mutants indeed show that MEF is analogous
81
to MVF measured in humans. We also report a scaling factor to correct MEF for animal size,
82
thus establishing NemaFlex as a quantitative and reproducible system for measurement of
83
muscle strength among individual worms, mutants, and/or prospectively in an individual worm
84
with age or experimental intervention. Our findings establish the means to exploit drug,
85
genetic, and experiential outcomes that may define molecular and cellular circuits of muscle
86
use and maintenance, which in turn might inspire therapies for extended muscle healthspan.
87
88
II. Experimental
89Strains and worm preparation 90
C. elegans were maintained on E. coli OP50 bacterial lawns using standard protocol31. Wild-type
91
(WT) animals were Bristol isolate (N2). Other strains used in this study were unc-52(e669),
unc-92
112(r367ts)V, unc-17(e245), and lon-2(e678)X. Age synchronized, well-fed young adult animals
93
were used for all force measurement experiments unless otherwise indicated. Age
94
synchronized populations were obtained using a standard protocol. Approximately 20 gravid
95
adult animals were transferred to a NGM plate (previously seeded with bacteria E. coli OP50) by
96
hand picking and allowed to lay eggs on the bacteria lawn for 3 hours. After 3 hours, gravid
97
adults were removed from the plate. Hatched worms were cultured at 20°C. The age of animals
98
whose strength was evaluated is mentioned in either the main text or figure captions and is
99
given as the time from hatching.
100
Microfluidic device fabrication 101
The micropillar-based NemaFlex force measurement device, shown in Fig. 1b, was fabricated
102
using soft lithography32. Two master molds were used in this study. The first is a composite
103
arena design that contains three concentric circular regions (A1, A2, and A3) with varying pillar
104
diameters and spacing. This mold was used to optimize arena geometry for evaluation of
105
maximum exertable forces produced by a crawling worm. The measured dimensions of the
106
pillars in the A1, A2, and A3 regions are provided in Table 1. The second mold referred to as
“NemaFlex” in Table 1 is an arena containing pillar matrix with geometrical dimensions very
108
similar to region A3. We used this mold in all the post-optimization studies.
109
All the master molds used in this study were fabricated using the following procedure. A
two-110
layer mold was fabricated in SU-8 2050 negative photoresist (Microchem) on a 3" silicon wafer
111
as substrate (University Wafer)22. First, a 25-µm-tall, oval-shaped flat layer was fabricated,
112
which forms the boundary of the arena. On top of this layer, a second layer of 75-µm height
113
was fabricated with cylindrical holes that form the micropillars. This two-layer approach
114
provides a total chamber depth of approximately 100 µm and creates dangling (deformable)
115
pillars of height 75 µm (Fig. 1c,d).
116
Polydimethylsiloxane (PDMS) devices were casted (Sylgard 184 Part A (base) and Part B (curing
117
agent) 10:1 by weight; Dow Corning) over the SU-8 mold by curing for ~2 hours at 75˚C. The
118
PDMS replica was then treated in an air-plasma cleaner (Harrick Plasma, Ithaca, NY) for 1
119
minute and bonded to a 1x3" glass slide. Bonding was done ensuring the pillars did not collapse
120
or deform. Inlet and outlet holes were cored with a 1mm hole puncher (Accuderm) before
121
bonding.
122
Device preparation and worm loading into the device 123
Bonded and cleanedmicrofluidic pillar arenas were prepared by surface treating with 5 wt%
124
Pluronic F127 solution. Pluronic solution was loaded into the device through one of the inlets
125
and incubated for 30 minutes, followed by washing with M9 buffer. The pluronic treatment
126
minimizes protein/bacterial fouling and also helps to reduce bubble formation during worm
127
loading33.
128
Immediately before each strength experiment, plates were flooded with 3-4 mL of M9 solution
129
(approximately 100 animals/mL). For individual worm loading, the worm solution from the
M9-130
flooded culture plate was diluted to 10X (approximately 10 animals/mL). Single animals were
131
loaded into the device by using a syringe connected to tubing. Individual loading can also be
132
done by hand picking a single worm. Experiments involving the composite arena, levamisole
133
drug treatment, and body size effects were carried out with individuals. Muscle strength of
134
mutants was evaluated at a population level, in which case the identity of the worm is not
135
preserved during imaging. For population studies, approximately 25-30 animals were gently
136
injected into the NemaFlex using a 1 mL syringe. While retaining animals between pillar
137
obstacles, residual bacteria were removed from the device by flow of M9 buffer. In both the
138
individual and population experiments, animals were allowed to habituate in the arena for
139
approximately 5 minutes before imaging in the food-free environment.
140
Image acquisition 141
The imaging was conducted on two sets of microscopes and camera combinations. Most of the
(IX71, Olympus, Center Valley, PA) with image acquisition from a CCD camera (ImageEM,
144
Hamamatsu, Japan). The magnification used was 6.4X with an image resolution of 2.52
145
µm/pixel. Imaging for experiments dealing with arena design optimization, forced contraction
146
assay with levamisole, and influence of body size on strength were carried out using another
147
microscope (IX70, Olympus, Center Valley, PA) instrumented with a CCD camera (Retiga R6,
148
QImaging, Canada). The magnification used was 6X with an image resolution of 0.7 µm/pixel.
149
Images were acquired at 5 fps for a duration of 30-120 s of one single worm with a field of view
150
of 1880x1540 µm2. All imaging was conducted at a temperature of 20 1oC.
151
Image processing for quantitation of pillar displacements 152
Movies were processed offline using custom routines written in MATLAB (Mathworks, R2014b).
153
Worm diameters were measured manually using ImageJ 1.48v. Below, we outline the key steps
154
in the procedure for quantitating pillar displacement from the original images of a crawling
155
worm in the pillar arena (Fig. 2a). Pillar tracking algorithm and image processing steps are
156
described in detail in Supplementary Note 1.
157
A median filter is applied to each image (Fig. 2a) to eliminate the outlier pixels. The maximum
158
pixel value (i.e. brightest) at each pixel location across all frames provides the background
159
image. Likewise, the minimum pixel value (i.e. darkest) at each pixel location yields the
160
foreground image. As shown in Fig. 2b, these operations make the worm’s entire trajectory
161
visible in the foreground image and absent from the background image. The background
162
contains mostly pillars (see Fig. 2c) and extraneous objects not part of the worm’s trajectory.
163
A “mask” is created from the foreground, which contains the worm trajectory with contiguous
164
pillars only (Fig. 2b). The mask (Fig. 2d) is then applied to the background image to identify the
165
candidate pillar (Fig. 2f) and candidate frames for tracking. In parallel, the background image
166
(Fig. 2c) is used to identify pillars and their base locations (Fig. 2e) by using circular
Hough-167
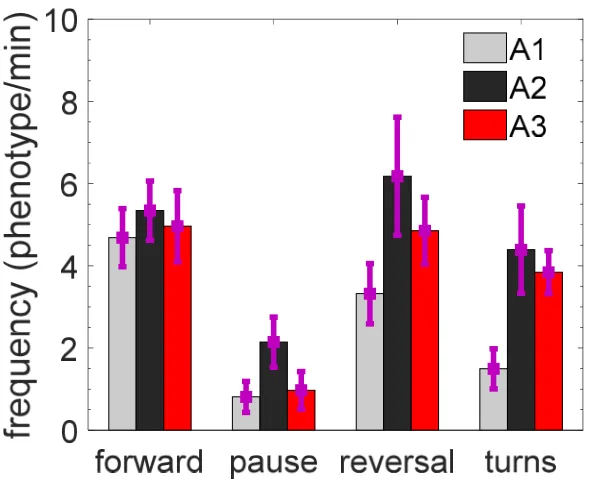
transform (CHT). A grid connecting the pillar locations (Fig. 2g) is used to eliminate spurious
168
pillars due to dirt, air bubble etc. Verified candidate pillars are then subject to refined CHT, each
169
one at a time (Fig. 2h-j), and displacements of the pillars are calculated from their base
170
locations. Supplementary Movie 1 shows the output of our pillar tracking algorithm.
171
Experimental error in the measurement of forces 172
The error in measurement of forces results from uncertainties associated with quantifying the
173
pillar deflection. Uncertainty in determining pillar deflection can result from several sources
174
including improper fitting of the boundaries of the pillar (e.g. due to day-to-day variations in
175
light intensity), minor heterogeneity in the size distribution of pillars during microfabrication,
176
and mechanical drift in the microscope stage. To account for these different sources of error
177
cumulatively, we tracked a single undeflected pillar from twenty different movies (of duration ≈
178
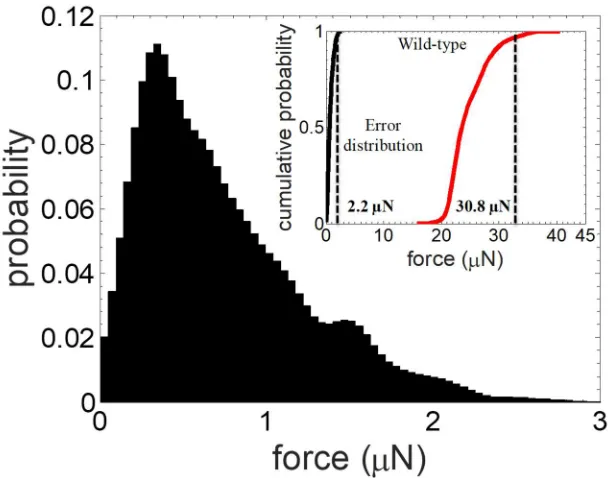
30s) acquired during the study and binned the putative forces to produce a probability
distribution (Fig. 3). This maximal force distribution has a mean at 0.9 µN, a standard deviation
180
of 0.8 µN, and the force corresponding to 95% cumulative probability, f95 value, of 2.2 µN (see 181
inset of Fig. 3). Given that the force values due to the stationary pillar can reach as high as 2.2
182
µN, we use ± 2.5 µN as a conservative estimate of the error in our force measurement. This
183
error is less than 10% of the population-averaged strength of 60-hour-old wild-type animals, as
184
shown in the inset of Fig. 3. There is also zero overlap between the two force distributions,
185
allowing clear distinction between true forces and errors.
186
Additional bias in strength measurement could be potentially introduced when the worm body
187
diameter is larger than the pillar spacing, as in the region A3 in the composite arena where the
188
worm confinement D/s = 1.16 (Table 1). Here D is the worm body diameter at mid-length and s
189
is the edge-to-edge pillar spacing. In this case, a default force will be registered even when the
190
worms are not active. These default forces are smaller than the maximal forces exerted by the
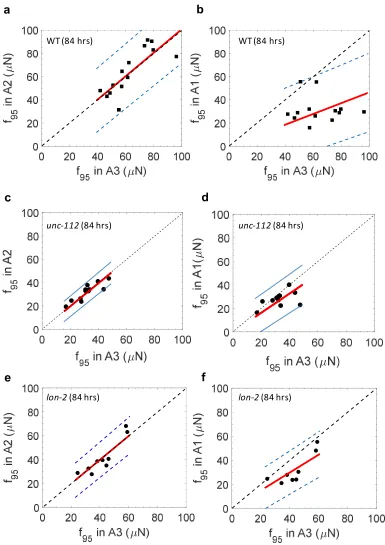
191
worm. Since our strength calculation analysis only selects the maximal forces, the measured
192
value is not affected by these default weak forces induced by higher confinement of the worm
193
body in the pillar arena.
194
To estimate the magnitude of the default force, we choose hypothetical worm body diameters
195
that produce confinement above 1 and calculate the corresponding passive deflections (Δ) and
196
forces (F). As shown in SupplementaryTable 1, for all the cases considered, Δ < 5 μm and F < 12
197
μN. These values are smaller than the maximal deflections and forces experimentally observed
198
for a wild-type animal of similar body size that is actively pushing the pillars (see for example,
199
Supplementary Movie 2 which shows the large pillar deflections for a worm with confinement
200
level of 1.07). Moreover, we observe that when the worm pushes the pillars on one side of the
201
body, sufficient gap is created and therefore pillars on the other side of the body do not
202
experience any push. Thus small forces due to passive deflections occur rarely in an actively
203
crawling worm.
204
Animal velocity and gait analysis 205
To calculate the crawling speed of C. elegans, the displacement of the midpoint of the body
206
skeleton was tracked in time. For force-velocity correlation, instantaneous velocity from two
207
consecutive frames was calculated, and the correlation was plotted using the maximal force in
208
the later frame. For characterizing the mean crawling speed, the entire episode was used, and
209
displacements of the midpoint were measured in time. Gait analysis included measuring the
210
wavelength and amplitude of the undulatory forward motion by determining the distance
211
between two peaks in the body wave and the peak height, respectively. Data from ten animals
212
was measured and averaged.
213
20-30 animals were loaded into the micropillar chambers housing individual worms. Since the
215
loading process can take 15-20 min, bacteria suspension of 100 mg E. coli OP50/mL of
S-216
complete was added to each chamber after worm loading so that the individuals did not suffer
217
from food deprivation. Imaging of each animal before exposure to levamisole was carried out
218
after removing food with S-complete and allowing the animal to habituate for 5 minutes in the
219
food-free environment. The muscle contraction experiment was carried out with 1 mM
220
levamisole solution in S-complete. The levamisole solution was added to the individual
221
chambers using a 1 mL syringe after the first round of imaging. Muscle contraction induced by
222
levamisole (worm body length contraction) was captured 30 seconds after addition of
223
levamisole solution and continued for 3 minutes or until the worm was paralyzed. ImageJ 1.48v
224
was used to measure the length of the worm before and after the levamisole exposure.
225
Force characterization during long-time variation in behavior 226
Individual wild-type young adult worms were loaded into the pillar chambers. The first set of
227
images was captured 2 minutes after loading, which is denoted as t = 0 hr. Food (100 mg E. coli
228
OP50/mL of S-complete) was added at the 1-hour mark to avoid food limitation. The food was
229
then removed at the 2-hour time point, and then 2 minutes after food removal the worm was
230
imaged to obtain strength data at t = 2 hr and 2.5 hr time points.
231
Data analysis 232
All the data analysis was conducted in MATLAB (Mathworks, R2014b). Cumulative probability
233
distributions were generated using Kernel Density Estimate (KDE). The bin size is estimated
234
using the built-in asymptotic approximation. The force value at a cumulative probability of 95%
235
(f95) is taken as the strength of the animal. A two-sample t-test was used to determine 236
significance of data from muscle contraction assays. The Wilcoxon rank-sum test (WRST) was
237
used to compare genetic mutants.
238
239
III. Results and Discussion
240Basic principle of NemaFlex and force analysis. 241
At the core of the NemaFlex technology is a liquid-filled microfluidic chamber containing elastic
242
micropillars dangling from the chamber roof that can be deformed by a nematode push (Fig. 1c, 243
d). As C. elegans threads through the pillars, the individual pillar deflections Δ are quantified
244
using a microscope-camera system and image analysis (see Supplementary Movie 2). The force
245
F causing the observed pillar deflection is calculated using the Timoshenko theory for an elastic
246
rod22, 34,
(1)
248
In Eqn. (1), a, h, and I are the diameter, height, and moment of inertia of the cylindrical pillar
249
respectively. E and γ are the elastic modulus and Poisson’s ratio of the polydimethylsiloxane
250
(PDMS) pillar respectively. The point of contact of the worm with the pillar edge is denoted by l
251
= h – (D-c)/2, which is calculated knowing the worm diameter D at mid-length and the clearance
252
c between the pillar edge and the bottom surface of the chamber. The values used for the
253
different parameters in Eqn. (1) as well as its validity for force measurement are discussed in
254
Supplementary Note 2.
255
In general, we find that the magnitude of the pillar forces depends on the contact point along
256
the nematode body, body configuration, and behavioral characteristics of C. elegans. Given this
257
probabilistic nature of pillar forces exerted by the worm, we sought to establish a robust and
258
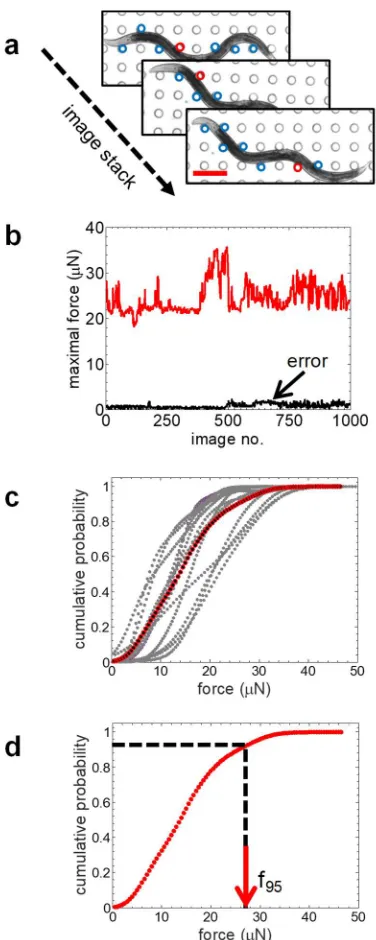
reproducible procedure for quantifying animal strength. Fig. 4a-d shows this procedure in
259
which we typically record a 30 second behavioral episode per animal. In every image of the
260
acquired video, we identify the pillar with the maximal deflection (labeled red in Fig.4a among
261
all the candidate pillars), allowing us to extract an instantaneous maximal force value from each
262
frame (Fig. 4b). We bin all the instantaneous maximal force values and generate a cumulative
263
force distribution curve that defines a probability for exerting a maximal force lower than or
264
equal to a given value (Fig. 4c). From this distribution, we define the maximal force
265
corresponding to 95% cumulative probability, f95, as the maximum exertable force (MEF) of C. 266
elegans (Fig. 4d). Our error in force detection, measured from pillars that are not in animal
267
contact, is markedly lower than the maximal forces exerted by the nematode (Fig. 4b), with a
268
cumulative measurement error of 2.5 µN in the f95 value (c.f. Fig. 3). 269
Our approach allows defining the MEF at the level of an individual or a population, depending
270
on whether the data constitute maximal forces from a single worm or a collection of worms.
271
The cumulative force distribution curve for individuals typically consists of 200 data points, and
272
for a population at least 2000. Fig. 4c shows the cumulative force distribution curve for
wild-273
type (WT, age = 60 hrs) individuals. We find variability in the f95 values between individuals 274
suggesting that some animals are naturally stronger than others, even though their body
275
diameters are very similar (5% variation of mean body diameter).
276
Resistance to locomotion in the pillar arena determines maximal forces 277
The purpose of our study is to establish a reliable measure for C. elegans strength that is
278
equivalent to maximum voluntary force in humans. To achieve this, we sought to identify
279
micropillar forest designs that create high mechanical resistance to locomotion. Analogous to
280
human strength evaluation where strong forces are registered when resistance to motion is
281
F= D
l3
3EI +
a2(1+
g
)l4EI +
l2(h-l)
high (c.f. Fig. 1a), we expect that animals in tight pillar arenas experience strong resistance to
282
locomotion and produce large forces. Below we show results supporting that animals produce
283
strong forces in highly resistive arenas and discuss the existence of different regimes of
284
resistance to locomotion based on the size of nematode relative to gap between pillars.
285
Highly resistive pillar environment is characterized by low velocity and strong forces.To
286
identify an arena geometry that induces high resistance to locomotion and makes C. elegans
287
produce maximal forces frequently we fabricated a composite arena (Fig. 5a) that contained
288
three regions (A1, A2, and A3) with distinct pillar diameters (in the range of a ≈ 40 – 60 µm) and
289
gap between pillars (s ≈ 100 – 60 µm) (Supplementary Note 3). Regions A1, A2 and A3
290
produced confinement levels of D/s ≈ 0.67, 0.85, and 1.16 for wild type adults respectively (Fig. 291
5b). The composite arena is unique as it allowed us to investigate the dependence of
force-292
velocity correlation and gait parameters on animal confinement.
293
Pooling data from individuals (WT, age = 84 hrs), in Fig. 5c-e we show the maximal pillar force
294
(from each image) versus the instantaneous animal velocity in the three arenas. We observe
295
that in the moderately confined A1 arena, animals move at velocities as large as 600 µm/s and
296
rarely exert forces more than 80 N (Fig. 5c). In contrast, animals in the strongly confining A3
297
arena move at much slower velocities and often exert forces > 80 N (Fig. 5e). Such large forces
298
occur less frequently in arena A2 (Fig. 5d). Scoring the forward crawling locomotion, we find
299
that between A1 and A3 arenas, the body wavelength reduces by 12% and amplitude varies by
300
3%, suggesting that in the moderate-strong confinement regime the force-velocity correlation
301
is much more strongly affected than the forward crawling gait.
302
Frequent exertion of maximal forces in A3 arena can be understood from the high mechanical
303
resistance to locomotion provided by this tight pillar arena where the nematode muscles push
304
against the pillar, but its body cannot adjust its position in response to reaction forces due to
305
the body being constrained simultaneously by multiple pillars. Evidence for the strong
306
mechanical resistance is exemplified by the high frequency of turns and reversals in the highly
307
resistive A3 and A2 arenas compared to A1 (Fig. 6).
308
Identification of different regimes of resistance to locomotion. Our experimental results thus
309
far and previous work in pillar environments22-24, 35-38 (see Supplementary Table 2 for
310
description of pillar geometries used in prior works), paint the following general picture;
311
depending on the body size and pillar forest geometry, C. elegans locomotion between
312
microfluidic pillars can be classified as non-resistive, moderately resistive or highly resistive. The
313
existence of such regimes has been previously unrecognized.
314 315
In the non-resistive regime, the submerged nematode is typically in contact with one or two
316
pillars (Fig. 7a). The forces would be low here because the nematode translates and rotates in
response to a body contact with a pillar, exhibiting swimming-like behavior. An example of this
318
regime was shown by Majmudar et al., where for D/s = 0.17, nematode swim trajectories were
319
observed to be diverted by mechanical interactions with the pillars38.
320 321
In the moderately resistive regime, frequent contacts with more than two pillars occur (Fig. 7b)
322
and the body wave conveniently fits into the space between pillars; the velocity is high because
323
pillars provide transverse resistance enabling efficient forward locomotion. Forces are
324
moderate because the nematode can fit in the available space with only minor adjustment of
325
body posture. This picture is consistent with our results in A1 arena and further supported by
326
the work of Ryu and coworkers36 who showed that when D/s ≈ 0.35 – 0.5 C. elegans swimming
327
speed is enhanced.
328 329
In the highly-resistive regime which corresponds to our arenas A2 and A3, frequent contacts
330
with multiple pillars occur (Fig. 7c). Animal velocity is low and forces are high because of the
331
incompatibility between nematode gait and pillar configuration. Our observations are in
332
agreement with the work by Johari et al. and Khare et al., who used arenas with D/s = 0.86 -1.6
333
and showed that animals exert strong forces23, 24.
334
The existence of these regimes indicates that NemaFlex device needs to operate in the highly
335
resistive regime to score MEF. However, even in this highly resistive regime, individual pillar
336
forces fluctuate from low to high as evidenced by our cumulative force distribution curves, thus
337
requiring robust measurement and data analysis protocols for standardized strength
338
measurement. Previous works have been unable to establish behavior- and gait-independent
339
measures of strength that are indicative of MVF in C. elegans.
340
Maximum exertable force f95 is a reliable measure to score muscle strength in C. elegans 341
In this section, we show that MEF, our proposed metric of C. elegans strength, yields consistent
342
values in highly resistive pillar arenas and that it is independent of gait and behavior. By using a
343
drug that contracts muscles we confirm that MEF due to induced muscle contractions is the
344
same as that calculated from force distribution due to voluntary muscle action. Finally, we
345
demonstrate that MEF can be used to reliably score neuromuscular weakness in mutants.
346
Optimized pillar arena produces consistent readout of MEF. Given that even in the highly
347
resistive pillar environments forces fluctuate, we asked whether MEF for the same individual
348
changes due to different degrees of confinement in A1, A2, and A3 arenas. Our hypothesis was
349
that if MEF is truly indicative of the maximum voluntary force then in the highly resistive arenas
350
A2 and A3 we should obtain the same values for MEF. In Fig. 8a, we show the results for
351
individual wild-type animals and find that the MEF in arenas A2 and A3 show a near-perfect
352
slope = 0.46 ± 0.07 shown in Fig. 8b. Thus f95is consistent between the highly resistive A2 and 354
A3 arenas.
355
We also tested unc-112, a mutant that is weaker due to muscle defects26 and lon-2, a mutant
356
that grows approximately 1.5 times longer than wild type. For unc-112, we find that the
357
correlation of MEF values in arenas A1 and A3 is off from unity (slope = 0.81 ± 0.07), but in A2
358
and A3 we again observe a near-perfect correlation with slope 0.99 ± 0.04 (Fig. 8c, d). We find
359
similar results for lon-2 which shows a correlation with slope 0.98 ± 0.05 in arenas A2 and A3
360
(Fig. 8e, f). Thus, in WT, unc-112 and lon-2 we obtain consistent f95in the highly resistive A2 361
and A3 arenas. Previously Johari et al.23 and Khare et al.24 computed the time-average of the
362
pillar forces favg to characterize C. elegans muscle force. We checked to see how well this 363
measure correlates from the force data of individuals in A1, A2 and A3 arenas. We find that favg 364
from different arenas are inconsistent in WT animals and unc-112 mutant (see Supplementary 365
Note 4), suggesting that f95 is a much more reliable metric of strength. 366
Thus, our results from the composite arena provide compelling evidence that both the highly
367
resistive arenas A2 and A3 maximize force exertion, and our strength metric f95 is invariant for a 368
given individual as long as animals are confined to 0.85 < D/s < 1.16. We settled on using A3
369
arena for the NemaFlex device since maximal forces are more frequent in this arena than A2
370
arena (Fig. 5d,e) and smaller body-sized animals fit better in A3. The actual dimensions of the
371
NemaFlex device are: a = 38.3 µm 0.4 µm, s = 61.7 µm 2.9 µm, h =71.8 ± 2.9 μm, with the
372
pillars arranged in a square lattice within a ≈ 1 cm2 oval shaped arena (Fig. 1b).
373
It is possible that the limits of validity of confinement that we have established here to obtain
374
consistent MEF readout may vary, for example for C. elegans of different sizes or mutants. In
375
such cases, the composite-arena approach with individuals that we have demonstrated here is
376
a useful means to identify the optimal confinement range for maximum force exertion.
377
MEF is independent of locomotory gait. To address whether the locomotory gait impacts MEF
378
in the NemaFlex device we isolated episodes from our videos where the animal (WT, age = 60
379
hrs) was making a forward crawl or omega turn or reversal (Fig. 9a-d). We note that the
380
forward crawl involved either a long-wave or a short-wave body posture with the short-wave
381
being less frequent (Fig. 9a,b). The cumulative probability force distributions corresponding to
382
each of these locomotory modes is shown in Fig. 9e. We find that the omega turns and
383
reversals produce larger average force; however, the MEF estimates are very similar: f95 (long 384
wave) = 20.98 µN, f95 (short wave) = 21.04 µN, f95 (reversal) = 22.38 µN, and f95 (omega) = 21.32 385
µN. Thus, the strength measure MEF provided by NemaFlexis not strongly dependent on
386
animal gait.
387
MEF is insensitive to time-variation of behavior. Next, we evaluated whether MEF is sensitive
388
to time variation of behavior by recording behavioral episodes of individuals. In a 30-second
behavioral episode we typically observed forward crawls, omega turns, and reversals (c.f. Fig. 390
6). We analyzed contiguous images of 30-second duration with a random starting point in the
391
video. In complementary sampling, we scored non-repeating, discrete images randomly
392
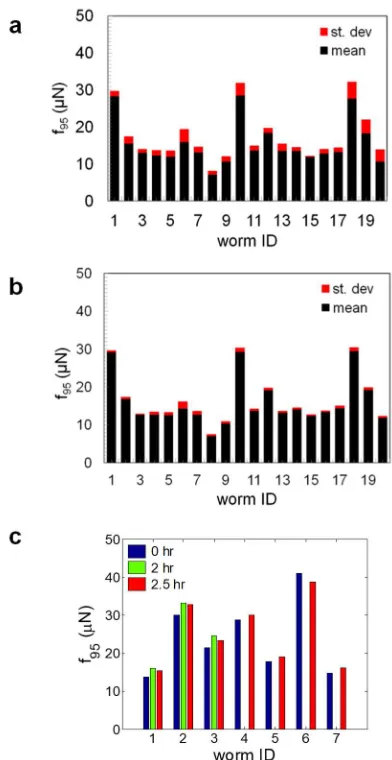
(totaling 30-second duration) from the full behavioral episode. The f95of individuals calculated 393
either from contiguous or random sampling of the behavior is shown in Fig. 10a,b. We find that
394
in both contiguous and discrete sampling f95 typically varied by less than 10% of the mean value. 395
This less than 10% variation is commensurate with the error in force measurement shown in
396
Fig. 3 indicating therefore that MEF is insensitive to short-time variation in behavior.
397
We also sampled the behavior of an individual after a long time interval (0, 2, 2.5 hrs), and in
398
this case the f95 values change by less than 10% between the three time points (Fig. 10c). Thus, 399
the MEF is also unaffected by long-time variation in behavior. Together, these results suggest
400
that sampling a 30-second behavioral episode is sufficient to determine the MEF of C. elegans
401
and does not rely strongly on the details of behavior. We note that for some mutants it is
402
possible that longer behavioral episodes may need to be tracked to achieve a statistically
403
invariant MEF.
404
MEF before and after drug-induced muscle contractions is the same. As an important test to
405
assess whether MEF measure corresponds to the maximum muscular strength, we induced
406
muscle contractions by exposing each animal to the cholinergic agonist levamisole and
407
comparing its f95 scores before and after drug treatment (Fig. 11a). Levamisole is known to bind 408
to acetylcholine receptors in the body wall muscle of C. elegans, causing prolonged excitation of
409
the muscles, shortening of body length, and eventually paralysis39. As shown in Fig. 11b, we
410
indeed observe appreciable reduction in body length due to levamisole exposure
411
(Supplementary Movie4a & b).
412
In Fig. 11c, we show the force data for individual animals of three different ages (60, 76, and 84
413
hours) and find that the f95 value after levamisole treatment shows an excellent linear 414
correlation with the f95 score of untreated crawling worms, i.e. f95lev+≅f95lev-(slope for 60 hrs = 415
0.89 ± 0.19, slope for 76 hrs = 0.85 ± 0.13, and slope for 84 hrs = 1.08 ± 0.16), supporting that
416
MEF quantitates the maximum muscular strength of C. elegans. It is remarkable that even
417
though some animals are weak or strong to begin with due to differences in age or individual
418
variability, the f95after drug exposure correlates well for both the weak and strong animals, 419
highlighting the robustness of our strength measure.
420
MEF detects muscle strength weakness in mutants. Given that NemaFlex measures the
421
maximum strength of C. elegans, we tested its capability to detect strength changes due to
422
genetic defects in body wall muscles and neuromuscular signaling. We measured strength in
423
the muscle mutants unc-112 and unc-52, which have impaired production of the sarcomere
424
proteins kindlin and perlecan respectively9, 40, 41. We also tested the mutant unc-17, which has
contractions39, 42. In all three mutants, we found that force production decreased compared to
427
wild-type animals (f95 =11.92, 16.61, 22.74 µN, and 28.43 µN for unc-112, unc-52, unc-17, and 428
wild-type respectively; Fig. 11d), confirming that the NemaFlex method can reveal
429
neuromuscular weakness.
430
Influence of body size on muscular strength in C. elegans
431
Harnessing the full capability of NemaFlex for applications ranging from dissecting
432
developmental biology to understanding neuromuscular disorders and aging requires
433
evaluation of how C. elegans’ body size affects its muscular strength. For example, individuals
434
from a synchronized culture of WT animals have differences in body size (Supplementary 435
Figure5), raising the question of whether some animals appear stronger simply because of
436
their larger size. A similar question arises during mutant screenings in which some mutants may
437
be smaller than WT or might develop more slowly than WT and therefore might be smaller at
438
the time of comparison. In aging studies, it is also essential to decouple the strength changes
439
due to frailty from those that might be attributed to animal size, which can change during adult
440
life43.
441
Muscular strength depends strongly on body diameter but not length. To address the
442
influence of body size, we measured the mid-body diameter, length, and strength of at least 80
443
age-matched individuals of WT and lon-2 mutants, which are longer than wild type (Fig. 12a-d).
444
We find that even though the mean length of lon-2 mutants is ≈1.3 times that of wild-type
445
animals (Fig. 12a, b), the muscular strength of these two populations is not statistically
446
different (Fig. 12c), suggesting that the worm body length does not significantly influence the
447
muscle strength recorded by NemaFlex. In striking contrast, we observe a strong increase of
448
muscle strength with the worm body diameter (Fig. 12d). The data fit to the scaling relationship
449
f95 ~ Dm,with m = 3.32 ± 0.48 and 3.04 ± 0.30 for WT and lon-2 animals respectively. 450
To understand the relationship between worm body diameter and muscular strength, we
451
consider active bending of the worm body that produces pillar forces whose vector sum is
452
nearly zero (Fig. 12e, i). These pillar forces are produced by C. elegans due to changes in body
453
curvature induced by contraction or relaxation of its muscles. For the example shown in Fig. 454
12e, the curvature increase is induced by tension in the dorsal contracting muscle (Fig. 12e, ii),
455
and it is decreased during dorsal relaxation (Fig. 12e, iii). The reason why thick animals exert
456
higher forces is analogous to why thick elastic rods require more force to bend than thin rods.
457
This qualitative argument may explain the influence of body diameter on C. elegans’ maximal
458
muscle strength measures.
459
A biomechanics model explains D3 scaling. To develop a simple model that incorporates the 460
effect of body diameter, we consider the bending moment (M) induced in the muscles of a
461
human arm that is lifting a weight (F), i.e. M = F×L, where L is the lever arm (Fig. 12f). Applying
this analogy to the bending moment introduced in the worm muscles while pushing against
463
pillars, we get M = F×L ~ T×D, where T is the muscle tension in the worm body (Fig. 12g).
464
Assuming the muscle tension is proportional to the cross-sectional area of the muscle (Am) and
465
the lever arm is equivalent to pillar spacing, we have F ~ Am×D/s. Since Am is proportional to the
466
worm body cross-section, i.e. Am ~ D2, we finally have 467
F ~ D3/s (2)
468
Eqn. (2) suggests that f95 should scale as the cube of worm body diameter and is inversely 469
proportional to the pillar spacing.
470
We tested the relation F ~ D3, by considering wild-type animals of different age and three 471
mutants (Table 2). We find that the data agrees reasonably well with the predicted cubic
472
dependence on worm body diameter in all the tested cases. Interestingly, we observe that even
473
in animals (WT, age = 48, 55 hrs) that have confinement less than our optimal range of 0.85 –
474
1.16, the exponent is close to 3. Furthermore, the fact that the f95 values of individuals were 475
lower in arena A1, which has larger pillar spacing than arenas A2 and A3 is consistent with Eqn.
476
(2). Indeed, we find that the ratios of f95 in A3 and A1 are approximately inversely proportional 477
to the pillar spacing in the respective arena sections,supporting our simple scaling analysis.
478
Our data set shows that f95 ~ D3 and it is possible that deviations from the D3 scaling may occur 479
in some mutants or older animals. In such cases deviations from D3 scaling can be potentially 480
corrected by knowing the detailed anatomy of the muscle cross-sectional area. If deviations still
481
exist then it might indicate intrinsic differences in the tension of the muscle fibers in the
482
nematode. Investigation of such differences resulting from genetic defects or age is one of the
483
main motivations for the development of the NemaFlex system.
484
IV. Conclusions and Outlook 485
C. elegans is a powerful genetic model with conserved muscle biology, and over the last few
486
decades new insights have been gained into the assembly, maintenance, and regulation of
487
striated muscle that are usually applicable to all animals. Kinematic measures, for example
488
swim frequency or crawling speed, derived from locomotory assays have been typically used to
489
assess neuromuscular function in C. elegans44. More recently, propulsive forces have been
490
determined by tracking velocity fields and body kinematics during swimming45 by challenging
491
worms to swim up inclined surfaces46 and by measuring drag coefficients of crawling animals47.
492
In a parallel effort, building on advances in microfluidics48, important attempts for measuring
493
forces generated by moving C. elegans have been made using piezoresistance sensors20 and
494
deformable pillars22-26. However, these prior efforts reported forces that vary depending on
495
pillar arena geometry, worm velocity, and body posture;thus, none of these yields a maximum
496
force that is independent of animal behavior and accounts for variations in animal size. Without
a behavior- and size-independent strength measurement, it is difficult to standardize muscle
498
force investigations in C. elegans.
499
Here we have optimized the micropillar forest design, defined the measurement conditions,
500
and fine-tuned the workflow analysis so that NemaFlex can reliably score the maximum
501
exertable force in C. elegans. To confirm that NemaFlex indeed reports behavior-independent
502
strength, we evaluated different pillar spacings and duration of behavioral episodes and
503
showed that animals push as hard as they can once they reach a certain level of confinement; a
504
behavioral episode as low as 30 seconds is sufficient to capture a statistically invariant MEF for
505
young adults. The force measures before and after levamisole-induced full muscle contractions
506
were found to be similar, which supports our metric of maximum force. Indeed, the levamisole
507
experiment shows that C. elegans MEF is similar to human MVF - a critical advance for the
508
ability to compare experimental data across muscle studies.
509
Recognizing that animals from the same culture might have different body sizes or that
510
mutations may cause variation in body size, we investigated the influence of body size on MEF.
511
We showed that MEF is independent of the body length, but it strongly depends on body
512
diameter. Importantly, we uncovered a relationship of strength with C. elegans diameter that is
513
consistent with a scaling analysis in which bending moments due to maximum external force
514
and internal muscle tension balance each other. Thus, we have produced a compensation
515
factor for body size that enables animals of different age, genetic makeup, or experience to be
516
fairly compared.
517
In humans, relative strength is a compelling indicator of muscle homeostasis, physical training,
518
and disease. As we model these conditions in invertebrates, there is a critical need to establish
519
standardized measures of strength that have relevance in human muscle physiology. The
520
NemaFlex technology addresses this gap by providing a robust analog of MVF in vertebrates.
521
With current throughput of strength evaluation being ~10 min/worm (loading, imaging, image
522
analysis, and validation), the NemaFlex system is well equipped for targeted investigations on
523
disease conditions that can be modeled in C. elegans. High throughput genetic and drug screens
524
are also possible with NemaFlex, although this would require further microfluidic automation
525
and parallelized analysis. At a more fundamental level, NemaFlex may help in defining
526
molecular and cellular circuits of neuromuscular function49.
527
Author contributions
528MR designed and fabricated the devices, FB and MR wrote the image analysis code, MR and JEH
529
performed the experiments and analyzed data, and HE maintained worm cultures and assisted
530
with experiments. SAV, MD, NJS, JB and MR designed the experiments and interpreted the
531
data. SAV, MD and MR wrote the paper. SAV supervised the study. All authors read and
532
commented on the manuscript.
Acknowledgements
534This work was partially supported by funding from NASA (Grant No. NNX15AL16G), NIH (Grant
535
Nos. R21 AG050503, R01 AG051995-01A1), NSF CAREER (Grant No.1150836), CPRIT (Grant No.
536
RP160806), and BBSRC (grant number N015894). We are grateful to Deepak Solomon for
537
initial assistance in this project,Rebecca Gabrilska and Kendra Rumbaugh for assistance with
538
bacterial cultures, Anna Hewitt for graphic rendition of figures, Ricardo Laranjeiro for useful
539
discussions on exercise training of C. elegans and critical reading of the manuscript, and Alex
540
Trindade for help with data analysis and statistics. We thank the Caenorhabditis Genetics
541
Center (CGC) for providing some of the strains, which is funded by NIH Office of Research
542
Infrastructure Programs (P40 OD010440). We also thank members of the Driscoll and
543
Blawzdziewicz lab for useful discussions.
544
545
Conflicts of interest
546There are no conflicts to declare.
547
548
549
550
551
552
553
554
555
556
557
558
559
References
5611. A. Biewener, Journal of Experimental Biology, 2016, 219, 285-294.
562
2. W. Frontera and J. Ochala, Calcified Tissue International, 2015, 96, 183-195.
563
3. T. Ansved, Acta Physiologica Scandinavica, 2001, 171, 359-366.
564
4. A. Lerario, S. Bonfiglio, M. Sormani, A. Tettamanti, S. Marktel, S. Napolitano, S. Previtali,
565
M. Scarlato, M. Natali-Sora, E. Mercuri, N. Bresolin, T. Mongini, G. Comi, R. Gatti, F.
566
Ciceri, G. Cossu and Y. Torrente, Bmc Neurology, 2012, 12.
567
5. B. Clark and T. Manini, Journals of Gerontology Series a-Biological Sciences and Medical
568
Sciences, 2008, 63, 829-834.
569
6. S. Cheng, Y. Yang, F. Cheng, I. Chen and R. Wang, International Journal of Gerontology,
570
2014, 8, 197-202.
571
7. G. Adams, V. Caiozzo and K. Baldwin, Journal of Applied Physiology, 2003, 95,
2185-572
2201.
573
8. N. Piazza, B. Gosangi, S. Devilla, R. Arking and R. Wessells, Plos One, 2009, 4.
574
9. K. Gieseler, H. Qadota and G. M. Benian, in Development, structure, and maintenance of
575
C. elegans body wall muscle (August 23, 2016), WormBook, ed. The C. elegans Research
576
Community, WormBook, doi/10.1895/wormbook.1.81.2, http://www.wormbook.org,
577
DOI: doi/10.1895/wormbook.1.81.2.
578
10. D. Moerman and A. Fire, in 16 Muscle: Structure, Function, and Development. Cold
579
Spring Harbor Monograph Archive , North America, 33, jan. 1997. Available at:
580
https://cshmonographs.org/index.php/monographs/article/view/5051%2C . DOI: DOI:
581
10.1101/087969532.33.417.
582
11. L. Herndon, P. Schmeissner, J. Dudaronek, P. Brown, K. Listner, Y. Sakano, M. Paupard,
583
D. Hall and M. Driscoll, Nature, 2002, 419, 808-814.
584
12. J. Chamberlain and G. Benian, Current Biology, 2000, 10, R795-R797.
585
13. A. Higashibata, T. Hashizume, K. Nemoto, N. Higashitani, T. Etheridge, C. Mori, S.
586
Harada, T. Sugimoto, N. J. Szewczyk, S. A. Baba, Y. Mogami, K. Fukui and A. Higashitani,
587
2016, 2, 15022.
588
14. J. Zengel and H. Epstein, Cell Motility and the Cytoskeleton, 1980, 1, 73-97.
589
15. G. Benian, J. Kiff, N. Neckelmann, D. Moermann and R. Waterston, Nature, 1989, 342,
590
45-50.
16. K. Mercer, R. Miller, T. Tinley, S. Sheth, H. Qadota and G. Benian, Molecular Biology of
592
the Cell, 2006, 17, 3832-3847.
593
17. H. Hwang, D. Barnes, Y. Matsunaga, G. Benian, S. Ono and H. Lu, Scientific Reports, 2016,
594
6.
595
18. J. Nahabedian, H. Qadota, J. Stirman, H. Lu and G. Benian, Methods, 2012, 56, 95-102.
596
19. Y. Matsunaga, H. Qadota, M. Furukawa, H. Choe and G. Benian, Molecular Biology of the
597
Cell, 2015, 26, 2096-2111.
598
20. J. Doll, N. Harjee, N. Klejwa, R. Kwon, S. Coulthard, B. Petzold, M. Goodman and B.
599
Pruitt, Lab on a Chip, 2009, 9, 1449-1454.
600
21. P. Liu, D. Mao, R. Martin and L. Dong, Lab on a Chip, 2012, 12, 3458-3466.
601
22. A. Ghanbari, V. Nock, S. Johari, R. Blaikie, X. Chen and W. Wang, Journal of
602
Micromechanics and Microengineering, 2012, 22, 095009.
603
23. S. Johari, V. Nock, M. Alkaisi and W. Wang, Lab on a Chip, 2013, 13, 1699-1707.
604
24. S. Khare, A. Awasthi, V. Venkataraman and S. Koushika, Biomicrofluidics, 2015, 9,
605
014111.
606
25. Z. Qiu, L. Tu, L. Huang, T. Zhu, V. Nock, E. Yu, X. Liu and W. Wang, Biomicrofluidics, 2015,
607
9.
608
26. T. Etheridge, M. Rahman, C. Gaffney, D. Shaw, F. Shephard, J. Magudia, D. Solomon, T.
609
Milne, J. Blawzdziewicz, D. Constantin-Teodosiu, P. Greenhaff, S. Vanapalli and N.
610
Szewczyk, Faseb Journal, 2015, 29, 1235-1246.
611
27. R. Edwards, A. Young, G. Hosking and D. Jones, Clinical Science and Molecular Medicine,
612
1977, 52, 283-290.
613
28. R. Sahaly, H. Vandewalle, T. Driss and H. Monod, European Journal of Applied
614
Physiology, 2001, 85, 345-350.
615
29. O. Madsen, European Journal of Applied Physiology and Occupational Physiology, 1996,
616
74, 206-210.
617
30. B. Richens and D. Cleather, Biology of Sport, 2014, 31, 157-161.
618
31. S. Brenner, Genetics, 1973, 77, 71 - 94.
619
32. J. C. McDonald, D. C. Duffy, J. R. Anderson, D. T. Chiu, H. Wu, O. J. A. Schueller and G. M.
620
Whitesides, Electrophoresis, 2000, 21, 27-40.
621
33. B. Xian, J. Shen, W. Chen, N. Sun, N. Qiao, D. Jiang, T. Yu, Y. Men, Z. Han, Y. Pang, M.
622
Kaeberlein, Y. Huang and J. Han, Aging Cell, 2013, 12, 398-409.
34. S. Timoshenko and J. M. Gere, Mechanics of Materials, Van Nostrand Reinhold Co., New
624
York, New York, 1972.
625
35. S. Lockery, K. Lawton, J. Doll, S. Faumont, S. Coulthard, T. Thiele, N. Chronis, K.
626
McCormick, M. Goodman and B. Pruitt, Journal of Neurophysiology, 2008, 99,
3136-627
3143.
628
36. S. Park, H. Hwang, S. Nam, F. Martinez, R. Austin and W. Ryu, Plos One, 2008, 3.
629
37. D. Albrecht and C. Bargmann, Nature Methods, 2011, 8, 599–605.
630
38. T. Majmudar, E. Keaveny, J. Zhang and M. Shelley, Journal of the Royal Society Interface,
631
2012, 9, 1809-1823.
632
39. J. B. Rand, in Acetylcholine (January 30, 2007), WormBook, ed. The C. elegans Research
633
Community, WormBook, doi/10.1895/wormbook. 1.131.1, http://www.wormbook.org,
634
DOI: doi/10.1895/wormbook.
635
40. T. M. Rogalski, B. D. Williams, G. P. Mullen and D. G. Moerman, Genes & Development,
636
1993, 7, 1471-1484.
637
41. T. Rogalski, G. Mullen, M. Gilbert, B. Williams and D. Moerman, Journal of Cell Biology,
638
2000, 150, 253-264.
639
42. A. Alfonso, K. Grundahl, J. Duerr, H. Han and J. Rand, Science, 1993, 261, 617-619.
640
43. W. B. Zhang, D. B. Sinha, W. E. Pittman, E. Hvatum, N. Stroustrup and Z. Pincus, Cell
641
Systems, 2016, 3, 333-345.
642
44. S. D. Buckingham and D. B. Sattelle, Invertebrate Neuroscience 2008, 8, 121-131.
643
45. J. Sznitman, X. Shen, R. Sznitman and P. Arratia, Physics of Fluids, 2010, 22.
644
46. J. Yuan, H. Ko, D. Raizen and H. Bau, Journal of the Royal Society Interface, 2016, 13.
645
47. Y. Rabets, M. Backholm, K. Dalnoki-Veress and W. Ryu, Biophysical Journal, 2014, 107,
646
1980-1987.
647
48. A. San-Miguel and H. Lu, in Microfluidics as a tool for C. elegans research. (September
648
24, 2013), WormBook , ed. The C. elegans Research Community, WormBook,
649
doi/10.1895/wormbook.1.162.1, http://www.wormbook.org .
650
49. V. Butler, R. Branicky, E. Yemini, J. Liewald, A. Gottschalk, R. Kerr, D. Chklovskii and W.
651
Schafer, Journal of the Royal Society Interface, 2015, 12.
652
Figures and Tables 654
655
656 657
Figure 1: Muscle strength measurement in humans and the NemaFlex system for force 658
measurement in C. elegans. (a) Human muscle function is measured in terms of maximum
659
voluntary force (MVF) during a standardized knee extensor test, where the peak force exerted
660
by the quadriceps muscle is recorded using a force sensor. An equivalent measure of maximum
661
exertable force in C. elegans is currently unavailable. (b) Image of the NemaFlex device filled
662
with green food dye for highlighting the arena and the ports. Scale bar, 1 cm. (c) Schematic
663
showing the C. elegans strength measurement apparatus including the chamber for housing
664
worms, deformable pillar arrays, microscope objective for visualizing pillar deflection, and
665
crawling nematode. Scanning electron microscope (SEM) picture of the pillars (inset). Scale bar,
666
100 µm. (d) Schematic showing interaction with a pillar by the worm body (exaggerated view).
667
The pillar is deflected due to the action of the body wall muscles (shown in red and green).
668
Parameters defined in Eqn. (1) are shown with actual values being a = 38.3 ± 0.4, h = 71.8 ± 2.9,
669
c = 27.6 ± 2.9 and D = 50 -70 µm (for WT, age = 60 – 84 hrs). 670
675
Figure 2. Illustration of the steps in image processing to quantify pillar displacements. (a)
676
Original images of a crawling worm. (b) Foreground image and (c) background image from a
677
stack of images in the preprocessing step. (d) Mask generation from the foreground. (e)
678
Identification of all pillars by applying circular Hough transform. (f) Identification of the
679
candidate pillar for tracking using the mask. (g) Grid verification and validation of pillar location.
680
(h) A candidate pillar selected from a frame (see red arrows) for illustration of deflection
681
measurement. (i) Determination of pillar base location and radius when the worm is not
682
touching the pillar. (j) Measurement of pillar displacement.
683
684
Figure 3. Estimation of error in force measurement. False positive force detections in the
685
system were determined by tracking a single undeflected pillar from twenty movies of
wild-686
type worms (age = 60 hrs). The error distribution has a mean at 0.9 µN, a standard deviation of
687
0.8 µN, and an f95 value of 2.2 µN. Inset compares error distribution relative to the strength of
688
the population. The f95 value of the error distribution is less than 10% of the f95 value for the
689
worm population. There is also zero overlap between the two force distributions, allowing clear
690
distinction between true forces and errors.
691
692 693 694 695 696 697 698 699 700 701 702 703 704 705 706
[image:23.612.209.397.67.537.2]
707
Figure 4: Data analysis workflow for NemaFlex strength measurement. (a) Stack of images
708
showing the worm interacting with different pillars during a locomotory episode. The deflected
709
pillars are circled in blue, and the red circle denotes the pillar that experiences the maximum
710
force. Scale bar, 200 µm. (b) Variation of maximal force over time due to a worm interacting
711
with pillars (in red). The black curve shows force variation from the pillars that are not in
712
contact with the worm – giving an estimate of error in our force measurement. (c) Cumulative
713
probability distribution curves of maximal forces for different worms (age = 60 hrs) showing the
714
variability between individuals (n = 14). The red trace represents the cumulative force
715
distribution curve for the population. (d) From the cumulative force distribution curve, the
716
718 719
Figure 5. Resistance to locomotion determines maximal forces. (a) A composite micropillar
720
arena containing sections A1, A2, and A3 with different pillar spacings to investigate the
721
influence of animal confinement on force generation. Scale bar, 5 mm. (b) The same nematode
722
shown in the three different arenas. The level of confinement (D/s) increases as the worm
723
crawls from arena A1 to A3. Scale bar, 100 µm. The force-velocity data for animals in (c) A1, (d)
724
A2, and (e) A3 arenas. The lines indicate force-velocity cut-offs of 80 µN and 600 µm/s. The data
725
correspond to 17 WT individuals of age 84 hours.
740
741
[image:25.612.161.456.98.340.2]742
Figure 6. Behavioral phenotyping of C. elegans in pillar arenas with different confinements. 743
The frequency of reversals and turns is higher under tighter confinement due to strong
744
mechanical resistance of the pillar environment. The data correspond to 17 WT individuals of
745
age 84 hours.
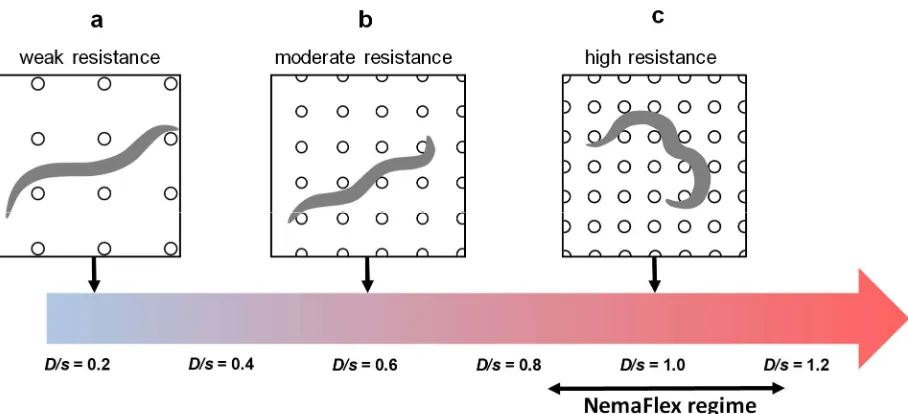
761
Figure 7. Schematic illustrating the effect of animal confinement on mechanical resistance 762
and force generation in pillar environments. The nematode experiences increasing
763
confinement (D/s) from left to right due to increasing density of pillars. (a) Weak resistance, D/s
764
= 0.2, (b) moderate resistance, D/s = 0.6, and (c) strong resistance, D/s = 1.0. Large forces are
765
expected under strong confinement due to enhanced mechanical resistance and constrained
766
body shapes. The operating confinement regime of our NemaFlex system is highlighted.
767 768 769 770 771 772 773 774 775 776 777 778 779 780 781
782
787
[image:27.612.97.482.75.620.2]788
Figure 8. Highly resistive pillar arenas produce consistent maximum exertable force. A
789
comparison between maximum exertable force f95 measured for WT individuals in (a) section 790
A2 and section A3 (n = 14, slope = 1.01 ± 0.05, r2 = 0.65) and (b) in section A1 and section A3
791
(n=13, slope = 0.46 ± 0.07, r2 = -0.55). A similar comparison is shown for unc-112 animals (n=13
792
WT (84 hrs) WT (84 hrs)
unc-112(84 hrs) unc-112(84 hrs)
a b
c d
lon-2(84 hrs) lon-2(84 hrs)
individuals) in (c) A2 and A3 (n = 12, slope 0.99 ± 0.04, r2 = 0.67) and (d) A1 and A3 (n= 10, slope
793
= 0.81 ± 0.07, r2 = -0.25). Comparison for lon-2 animals (n=10 individuals) in (e) A2 and A3 (n=9,
794
slope=0.98± 0.05, r2 = 0.72) and (f) A1 and A3 (n= 8, slope = 0.75 ± 0.07, r2 = 0.67). The red line
795
is the best-fit curve to the data, and the dashed black line has a slope of unity and passes
796
through origin. The blue lines demarcate the 95% confidence interval region.
797 798 799 800 801 802 803 804 805
807
[image:29.612.171.435.80.498.2]808
Figure 9. NemaFlex quantitates maximum exertable force independent of C. elegans gait. (a)
809
Images showing the different gaits exhibited by crawlingWT C. elegans in the pillar arena of the
810
NemaFlex device. The arrows show direction of the animal motion. (b) The cumulative force
811
distribution for the different gaits shown in (a). The horizontal dashed line indicates 95%
812
probability, and the vertical bar highlights that the f95 values for each gait are very similar. 813
Animal age = 60 hrs and D/s = 0.87 – 0.98.
820
[image:30.612.186.382.71.451.2]821
Figure 10. Maximum exertable force is independent of C. elegans behavior in the NemaFlex 822
pillar arena. (a) MEF of WT individuals obtained from analyzing contiguous frames of 30-second
823
duration with a randomly sampled starting point in the movie (movie length is 85 – 120
824
seconds). Data is shown as mean ± SD from N = 5 sampling trials. 17 individuals showed SD <
825
10%, while three showed SD between 10 - 16%. (b) MEF values obtained from non-repeating
826
randomly sampled discrete frames. The movie sets are the same as in (a). Data is shown as
827
mean ± SD from N = 5 trials. In this case all 20 individuals showed SD < 10%. (c) MEF of
828
individuals evaluated at three time points: 0, 2, and 2.5 hours. Here a 2-minute episode was
829
captured for each worm and a contiguous 30-second episode was analyzed to obtain MEF.
830
Animal age = 60 hrs and D/s = 0.85 – 0.95.
[image:31.612.193.379.68.617.2]
834 835
Figure 11. NemaFlex quantitates maximum muscular strength in C. elegans. (a) A brief
836
protocol for imaging and inducing muscle contraction on individual wild-type C. elegans with 1
837
mM levamisole. A 60-second episode is captured for each animal before levamisole treatment,
838
and capturing continues for 60 to 200 seconds after the induction. (b) Levamisole
treatment-839