R E S E A R C H A R T I C L E
Open Access
Comparative transcriptomics and
proteomics of three different aphid species
identifies core and diverse effector sets
Peter Thorpe
1,3, Peter J. A. Cock
2,3and Jorunn Bos
1,3,4*Abstract
Background:Aphids are phloem-feeding insects that cause significant economic losses to agriculture worldwide. While feeding and probing these insects deliver molecules, called effectors, inside their host to enable infestation. The identification and characterization of these effectors from different species that vary in their host range is an important step in understanding the infestation success of aphids and aphid host range variation. This study employs a multi-disciplinary approach based on transcriptome sequencing and proteomics to identify and compare effector candidates from the broad host range aphidMyzus persicae(green peach aphid) (genotypes O, J and F), and narrow host range aphidsMyzus cerasi(black cherry aphid) andRhopalosiphum padi(bird-cherry oat aphid). Results:Using a combination of aphid transcriptome sequencing on libraries derived from head versus body tissues as well as saliva proteomics we were able to predict candidate effectors repertoires from the different aphid species and genotypes. Among the identified conserved or core effector sets, we identified a significant number of previously identified aphid candidate effectors indicating these proteins may be involved in general infestation strategies. Moreover, we identified aphid candidate effector sequences that were specific to one species, which are interesting candidates for further validation and characterization with regards to species-specific functions during infestation. We assessed our candidate effector repertoires for evidence of positive selection, and identified 49 candidates with DN/DS ratios >1. We noted higher rates of DN/DS ratios in predicted aphid effectors than non-effectors. Whether this reflects positive selection due to co-evolution with host plants, or increased neofunctionalization upon gene
duplication remains to be investigated.
Conclusion:Our work provides a comprehensive overview of the candidate effector repertoires from three different aphid species with varying host ranges. Comparative analyses revealed candidate effectors that are most likely are involved in general aspects of infestation, whereas others, that are highly divergent, may be involved in specific processes important for certain aphid species. Insights into the overlap and differences in aphid effector repertoires are important in understanding how different species successfully infest different ranges of plant species.
Keywords:Aphid, Effector, Host-range, RNA-seq, Proteomics
Background
Aphids are phloem-feeding insects that cause substantial damage to agriculture worldwide due to feeding-related damage and the transmission of economically important plant viruses [1]. Effective control of aphids in field
crops currently relies heavily on the use of insecticides. However, aphids have been shown to develop resistance to many of the different types of available insecticides [2–4]. In addition, there are an increasing number of restrictions in place on the use of insecticides under EU legislation due to their environmental impact [5]. There-fore, there is a pressing need to develop novel aphid control strategies, which requires a better understanding of the molecular basis of plant-aphid interactions.
Among the over 4000 aphid species, around 10 % are considered pests of economically important plants and * Correspondence:[email protected]
1
Cell and Molecular Sciences, The James Hutton Institute, Invergowrie, Dundee DD2 5DA, UK
3Dundee Effector Consortium, The James Hutton Institute, Invergowrie,
Dundee DD2 5DA, UK
Full list of author information is available at the end of the article
trees [6]. While most aphid species are highly specialized and can only infest plants in a single taxonomic family or several related plant species, some aphid species have an exceptionally broad host range and are able to infest plants in many families [1]. The latter group of aphid species includes some major pests, like Myzus persicae
(green peach aphid), which infests plants in over 40 fam-ilies, including crops like potato and oil seed rape [1]. In contrast, a close relative of M. persicae, M. cerasi(black cherry aphid), is only able to infest cherry and a few herbaceous plants. Also, some aphids, like Rhopalosi-phum padi(bird cherry-oat aphid), mainly infest cereals. Interestingly, we previously showed that aphid species
M. persicae, M. cerasiand R. padiexhibited probing be-haviour on Arabidopsis thalianaduring host, poor-host as well as nonhost interactions [7]. This implies that during these different types of interactions there is an opportunity for molecular interactions to take place. Moreover, we found thatArabidopsistranscriptional re-sponses to these three aphid species showed a high level of overlap, suggesting that also aphid responses likely play a key role during the different types of interactions. Although the molecular mechanisms underlying aphid host range differences remain elusive, it is likely both plant and aphid molecules are involved [8].
For a plant pathogen or pest to be successful on a host, it is important to manipulate host cell processes to promote virulence. This generally involves the secretion of molecules, termed effectors, inside the host, which target host molecules [9]. A number of recent studies have now shown that insects, including aphids, produce and secrete effectors that suppress or induce plant de-fence responses [10–13]. These aphid effectors are thought to be produced predominantly in the salivary glands and secreted within aphid saliva during probing and feeding [14–19]. The recent availability of aphid genome and transcriptome sequence data has facilitated the development of approaches to identify aphid candi-date effectors [10, 11, 20–22]. More specifically, bio-informatic pipelines to identify putative secreted proteins have been developed e.g. [23] and applied to several aphid species [10, 11–20]. In addition, saliva col-lection methods based on artificial diet-feeding systems in combination with mass spectrometry have allowed the identification of proteins present in saliva of several aphid species [10, 21, 24]. These efforts have generated lists of candidate effector proteins for a number of spe-cies and led to the functional characterization of several candidates in plant-aphid interactions.
We were interested to gain a comprehensive insight into the diversity of aphid effector repertoires of species with varying host ranges. Therefore, we employed a combined transcriptomic and saliva proteomic approach to identify and compare the effector repertoires from
three different aphid species, M. persicae, M. cerasiand
R. padi. ForM. persicae, we included three different ge-notypes to also assess variation within this species. These were genotype O, which is currently most preva-lent in the UK, genotype J which was prevapreva-lent in the UK around 1970 but is currently only found occasion-ally, and genotype F, which was prevalent in 1995 but is not currently found (Brian Fenton, personal communica-tion, 2015). These genotypes show differences in growth rates on different host species, with genotype F showing a significantly slower growth on all host species com-pared to other genotypes [25].
We found a large number of predicted secreted aphid proteins to be highly conserved among the different aphid species, which we propose reflects the potential aphid core effector repertoire. Many proteins within this repertoire were predicted to be of unknown function and specific to aphids. Therefore, these proteins may ex-hibit highly conserved functions important in establish-ing plant-aphid interactions. In addition, we identified sets of effectors that were highly divergent among the different aphid species and/or genotypes, as well effec-tors potentially specific to one of the aphid species. Some of these effectors showed evidence of positive selection. We propose that such effectors are strong can-didates for contributing to aphid species-specific infest-ation strategies.
Results and discussion
De novo RNA-seq data assembly
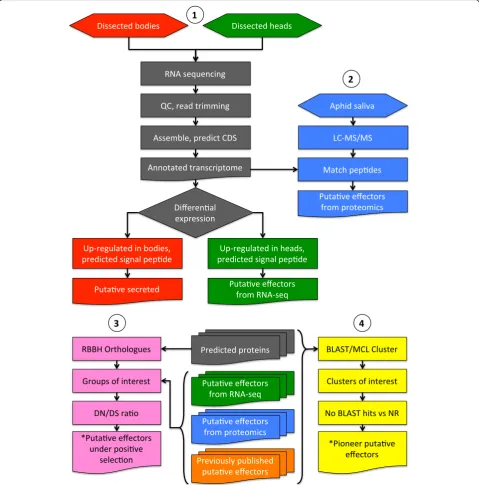
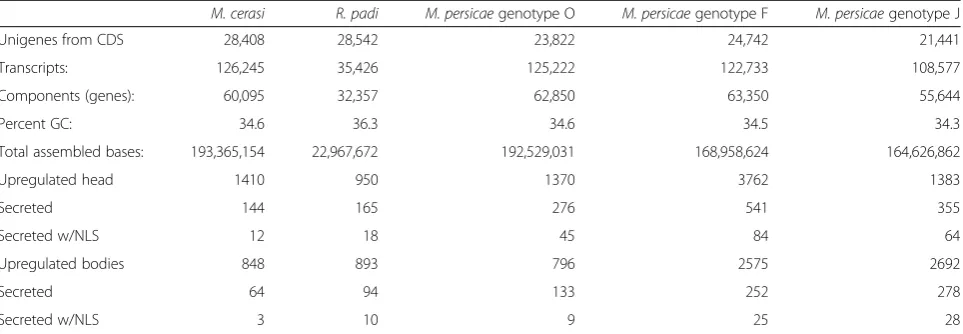
To define the effector repertoires from aphid speciesM. persicae (genotypes O, J and F), M. cerasi and R. padi, we sequenced libraries generated using RNA extracted from both body and head tissues. Quality control andde novoassembly was performed for each species and geno-type. We performed differential gene expression analyses by mapping reads for each biological replicate dataset back to the assemblies and then generated normalised digital gene expression (TMM-FPKM) (Fig. 1). Details on the numbers of assembled contigs, reads, predicted coding sequences (CDS) and differentially expressed genes are summarised in Table 1.
Fig. 1Diagrammatic representation of the experimental procedure used to identify putative effectors fromMyzus persicaegenotype O, J and F,
[image:3.595.58.538.89.575.2]elaeasa, and 29 sequences were bacterial, including 2 se-quences from the aphid endosymbiont Buchnera. The number of transcripts assembled for R. padi was sub-stantially less than that of the other assemblies, likely due to the lower number of reads generated for this spe-cies. For M. cerasi we identified 28,408 unigene CDS, with 76 % showing BLAST hits toA. pisum. TheM. cer-asiCDS set included 18 viral sequences, and 183 bacter-ial sequences of which 120 were Buchnera-derived. For the M. persicae genotypes the numbers of CDS ranged from 21,441 to 24,742, with around 90 % showing BLAST hits againstA. pisum. The number of sequences with similarity to insect viruses ranged from 8 to 11, and the number of bacterial sequences ranged from 114 to 228, with 73 to 164 being derived from Buchnera. We also identified a number of transcripts that showed BLAST hits to plant genes (114 for R. padi, 56 for M. cerasi, 43 for M. persicaegenotype J, 24 for M. persicae
genotype F, and 27 for M. persicae genotype O). How-ever, it is unclear whether these transcripts are incor-rectly annotated in the database or whether they are indeed present in insect tissue. We also found a number of secondary BLAST hits against Clostridium sordellii
sequences from one particular dataset (ATCC 9714) [27], which included hits for some well characterized aphid effectors, such as MpC002 and Me10. However, additional BLAST searches showed that these aphid effectors do not show any hits against other bacterial databases, including other Clostridium datasets. Also effectors like C002 contain introns and are confirmed to be aphid derived using various independent approaches, including proteomics and genomics [17, 20–22]. The relatively high number of matches to a specificC. sordel-liidatabase is therefore unlikely due to contamination of our samples.
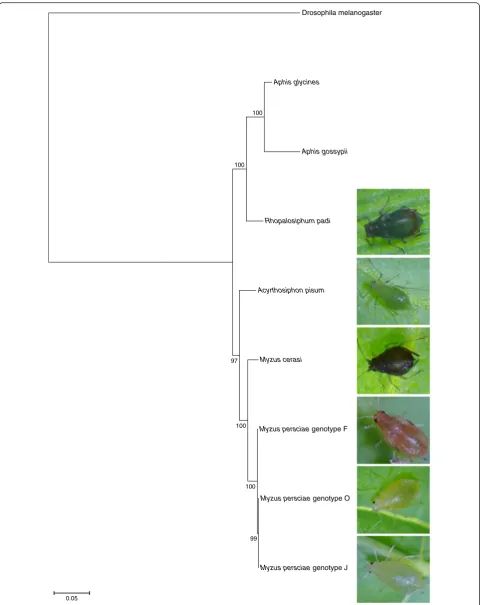
We used ourde novotranscriptome datasets as well as the A. pisum genome sequence, and the publicly
available transcriptome datasets for Aphis glycines (soy-bean aphid) [28] and A. gossypii(melon aphid) [29], for phylogenetic analyses to assess the relationships of the different aphid species used in this study. We selected a set of single copy orthologous genes described by Misof et al. [29] for reciprocal best BLAST hit and phylogen-etic analyses (Additional file 1). As expected the two different Myzus species were more closely related to each other than to the other species in the phylogenetic tree (Fig. 2). Also, the three M. persicaegenotypes clus-tered together, with genotype O being phylogenetically closer to genotype J than genotype F (Fig. 2).
In addition, we looked at the predicted functions of the most abundant transcripts for each aphid species and genotype. Annotation of the 100 most abundant transcripts in the (combined head and body) transcrip-tome datasets revealed a high level of similarity across the species/genotypes (Additional file 2). For example ribosomal proteins, cuticle proteins, ATP synthases, elongation factor 1-alpha, myosin light chain protein, putative sheath protein, chemosensory proteins, and heat shock-associated proteins were present in the 100 most abundant transcripts for all species. Interestingly, we identified transcripts with sequence similarity to several previously identified putative aphid effectors among the 100 most abundant transcripts. For most aphid species/ genotypes we identified transcript sequences with simi-larity to effector Me10 from Macrosiphum euphorbiae
(potato aphid), which has previously been shown to pro-mote aphid virulence [10]. Moreover, we also identified several transcripts in the various datasets with similarity to candidate effectors, including Mp10 (M. cerasi, M. persicaegenotype O and F), Mp12 (M. persicaegenotype F and O), Mp17 (M. persicaegenotype O), Mp23 (M. persicae
[image:4.595.58.540.110.277.2]genotype O, F and J), Mp44 (M. persicaegenotype F), and MpC002 (M. cerasi) [22]. The high level of overlap in predicted functions of the most abundant transcripts for Table 1Statistics, number of differentially expressed transcript and predicted effectors for thede novoRNA-seq assemblies generated in this project forMyzus persicaegenotype O, J and F,M. cerasiandRhopalosiphum padi
M. cerasi R. padi M. persicaegenotype O M. persicaegenotype F M. persicaegenotype J
Unigenes from CDS 28,408 28,542 23,822 24,742 21,441
Transcripts: 126,245 35,426 125,222 122,733 108,577
Components (genes): 60,095 32,357 62,850 63,350 55,644
Percent GC: 34.6 36.3 34.6 34.5 34.3
Total assembled bases: 193,365,154 22,967,672 192,529,031 168,958,624 164,626,862
Upregulated head 1410 950 1370 3762 1383
Secreted 144 165 276 541 355
Secreted w/NLS 12 18 45 84 64
Upregulated bodies 848 893 796 2575 2692
Secreted 64 94 133 252 278
Drosophila melanogaster
Aphis glycines
Aphis gossypii
Rhopalosiphum padi
Acyrthosiphon pisum
Myzus cerasi
Myzus persciae genotype F
Myzus persciae genotype O
Myzus persciae genotype J 100
100
97
100
100
99
0.05
[image:5.595.58.541.86.692.2]the different aphid species reflects their importance to aphid biology. Although we identified transcripts with similarity to several known putative effectors for theMyzus
species, we only identified one previously predicted effector sequence (similar to Me10) in theR. paditop 100 transcript set. It is possible this aphid species utilizes a different effec-tors repertoire thanMyzusspecies during plant infestation.
Prediction of putative effector repertoires from different aphid species
Effectors are thought to be expressed and synthesised in the salivary glands, which are located in the aphid head [17]. Aphid species vary in size and therefore dissection of salivary gland tissues to use for transcriptome analyses is challenging and not always feasible. To be able to identify transcripts encoding putative effectors for the different aphid species, which are most likely expressed in the salivary glands, we compared datasets generated from aphid head versus body tissues and looked for tran-scripts that were up-regulated in head tissue.
First, we identified transcripts up-regulated in head versus body tissues and vice versa for each species (Table 1). Then, we applied a bioinformatics pipeline to these transcript sets to identify transcripts up-regulated in aphid heads that are predicted to encode secreted proteins. This identified 144 transcripts for M. cerasi, 165 forR. padi, 276 forM. persicae genotype O, 541 for
M. persicae genotype F, and 355 for M. persicae geno-type J (Table 1; Additional file 3). In addition we pre-dicted the presence of nuclear localization signals (NLS), which identified 12 to 84 predicted secreted proteins with a predicted nuclear localization (Table 1). Interest-ingly, these results show variation in numbers of predicted effectors within M. persicae. For example, for genotype F we nearly predicted twice the number of effectors as compared to genotype O despite similar numbers of total CDS. Whether these differences are due to the quality of the assembly or reflect any bio-logical relevance remains to be investigated.
In parallel, we examined the gene expression profiles of a set of genes commonly used for normalisation of qPCR data and thought to be constitutively expressed [30, 31]. Sequences annotated as elongation factor 1 alpha, actin, succinate dehydrogenase and CDC42 (cell division control protein) were selected for assessment of their expression profiles. Of the 128 aphid gene se-quences we identified using sequence similarity searches to these select genes, only 4 were found to be differen-tially expressed (Additional file 4). One was an actin transcript, and the other three were succinate dehydro-genase transcripts. However, two out of the three differ-entially expressed succinate dehydrogenase genes were only expressed, to low levels, in one of the aphid sam-ples (M. persicaegenotype F - head) with no expression
in the other samples, thus leading to differential expres-sion (Additional file 4). Some actin genes could be af-fected in their expression by differences in aphid growth. Similarly, actin was highly expressed in J2 nematodes versus those in other life stages in the case ofGlobodera pallida[32]. Despite this, 124 of the 128 transcripts did not show any differential gene expression within our dataset indicating that these genes are not regulated similarly to those in our candidate effector sets.
Previous studies have identified salivary proteins in aphids using proteomics and/or bioinformatics ap-proaches [10, 11, 20, 21, 33]. We compared the pre-dicted aphid effectors identified by Bos et al. [11], Atamian et al. [10], and Carolan et al. [20] to the datasets we generated in this study and found similar sequences for many of the previously identified candi-date effectors (Additional file 3). For example, we identified sequences similar to previously identified effectors C002 [17] and Me10 [10], to the candidate effectors identified by Bos et al. [22] and to 276 candi-date effectors described by Carolan et al. [20] based on a BLASTP cut-off of 1e-10 (Additional file 3).
GO annotations were assigned and GO enrichment analyses revealed an over-representation in the predicted effector repertoires of all species of the functional categories“structural molecule activity”and“constituent of cuticle and extracellular region” (Additional files 5 and 6). However, many putative effectors identified to date from different pathosystems have no known GO domains [34]. Therefore these GO-term data may not reflect the biological function of a large number of aphid predicted effectors.
We then looked at BLAST similarity searches of our predicted effector repertoires to look at putative functions (Additional file 3). Interestingly, we identified two predicted aphid effectors from M. persicae with similarity to a pea aphid E3 ubiquitin ligase [GenBank: XP_001945627.1]. These enzymes are important components of the ubiquitin-proteasome pathway. The ubiquitin-ubiquitin-proteasome pathway is implicated in a wide range of plant-pathogen interactions and it is possible that aphids exploit this pathway in order to manipulate host responses [35, 36].
Also, we identified putative effectors with potential roles in detoxification and digestion (Additional file 3). It has been suggested that aphids secrete cellulase en-zymes in order to minimise the mechanical damage caused during stylet movement [15]. We did not find cellulase enzymes or any other glycosyl hydrolase (GH) domain containing protein involved in cell wall degrad-ation in our predicted effector repertoires. However, when interrogating the whole transcriptome, rather than the effector repertoire sets, we found 10 transcripts corresponding to GH5 domain cellulases (M. persicae
secreted proteins. However, these transcripts were simi-larly expressed in body and head tissues. It is possible that some effectors may be produced in other tissues than the salivary glands and are then transported to the salivary duct and secreted into saliva. Therefore, our selection of candidate effectors based on high expres-sion levels in head versus body tissues may have missed some potential effectors of interest. Moreover, secreted enzymes in the aphid digestive tract are likely involved in the detoxification and degradation of plant compounds [37, 38].
Carolan et al. [20] previously identified some similarity between nematode effectors and predicted pea aphid ef-fectors based on functional annotations. We assessed our datasets for such similarity and identified sequences with predicted functions similar to those of several root knot nematode effectors (i.e. m1 zinc metalloprotease, calreticulin and glutathione peroxidase) (Additional file 3). In addition, we compared amino acid sequences within our candidate effector sets to the predicted ef-fector repertoire of the cyst nematodeGlobodera pallida
[34]. We only foundM. persicaesequences with similar-ity to three proteins, which are potentially part of a family [GeneDB/WormBase: GPLIN_001205000, GPL IN_000990400, GPLIN_000574800] and are predicted to encode a gland cell secretory protein 3, which contains a thioredoxin-like domain, and shows similarity to a protein with a kinase domain [GeneDB/WormBase: GPLIN_000510600] (BLASTP e-value p< 1e-21). Over-all, there is very little, if no, convergent evolution be-tween the effectors repertoires of the aphid species used in this study and those of plant pathogenic nematodes.
We also compared our findings to transcriptome stud-ies aimed at identifying salivary gland genes from other sap-sucking insects within the order Hempitera, such as the potato leafhopper Empoasca fabae[39], the whitefly
Bemisia tabaci [40], and the brown planthopper
Nilaparvata lugens [41]. Genes with functions predicted to be involved in plant-hemipteran interactions, that may have similar roles to those identified in this study, include peroxidases [42], sucrase [43], peptidase, lipase [39, 44], phosphatase [45], glucose dehydrogenase [45] and a number of hypothetical pea aphid proteins. Previ-ously it has been shown that some predicted secretory salivary proteins from the whitefly show similarity to putative pea aphid effectors [40]. For example, predicted whitefly effectors showed similarity to an GMC oxire-ductase, glucose dehydrogenase, Mp12, Mp43, Mp11, Mp43, Mp46, sucrase, and M1 zinc metalloprotease [40]. Moreover, comparative analyses between a planthopper salivary gland transcriptome and the pea aphid identified number of similar sequences which may function in insect-plant interactions such as a glucose dehydrogen-ase, peroxidase-like, vitellogenin-6-like, serine protease
snake-like isoform 1 carboxypeptidase, and digestive enzymes [41]. This shows that these insects may use some common proteins in order to successfully infest their hosts. However, a large number of aphid putative effectors identified here are aphid specific, consistent with previous research [20], indicating aphid specific evolution.
Prediction of putative effectors using saliva proteomics
Complementary to our transcriptomics approach we performed aphid saliva proteomics for the three aphid species/genotypes in our study to identify candidate effectors. We collected saliva using an artificial feeding system [21, 22] and subjected samples to LC-MS/MS analyses. MASCOT software searches for peptide identi-fication were run against the de novo assemblies gener-ated in this project (Fig. 1). In total we identified 56 proteins in the saliva ofR. padi, 19 proteins in the saliva of M. cerasi, and 40, 42 and 47 proteins in saliva ofM. persicae genotypes F, O and J, respectively (Additional file 7). The differences in protein numbers could reflect that these aphid species produce variable amounts of saliva when exposed to artificial feeding system or that they secrete effector repertoires with different complexities.
Also, we also performed MASCOT searches using the NCBI NR database, which led to a relatively small num-ber of proteins being identified when compared using thede novoassemblies (Additional file 7). More specific-ally, we only identified 10 proteins for R. padi, 2 forM. cerasi, 6 for M. persicaegenotype F, 15 for M. persicae
genotype O, and 12 for M. persicae genotype J. This highlights the importance of generating de novo tran-scriptomes for different species in applying a proteomics approach for protein identification.
Another reason for the lack of overlap could be miss-ing 5′-sequences in our transcriptome dataset required for prediction of signal peptide sequences. We per-formed an overall assessment of the de novoassemblies for full-length transcripts using TransDecoder. Out of 28,542R. padipredicted transcripts only 4590 were pre-dicted to be complete (16 %), 14,505 were internal (50 %), 6306 were 5′-partial (22 %), and 2241 were 3′-partial (7.6 %). Similar numbers were obtained for the other aphid species and genotypes. In addition, we assessed whether full-length transcript sequences were available for the 204 proteins identified by proteomics within thede novoassemblies generated for each species. For the 56R. padiproteins identified by proteomics, we only found full-length transcript data for 8 proteins, which limited our ability to predict signal peptide se-quences. Twelve out of the 56 proteins were predicted to contain a signal peptide, with 4 of these containing transmembrane domains. ForM. cerasi, full-length tran-scripts were available for 12 out of 19 proteins identified by proteomics. Ten proteins contained signal peptide se-quences, of which 2 contained transmembrane domains. For theM. persicae genotypes we found that full-length transcripts were available for about 50 % of the proteins identified by proteomics.
We then compared functional annotations of saliva proteins from the different aphid species. We found that a putative sheath protein [GenBank: AFT82624.1], several uncharacterized proteins [GenBank: XM_ 003246795.2, XM_003246613.2, XM_008184371.1 and XM_003242933.2], and a peroxidase-like [GenBank: XP_003247027.1], were secreted by all aphid species. Whereas uncharacterized protein [GenBank: XM_ 008184371.1] and trehalase-like isoform X1 [GenBank: XP_003245895.1] were found in saliva from all Myzus
species, including all genotypes. Glutathione S-transferase [GenBank: XP_001942714.1] and uncharac-terized protein [GenBank: NM_001162275.2] were identified only in saliva from the different M. persicae
genotypes. Twenty-two proteins were found only in saliva from R. padi such as C002, nine hypothetical/ unknown proteins, carbonic anhydrase and proteins with proteolytic activity such as aminopeptidase and cathepsin B-348 (Additional file 7). It is possible that this aphid secretes different effectors into the artificial diet, but we cannot rule out that observed differences are due to differences in saliva amounts secreted and quality of the RNA-seq datasets used for identification of peptides.
Although, we cannot draw conclusions regarding the presence or absence of certain proteins in saliva of spe-cific species due to the lack of biological and technical replication in our experimental set-up, our data does support a model wherein different aphids secrete a core
or common effector set inside their host to manipulate host processes. Within the common set of secreted saliva proteins, those predicted to encode enzymes may be involved in detoxification of chemical defences com-pounds induced during early plant defence responses to reduce harmful levels of reactive oxygen species [9]. Detoxification of plant defence responses may be a common strategy employed by aphids and identifying and characterizing any common/core proteins involved in this could provide novel broad range targets for aphid control strategies.
Cluster analysis to identify core effector sets
One of our key interests in this study was to compare the predicted aphid effector repertoires to identify com-mon or core sets of candidate effectors as well as those potentially unique to specific species and/or genotypes, or highly divergent across species. To do this, we used the transcriptome and proteomics datasets for R. padi,
M. cerasi, and M. persicae generated here in combin-ation with publicly available sequence data sets for A. pisum[26], A. glycines [28], as well as the fruit fly Dros-ophila melanogaster[46], for cluster analyses. The tran-scriptome ofA. glycineswas re-assembled for our study.
To perform cluster analysis based on sequence similar-ity, a database of all amino acid sequences from all spe-cies listed above was generated, including several previously published candidate effector sets [11, 12, 20]. This amino acid database was subjected to a self-BLASTP (evalue 1e-35) similarity search followed by cluster analyses using MCL (Fig. 1). Clusters containing any of the candidate effectors identified by our tran-scriptomics or proteomics approach or previously re-ported [11, 12, 20] were defined as candidate effector containing-clusters. We identified 444 candidate effector containing-clusters represented by 6652 sequences out of the total 43,256 clusters represented by 216,403 se-quences. Within the candidate effector containing-clusters we looked for those that were represented by 5 of the 8 aphid datasets, and defined these as core effec-tors (Additional file 9). This identified 199 core putative effector clusters containing 4811 sequences (Additional file 10). Similarity searches revealed that these core putative effectors showed high similarity to proteins with a range of different functions, such as a glucose de-hydrogenase, sheath protein, apolipophorin precursor as well as previously reported aphid candidate effectors of unknown function (Additional file 9).
significant number of previously identified candidate ef-fectors. These include M. persicaeeffector Mp10, which triggers a range of plant defences and reduces aphid virulence when over-expressedin planta[47]. Two clus-ters contained effectors with known virulence activity, MpC002 and Me10. C002 is one of the best-characterized aphid effectors and the M. persicae form of C002, called MpC002, contributes to aphid virulence as shown by a combination of in planta overexpression and RNAi experiments [11, 13]. In addition, the M. euphorbiae effector Me10 enhances aphids virulence uponin plantaover-expression [10].
Identification of potential aphid species-specific candidate effectors
In addition to the conserved effectors, we also looked for any MCL clusters that contained candidate effector sequences with no BLAST hit against the NCBI NR database (e-value 1e-5) or Pfam A domains specific to a single aphid species or genus. These were defined as pi-oneer candidate effectors. We found 7 clusters corre-sponding to 10 sequences specific to R. padi, and 8 clusters corresponding to 11 sequences specific to M. persicae. We found 4 clusters, containing 16 sequences that were specifically represented by the twoMyzus spe-cies (Additional file 10). These pioneer candidate effec-tors were all predicted based on our transcriptomics analyses and therefore showed significantly higher expression in head samples than in body samples (p< 0.001).
To determine whether these potentially species-specific effectors are indeed species-species-specific further characterization will be required. This will address whetherM. persicae-specific effectors contribute to host range and whether the cereal pest R. padirequires spe-cific effectors to successfully infest cereals.
DN/DS analysis identifies candidate effectors under positive selection
In addition to species-specific effectors, aphids may se-crete different variants of effectors involved in host in-teractions. For example, some aphid effectors may have evolved and exhibit diversity reflecting co-evolution of specific plant and aphid species. To determine if the pu-tative effectors identified in this study were under selec-tion pressure, the ratio of the number of nonsynoymous substitutions to the number of synonymous substitutions per synonymous site (DN/DS) was calculated for recip-rocal best blast (RBBH) hit orthologous groups (Fig. 1). First, we generated a reciprocal best BLAST hit putative 1:1 orthologous group network, by performing reciprocal best blast hit analyses (BLASTP) using the different aphid transcriptome datasets (including the pea aphid predicted genes). A network was generated from the
resulting hits (Additional file 10). We calculated DN/DS ratios for each RBBH group containing a putative ef-fector and identified those that scored a DN/DS ratio >1, indicative of positive selection (Fig. 1; Table 2). Since our analysis is based on transcriptome rather than gen-ome sequencing data, we were unable to take potential gene duplication into consideration, which is known to occur within aphid genomes [26]. However, previously identified effectors such as C002, Mp1 and Me10 are single copy genes based on BLAST searches against the published pea aphid genome.
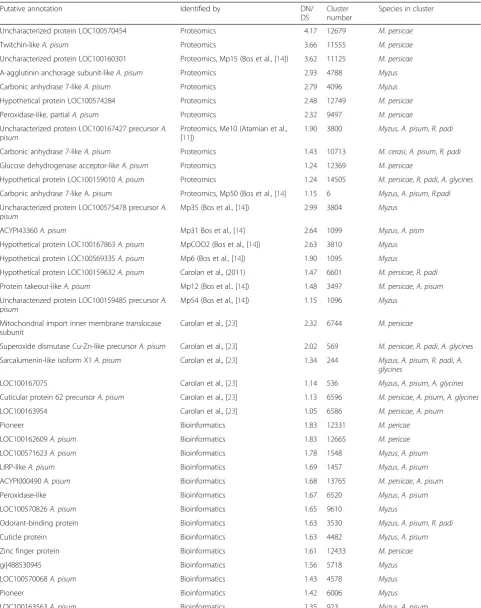
In total we identified 430 orthologous groups in our RBBH network that contained a candidate effector based on our own analyses and several published candidate ef-fector sets [11, 12, 20] out of a total of 31,361 groups. Out of these 430 groups, 49 were identified as being under positive selection (DN/DS > 1) (Table 2). In paral-lel, we selected a set of 35 sequences corresponding to genes not expected to be under positive selection based on their predicted conserved function in aphids (CDC42, EF1a, NADH-dehydrogenase, succinate de-hydrogenase, TATA-box binding protein) for similar analyses. This generated 7 groups and DN/DS ratios <0.3, showing that none of these conserved genes were under positive selection. A further 390 groups corre-sponding to predicted EOG genes (Eukaryotic Ortholo-gous Group) [29], also thought to be single copy, were subjected to DN/DS analysis. Three groups had DN/ DS > 1 (values of 1.1, 1.1 and 1.4, 2dp) which we consider false positives, and correspond to 0.8 % of the EOG set. In contrast, 11.4 % of the putative effector containing clusters were found to have DN/DS > 1.0. However, we cannot rule out that some of these clusters actually represent gene duplicates rather than orthologs of single copy genes.
Putative effector clusters were checked to see if they contained single copy genes within the pea aphid gen-ome. Of the 49 putative effector clusters under positive selection, 24 included an A. pisumsequence. To exam-ine if these 24 aphid genes are represented by a single copy in the publishedA. pisumgenome, their protein se-quences were subjected to BLASTP searches against the predicted A. pisum protein set, excluding the expected self-matches. Three out of the 24 sequences returned hits when using a 70 % identity cut off, reflecting per-haps recent gene duplication, whilst 10 returned hits when using a 30 % identity cut-off, suggesting that at least 14 sequences are likely single copy.
Table 2Reciprocal best blast hit analysis identified 1:1 orthologues between the transcriptomes. The resulting clusters, if they contained a putative effector were subjected to DN/DS analysis to identify any clusters under positive selection (DN/DS >1.0). Those identified as possibly under selection are listed in the table
Putative annotation Identified by DN/
DS
Cluster number
Species in cluster
Uncharacterized protein LOC100570454 Proteomics 4.17 12679 M. persicae
Twitchin-likeA. pisum Proteomics 3.66 11555 M. persicae
Uncharacterized protein LOC100160301 Proteomics, Mp15 (Bos et al., [14]) 3.62 11125 M. persicae
A-agglutinin anchorage subunit-likeA. pisum Proteomics 2.93 4788 Myzus
Carbonic anhydrase 7-likeA. pisum Proteomics 2.79 4096 Myzus
Hypothetical protein LOC100574284 Proteomics 2.48 12749 M. persicae
Peroxidase-like, partialA. pisum Proteomics 2.32 9497 M. persicae
Uncharacterized protein LOC100167427 precursorA. pisum
Proteomics, Me10 (Atamian et al., [11])
1.90 3800 Myzus,A. pisum,R. padi
Carbonic anhydrase 7-likeA. pisum Proteomics 1.43 10713 M. cerasi,A. pisum,R. padi
Glucose dehydrogenase acceptor-likeA. pisum Proteomics 1.24 12369 M. persicae
Hypothetical protein LOC100159010A. pisum Proteomics 1.24 14505 M. persicae,R. padi,A. glycines
Carbonic anhydrase 7-like A. pisum Proteomics, Mp50 (Bos et al., [14] 1.15 6 Myzus,A. pisum,R.padi
Uncharacterized protein LOC100575478 precursorA. pisum
Mp35 (Bos et al., [14]) 2.99 3804 Myzus
ACYPI43360A. pisum Mp31 Bos et al., [14] 2.64 1099 Myzus,A. pism
Hypothetical protein LOC100167863A. pisum MpCOO2 (Bos et al., [14]) 2.63 3810 Myzus
Hypothetical protein LOC100569335A. pisum Mp6 (Bos et al., [14]) 1.90 1095 Myzus
Hypothetical protein LOC100159632A. pisum Carolan et al., (2011) 1.47 6601 M. persicae,R. padi
Protein takeout-likeA. pisum Mp12 (Bos et al., [14]) 1.48 3497 M. persicae,A. pisum
Uncharacterized protein LOC100159485 precursorA. pisum
Mp54 (Bos et al., [14]) 1.15 1096 Myzus
Mitochondrial import inner membrane translocase subunit
Carolan et al., [23] 2.32 6744 M. persicae
Superoxide dismutase Cu-Zn-like precursorA. pisum Carolan et al., [23] 2.02 569 M. persicae,R. padi,A. glycines
Sarcalumenin-like isoform X1A. pisum Carolan et al., [23] 1.34 244 Myzus,A. pisum,R. padi,A. glycines
LOC100167075 Carolan et al., [23] 1.14 536 Myzus,A. pisum,A. glycines
Cuticular protein 62 precursorA. pisum Carolan et al., [23] 1.13 6596 M. persicae,A. pisum,A. glycines
LOC100163954 Carolan et al., [23] 1.05 6586 M. persicae,A. pisum
Pioneer Bioinformatics 1.83 12331 M. pericae
LOC100162609A. pisum Bioinformatics 1.83 12665 M. pericae
LOC100571623A. pisum Bioinformatics 1.78 1548 Myzus,A. pisum
LIRP-likeA. pisum Bioinformatics 1.69 1457 Myzus,A. pisum
ACYPI000490A. pisum Bioinformatics 1.68 13765 M. persicae,A. pisum
Peroxidase-like Bioinformatics 1.67 6520 Myzus,A. pisum
LOC100570826A. pisum Bioinformatics 1.65 9610 Myzus
Odorant-binding protein Bioinformatics 1.63 3530 Myzus,A. pisum,R. padi
Cuticle protein Bioinformatics 1.63 4482 Myzus,A. pisum
Zinc finger protein Bioinformatics 1.61 12433 M. persicae
gi|488530945 Bioinformatics 1.56 5718 Myzus
LOC100570068A. pisum Bioinformatics 1.43 4578 Myzus
Pioneer Bioinformatics 1.42 6006 Myzus
selection pressure shows 21 amino acid differences be-tween the genotype F and O (Additional file 11).
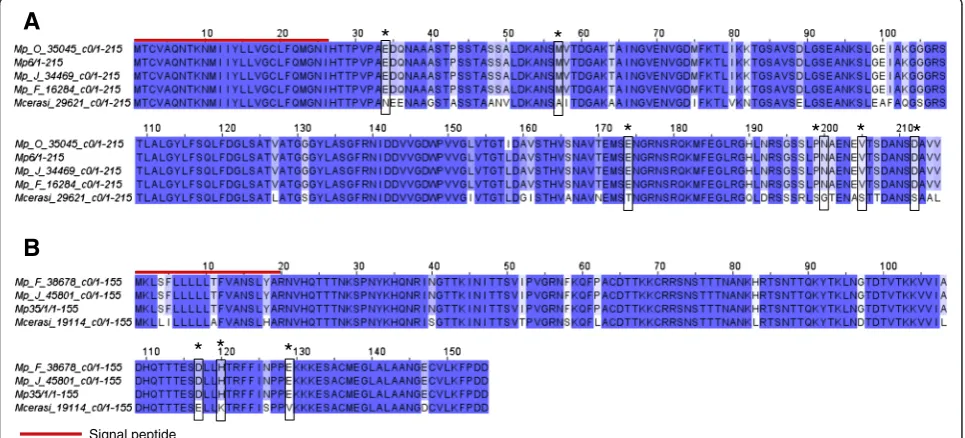
One group, containing M. persicae candidate effector Mp6 [11] was conserved within M. persicae genotypes, but divergent between M. persicae and M. cerasi (DN/ DS ratio = 1.90) (Table 2; Fig. 3). We also identified a group, containing M. persicae candidate effector Mp35, with a DN/DS ratio of 3.0 that shows high conservation withinM. persicae, but variation between the two differ-ent Myzusspecies (Table 2; Fig. 3). The sequences from these two species contain 32 nucleotide differences that correspond to 16 amino acid differences. This is also the case for Mp12 cluster, which is conserved inM. persicae
but shows significant variation when compared to the pea aphid sequence (Table 2).
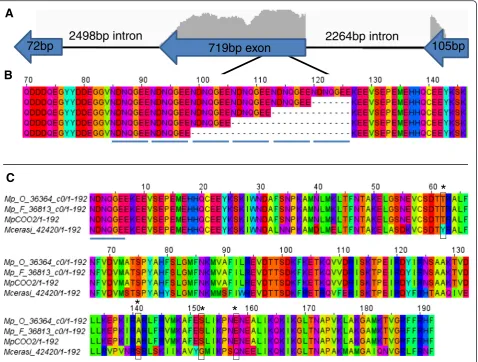
For the RBBH group containing the aphid effector C002 [17] we removed the N-terminal repeat region, which is highly variable in length among different aphid species, prior to DN/DS analyses. The full-length M. persicae form of C002, here called MpC002, contains 5 repeat motifs (NDNQGEE, see Fig. 4(b)), which are im-portant for virulence activity [13]. OurM. persicae tran-scriptome analyses identified variants with 2–6 repeat motifs. It is unclear whether this variation results from assembly artefacts or whether this is genuine variation.
[image:11.595.57.539.122.274.2]MpC002 is a single copy gene encoded on the negative
Table 2Reciprocal best blast hit analysis identified 1:1 orthologues between the transcriptomes. The resulting clusters, if they contained a putative effector were subjected to DN/DS analysis to identify any clusters under positive selection (DN/DS >1.0). Those identified as possibly under selection are listed in the table(Continued)
LOC100162393A. pisum Bioinformatics 1.35 245 Myzus,A. pisum,R. padi
LOC100169018A. pisum Bioinformatics 1.30 4753 M. persicae
Pioneers Bioinformatics 1.29 4395 Myzus
LOC100160479A. pisum Bioinformatics 1.24 3806 Myzus,A. pisum
LOC100167515A. pisum Bioinformatics 1.19 983 Myzus,A. pisum,R. padi,A.
glycines
LOC100167306A. pisum Bioinformatics 1.17 5666 Myzus,R. padi,A. glycines
ACYPI007464A. pisum Bioinformatics 1.17 13983 Myzus,R. padi,A. glycines
LOC100168723A. pisum Bioinformatics 1.16 1851 Myzus,A. pisum
Serine proteinase Bioinformatics 1.15 937 M. persicae,R. padi,A. pisum
LOC100159010A. pisum Bioinformatics 1.14 5327 Myzus,A. pisum
*
*
*
*
*
*
A
B
* *
*
Signal peptide
[image:11.595.57.540.462.681.2]strand that contains a 105 bp exon, followed by a 2264 bp intron, followed by a 719 bp exon, followed by a 2498 bp intron, followed by a final 72 bp exon that is poorly supported by RNA-Seq data (Fig. 4). The repeat amino acid motifs are encoded within the 719 bp exon, with no evidence of any intron regions around this area for splicing to occur.M. cerasiC002 transcripts differ in this region, but again encode for a variable length repeat motif, composed of one NDDQGEV motif followed by four or five repeats of the NDNQGEV motif. No repeat motifs were found in R. padi C002, and this form was highly divergent from the M. persicae and M. cerasi
forms and therefore did not fall within the C002 RBBH group. The DN/DS (2.6) value for the C002 cluster was based on variations seen between M. persicae and M. cerasi. The sequences corresponding to C002 within these species contained 81 nucleotide differences
corresponding to 47 amino acid changes within the 159 amino acid region following the repeat motifs (Fig. 4(c)).
As mentioned above, sequences similar toM. euphor-biae effector Me10 [10] were among those most highly expressed in all species included within this study. Our RBBH and DN/DS analyses revealed the Me10-like se-quences are under positive selection (Table 2).
We also identified several RBBH groups that contained sequences under positive selection among the different
M. persicae genotypes (Table 2; Additional file 12). For example, Group_12749, with similarity to A. pisum
XM_003246613.2, showed high levels of variation be-tween M. persicaegenotype F and the other two geno-types. Also, in Group_12369, which is annotated as a glucose dehydrogenase, we found variation between M. persicae genotypes. Interestingly we found sites under positive selection that fall within GMC oxireductase
72bp
2498bp intron
719bp exon
2264bp intron
105bp
A
*
B
C
*
*
*
Fig. 4Analysis of C002 sequences identified.aMpC002 is a single copy gene encoded on the negative strand by three exons. The height of the
[image:12.595.61.540.88.450.2]domains (Fig. 5). Mutations in these domains may be important for co-evolution with host plants in a changing environment. We also identified several pioneer effectors as being under positive selection. These were included in Group_12331, which containedM. persicaespecific sequences and Group_6006, which only contains sequences from M. persicaeandM. cerasi(Table 2). This highlights these pioneers are interesting sequences for further investigation.
Among the 49 RBBH groups we identified as potentially being under positive selection, 12 contained just the threeM. persicaegenotypes (Table 2; Additional file 12). In particular, we identified predicted effector variants within the transcrip-tome of genotype F that were different to those from the other genotypes. Compared to genotypes J and O, this F genotype is slow with regards to reproduction rates in several host plant species tested [25]. Whether this slow reproduction can be due to differences in aphid predicted effector reper-toires is speculative, and remains to be further investigated.
Conclusion
In conclusion we employed a combination of tran-scriptomics and saliva proteomics in order to identify and compare the putative effector repertoires from three aphid species. We have identified putative conserved effector sets, which are predicted to exhibit similar functions in different plant-aphid interactions. Such con-served effectors could be useful targets for the develop-ment of alternative control methods to provide broad range aphid control. Furthermore, we identified more
diverse putative effector sets, which may be important for specific plant-aphid interactions and therefore in determining aphid host range.
Methods
Aphids stocks and material
Aphids were maintained in growth rooms at 18 °C with a 16 h light and 8 h dark period.M. persicae (genotype O, F and J) was maintained on potato (Solanum tubero-sumcv.Desiree),M. cerasiwas maintained on American Land Cress (Barbarea verna) and R. padi was main-tained on barley (Hordeum vulgarecv. Optic). M. persi-cae (genotype O, F and J) were genotyped prior, during and after all samples were collected to ensure the integ-rity of the colony (Aphid lineages supplied and geno-typed by Gaynor Malloch and Brian Fenton, The James Hutton Institute).
RNA sample preparation and sequencing
Raw data is available at PRJEB9912 http://www. ebi.ac.uk/ena/data/view/PRJEB9912. Assemblies are also available through Aphidbase http://www.aphidbase.com/
Aphid heads, 100–200 per biological replicate, were dissected under a microscope in 1 % PBS. Aphid bodies were processed separately, 50–100 per biological repli-cate, by removing the head and removing any nymphs inside the aphid bodies. Dissected aphid samples were preserved in RNAlater (Sigma-Aldrich) until flash freez-ing in liquid nitrogen. Total RNA was extracted usfreez-ing a
**
Pfam05834 Pfam0073 Pfam05199
*
*
*
[image:13.595.56.540.453.682.2]plant RNA extraction kit (Sigma-Aldrich), following the manufacturer’s instructions. We prepared three bio-logical replicates for heads and bodies for each species and genotype. RNA quality was assessed using a Bioana-lyzer (Agilent Technologies) and a Nanodrop (Thermo Scientific). RNA sequencing libraries were constructed with an insert size of 250 bp according to the TruSeq RNA protocol (Illumina), and sequenced at The Genome Analysis Centre, Norwich (http://www.tgac.ac.uk/) using Illumina-HiSeq 100 bp paired end sequencing.
Filtering, quality control and assembly of RNA-seq data
An overview of our data analyses pipeline is shown in Fig. 1. The raw reads were assessed for quality before and after trimming using FastQC [48]. Raw reads were quality trimmed using Trimmomatic-0.32 [49], then assembled using Trinity with itsk-mer coverage normalisation (version r20131110) [50]. CD-HIT (4.5.4) [51], with a threshold of 99 %, was used to reduce redundancy in the final assembly forM. persicae andM. cerasi datasets.R. padi was repre-sented by 113,734,137 or 109,521,265 reads before and after trimming. In comparison M. persicae genotype O was represented by 137,205,488 or 124,984,399 reads before and after trimming, these number are representative of the other datasets.R. padihad the lowest number of reads generated. The read quantity could account for the smaller assembly for R. padi. The individual libraries of quality controlled reads where then mapped back to the post-CD HITde novo
assembly using Bowtie 1.0 [52] to assess digital expression. Normalised TMM-FPKM digital expression values and differential expression analysis was conducted using EdgeR [53], using p< 0.001 as a statistical threshold. Three bio-logical replicate head and body libraries for each aphid spe-cies and genotype were prepared and sequenced. Following differential expression analysis and clustering of expression profiles, using EdgeR [53], an outlier head sample fromM. persicae genotype F analysis (809_LIB4703_LDI4448_GAT CAG_L008_R1 and R2) was removed from downstream analyses as it did not cluster with the other head samples.
Prediction of coding sequences and annotation
For each component, loosely described by Trinity as a “gene”, the lowest expressing isoforms were removed as previously described [54]. This yielded the expressing transcripts per component. TransDecoder (version r20131117) [55] was used to predict the coding sequen-cing within transcripts using PfamA and PfamB defini-tions as a guide (release 27), transcripts that did not contain Pfam domains where also predicted by Trans-Decoder. The resulting coding sequences were annotated using Trinotate (version r_20131110) [50], HMMER (ver-sion 3.1b1) [56], Pfam (release 28) [54], SignalP (ver(ver-sion 3.0) [57], TMHMM (version 2.0) [58], BLAST+ (version 2.2.30) [59], gene ontology [60], eggNOG (version 3.0)
[61] and RNAmmer (version 1.2) [62]. A Galaxy pipeline [63] was used to identify putative secreted proteins by the presence of a signal peptide and the absence of a transmembrane domain [23]. Nuclear localisation was predicted using NoD (version 1.3b) [64] and cellular localisation was predicted using WoLF PSORT (last modified date 2006 Aug 31) [65], again within Galaxy [23]. Transcripts that were upregulated in the head tissue and were predicted to be secreted were classified as encoding putative effectors. Whereas, transcripts that were upregulated in body tissue were classified as encod-ing other secreted proteins. BLAST2GO (version 2.8, database September 2013) analysis was conducted using the online service (https://www.BLAST2go.com/ b2ghome) [66]. Read mapping visualisation was per-formed using a combination of Tablet [67] and IGV [68].
The predicted unigenes were BLASTP searched against NCBI NR database (e-value 1e-5), BLAST+ version 2.2.30). The best hit was recorded for each sequence with the NCBI taxonomy ID, kingdom and genus.
To identify C002 transcripts which would previously have been collapsed (redundancy) in the assembly due to the use of CD-HIT, MIRAbait (version 4.0) [69] was used to identify reads that map onto the published C002 se-quence (k= 25). The corresponding scaffold for C002 was identified using http://www.aphidbase.com/node_94263/ Myzus-DB (Scaffold_246: August 2014). The identified reads were mapped using the splice-aware aligner TopHat (version 2.0.11) [70].
Comparative transcriptomics
An overview of our data analyses pipeline is shown in Fig. 1. Predicted protein sets derived from the transcriptomes generated in this project as well as the transcriptomes of A. glycines (soybean aphid) [28] and
In addition, we performed clustering of putative ortho-logous sequences as described in [72]. Briefly, putative 1:1 orthologues were identified using RBBH (Reciprocal Best BLAST Hit Analysis) between the amino acid sequences predicted from the 5 aphid transcript datasets generated in this project, the gene models for the pea aphid, and the soybean aphid (reassembled for this project), as described above. The thresholds for identifi-cation for putative 1:1 orthologues included using a minimum threshold of 70 % identity and 50 % query coverage. Tied top scoring BLAST hits (as might be expected with recent gene duplications) were rejected by the RBBH script, which identified pairs only https:// github.com/peterjc/galaxy_blast/tree/master/tools/ blast_rbh [73]. This analysis is limited by the availability of transcriptome data only, and did not take into consid-eration possible gene duplication, which is common in aphid genomes. Once we identified RBBH-partner se-quences, a network was generated using MCL from the RBBH data, resulting in RBBH-clusters. The RBBH data was passed into MCL as an abc file: query, hit, e-value. We calculated the DN/DS values for each cluster that contained a predicted effector protein based on our work as well as several published studies [11, 12, 20]. To calculate the DN/DS ratio for a cluster of orthologues, the sequences were aligned using MUSCLE (version 3.8.31) [74], then the nucleotide sequences were back-translated onto the alignments (https://github.com/ peterjc/pico_galaxy/tree/master/tools/align_back_trans) [75]. These were then manually altered using Jalview [76] by removing non-consensus, possibly miss-predicted 5′ and 3′ regions based on either pea aphid genome annotations and/or consensus sequences, where appropriate. Indel regions were also removed, as was the repeat motif region in putative effector C002. Modified alignments were subjected to DN/NS analysis using CodonPhyml (version 1.0) [77]. The trees generated by CodonPhyml were then used by PAML (version 4.8) (Codeml) [78] to identify the site most likely to be under selection pressure.
Phylogenetic analysis
Single copy orthologous genes identified and analysed by Misof et al. [29] were used as a basis for phylogenetic analysis. RBBH analysis (as described above) between the transcriptomes and the pea aphid protein set identi-fied orthologous sequences. This was used to identify orthologues from the transcriptomes to those genes used for the pea aphid sequences in Misof et al. [29]. Only 712 out of 1478 orthologues from the genes used by Misof et al. [29] were identified. We only included genes represented by 4 or more of the aphid species used for analyses, which amounted to 71 genes. The amino acid sequences corresponding to these genes were aligned
using MUSCLE (with refine option) and the nucleotide sequences were back-translated to the alignment. The 71 aligned orthologous genes from Misof et al. [29] were concatenated with the back-translated alignments (as described above) and subjected to further alignment. MEGA6 [79] was used for phylogenetic analysis (Max-imum likelihood 150 boot straps).
Proteomic analysis
Aphids were transferred to a feeding chamber as de-scribed in Harmel et al. [22]. We used a diet similar to phloem sap (15 % sucrose, 100 mM L-serine, 100 mM L-methionine and 100 mM L-aspartic acid with a pH of 7.2 (KOH)) [18]. Approximately 60,000 aphids per species per genotype were fed on this artificial diet system. Diet/saliva mixes were collected 24 h after ex-posing the aphids to the diet. Samples were then con-centrated using protein concentration columns with a 9KDa molecular weight cut off (Thermo Scientific). Concentrated samples were run on SDS-PAGE gels and lanes were divided in three parts of equal size. Gel slices were processed and subjected to LC-MS/MS analyses using a RSLCnano UHPLC system coupled to a LTQ Orbitrap Velos Pro MS system (Thermo Scientific) at the University of Dundee Fingerprints Facility. We also analyzed the samples containing peptide and proteins <9 kDa, the flow through from the concentration col-umns, by LC-MS/MS. MASCOT software (version 2.4.1) searches against our transcriptome datasets as well as NCBI NR were used for peptide identification.
Additional files
Additional file 1:Nucleotide alignment of aphid EOG sequences for phylogenetic analysis.(FASTA 1597 kb)
Additional file 2:Annotation of the 100 most abundant transcript’s coding sequence for each of the aphids investigated.Top BLAST hit annotation for each of the identified coding sequences. (XLSX 27 kb)
Additional file 3:Annotation and amino acid sequences for predicted effectors based on RNA-seq and bioinformatics analyses. Also includes a list of previously identified putative effectors and corresponding sequences identified in this study (sheet 2). (XLSX 351 kb)
Additional file 4:Expression profiles of constitutively expressed genes.TMM-FPKM expression profile for transcripts constitutively expressed. (XLSX 15 kb)
Additional file 5:GO enrichment analysis for transcripts
upregulated in heads, bodies predicted to encode secreted proteins for each species.(PPTX 3205 kb)
Additional file 6:GO enrichment analysis data for all species. (TXT 9449 kb)
Additional file 7:Proteins identified in aphid saliva using LC-MS/ MS.Proteins identified in aphid saliva using LC-MS/MS when searching against thede novo transcriptomesand against NCBI NR database. The corresponding sequences of the proteins identified, and the raw LC-MS/ MS coverage data for each dataset investigated. (XLSX 99 kb)
identified by proteomics based on their digital RNA-seq expression profiles.The blue line represents the mean for all expression profiles and the green line represents +/−two standard deviations. (PDF 4 kb)
Additional file 9:Putative conserved effectors.List of conserved sequence clusters that contain candidate effectors identified in this study by transcriptomics or proteomics, or previously identified [22, 23, 50]. (XLS 51 kb)
Additional file 10:Clusters.Resulting clusters (one line per cluster) from aphid sequences subjected to MCL clustering analysis (BLAST-MCL-clustering). Another clustering method was used to identify 1:1 orthologues by using reciprocal best BLAST hit analysis of all the datasets, resulting in an RBBH-orthologues network (one line per cluster). Putative pioneer effectors were identified and their sequences are reported. (XLSX 4051 kb)
Additional file 11:Amino acid alignment for cluster_1269 which contained a proteomic identified sequence.This putative effector containing cluster had the greatest DN/DS ratio of all the effector containing clusters (DN/DS = 4.17). The sites most likely to be under selection pressure (P> 0.95) are marked on the alignment by boxes asterisks. (PPTX 142 kb)
Additional file 12:Nucleotide alignments.Clusters of interest identified from the 1:1 orthologues clustering method predicted to be under selection pressure based on DN/DS analysis. (ZIP 50 kb)
Additional file 13:Predicted nucleotide coding sequences for
Myzus persicaegenotype O.(GZ 12701 kb)
Additional file 14:Predicted nucleotide coding sequences for
Myzus persicaegenotype F.(GZ 12050 kb)
Additional file 15:Predicted nucleotide coding sequences for
Myzus persicaegenotype J.(GZ 11406 kb)
Additional file 16:Predicted nucleotide coding sequences for
Myzus cerasi.(GZ 13367 kb)
Additional file 17:Predicted nucleotide coding sequences for
Rhopalosiphum padiandAphis glycines. (GZ 8032 kb)
Competing interests
The authors declare that they have no competing interests.
Authors’contributions
PT contributed to the design of coordination of the study, carried out all wet lab experiments, bioinformatic analysis and contributed to the writing of the manuscript. PJAC assisted in the implementation and conception of the bioinformatic analysis and the writing of the manuscript, and wrote some of the bioinformatics scripts used. JB conceived the study, assisted in the design and coordination of the study, and contributed to the writing of the manuscript. All authors approved the final version of the manuscript.
Acknowledgements
This work was supported by ERC Starting Grant 310190-APHIDHOST and a Royal Society of Edinburgh Personal Fellowship awarded to JB. We would like to acknowledge the following people for their help throughout this project: Dr Leighton Pritchard, Ruari Macleod, Dr Pete Hedley, Dr Ali Karley, Dr Carolyn Mitchell, Dr Brian Fenton, Dr Gaynor Malloch, Dr Jim McNicol, the Fingerprints proteomics facility, University of Dundee for the mass spectrometry analysis and The Genome Analysis Centre for the RNA sequencing service.M. persicaeDNA sequence data was downloaded from AphidBase, http://www.a phidbase.com/aphidbase/ (Funding forM. persicaeclone G006 genomic sequencing was provided by USDA-NIFA award 2010-65105-20558).
Author details 1
Cell and Molecular Sciences, The James Hutton Institute, Invergowrie, Dundee DD2 5DA, UK.2Information and Computational Sciences, The James Hutton Institute, Invergowrie, Dundee DD2 5DA, UK.3Dundee Effector Consortium, The James Hutton Institute, Invergowrie, Dundee DD2 5DA, UK. 4
College of Life Sciences, University of Dundee, Dundee, UK.
Received: 9 September 2015 Accepted: 17 February 2016
References
1. Blackman R, Eastop V. Aphids on the World’s crops: An identification guide. Chichester. UK: Wiley; 2000. p. 466.
2. Bass C, Puinean AM, Andrews M, Cutler P, Daniels M, Elias J, et al. Mutation of a nicotinic acetylcholine receptorβsubunit is associated with resistance to neonicotinoid insecticides in the aphid Myzus persicae. Bmc Neuroscience. 2011;12(1):51. 3. Edwards OR, Franzmann B, Thackray D, Micic S. Insecticide resistance and
implications for future aphid management in Australian grains and pastures: a review. Animal Production Science. 2008;48(12):1523–30.
4. Puinean AM, Foster SP, Oliphant L, Denholm I, Field LM, Millar NS, et al. Amplification of a cytochrome P450 gene is associated with resistance to neonicotinoid insecticides in the aphid Myzus persicae. PLoS Genet. 2010;6(6):e1000999. 5. Hillocks R. Farming with fewer pesticides: EU pesticide review and resulting
challenges for UK agriculture. Crop Protection. 2012;31(1):85–93. 6. Blackman RL, Eastop VF. Aphids on the world’s herbaceous plants and
shrubs. New Jersey: John Wiley & Sons; 2008.
7. Jaouannet M, Morris JA, Hedley PE, Bos JIB. Characterization of Arabidopsis Transcriptional Responses to Different Aphid Species Reveals Genes that Contribute to Host Susceptibility and Non-host Resistance. Plos Pathogens. 2015;11(5):e1004918.
8. Powell G, Tosh CR, Hardie J. Host plant selection by aphids: behavioral, evolutionary, and applied perspectives. Annu Rev Entomol. 2006;51:309–30. 9. Sharma A, Khan AN, Subrahmanyam S, Raman A, Taylor GS, Fletcher MJ.
Salivary proteins of plant-feeding hemipteroids–implication in phytophagy. Bulletin of Entomological Research. 2014;104(02):117–36. 10. Atamian HS, Chaudhary R, Cin VD, Bao E, Girke T, Kaloshian I. In planta
expression or delivery of potato aphid Macrosiphum euphorbiae effectors Me10 and Me23 enhances aphid fecundity. Molecular Plant-Microbe Interactions. 2013;26(1):67–74.
11. Bos JI, Prince D, Pitino M, Maffei ME, Win J, Hogenhout SA. A functional genomics approach identifies candidate effectors from the aphid species Myzus persicae (green peach aphid). PLoS genetics. 2010;6(11):e1001216. 12. Elzinga DA, De Vos M, Jander G. Suppression of plant defenses by a Myzus
persicae (green peach aphid) salivary effector protein. Molecular Plant-Microbe Interactions. 2014;27(7):747–56.
13. Pitino M, Hogenhout SA. Aphid protein effectors promote aphid colonization in a plant species-specific manner. Molecular Plant-Microbe Interactions. 2013;26(1):130–9.
14. Bos JI, Armstrong MR, Gilroy EM, Boevink PC, Hein I, Taylor RM, et al. Phytophthora infestans effector AVR3a is essential for virulence and manipulates plant immunity by stabilizing host E3 ligase CMPG1. Proceedings of the National Academy of Sciences. 2010;107(21):9909–14. 15. Miles PW. Aphid saliva. Biological Reviews of the Cambridge Philosophical
Society. 1999;74(01):41–85.
16. Moreno A, Garzo E, Fernandez‐Mata G, Kassem M, Aranda M, Fereres A. Aphids secrete watery saliva into plant tissues from the onset of stylet penetration. Entomologia Experimentalis et Applicata. 2011;139(2):145–53. 17. Mutti NS, Louis J, Pappan LK, Pappan K, Begum K, Chen M-S, et al.
A protein from the salivary glands of the pea aphid, Acyrthosiphon pisum, is essential in feeding on a host plant. Proceedings of the National Academy of Sciences. 2008;105(29):9965–9.
18. Will T, Steckbauer K, Hardt M, van Bel AJ. Aphid gel saliva: sheath structure, protein composition and secretory dependence on stylet-tip milieu. PloS one. 2012;7(10):e46903.
19. Will T, Tjallingii WF, Thönnessen A, van Bel AJ. Molecular sabotage of plant defense by aphid saliva. Proceedings of the National Academy of Sciences. 2007;104(25):10536–41.
20. Carolan JC, Caragea D, Reardon KT, Mutti NS, Dittmer N, Pappan K, et al. Predicted effector molecules in the salivary secretome of the pea aphid (Acyrthosiphon pisum): a dual transcriptomic/proteomic approach. Journal of proteome research. 2011;10(4):1505–18.
21. Carolan JC, Fitzroy CI, Ashton PD, Douglas AE, Wilkinson TL. The secreted salivary proteome of the pea aphid Acyrthosiphon pisum characterised by mass spectrometry. Proteomics. 2009;9(9):2457–67.
22. Harmel N, Létocart E, Cherqui A, Giordanengo P, Mazzucchelli G, Guillonneau F, et al. Identification of aphid salivary proteins: a proteomic investigation of Myzus persicae. Insect molecular biology. 2008;17(2):165–74. 23. Cock PJ, Grüning BA, Paszkiewicz K, Pritchard L. Galaxy tools and workflows for
sequence analysis with applications in molecular plant pathology. PeerJ. 2013;1:e167. 24. Cooper WR, Dillwith JW, Puterka GJ. Salivary proteins of Russian wheat aphid
25. Fenton B, Kasprowicz L, Malloch G, Pickup J. Reproductive performance of asexual clones of the peach-potato aphid,(Myzus persicae, Homoptera: Aphididae), colonising Scotland in relation to host plant and field ecology. Bulletin of entomological research. 2010;100(04):451–60.
26. Consortium IAG. Genome sequence of the pea aphid Acyrthosiphon pisum. PLoS biology. 2010;8(2):e1000313.
27. Reddy ARS, Girinathan BP, Zapotocny R, Govind R. Identification and characterization of Clostridium sordellii toxin gene regulator. Journal of bacteriology. 2013;195(18):4246–54.
28. Liu S, Chougule NP, Vijayendran D, Bonning BC. Deep sequencing of the transcriptomes of soybean aphid and associated endosymbionts. PloS one. 2012;7(9):e45161.
29. Misof B, Liu S, Meusemann K, Peters RS, Donath A, Mayer C, et al. Phylogenomics resolves the timing and pattern of insect evolution. Science. 2014;346(6210):763–7.
30. Hoogewijs D, Houthoofd K, Matthijssens F, Vandesompele J, Vanfleteren JR. Selection and validation of a set of reliable reference genes for quantitative sod gene expression analysis in C. elegans. BMC molecular biology. 2008;9(1):9. 31. Yang C, Pan H, Liu Y, Zhou X. Selection of reference genes for expression
analysis using quantitative real-time PCR in the pea aphid, Acyrthosiphon pisum (Harris)(Hemiptera, Aphidiae). PloS one. 2014;9(11):e110454. 32. Cotton JA, Lilley CJ, Jones LM, Kikuchi T, Reid AJ, Thorpe P, et al. The genome
and life-stage specific transcriptomes of Globodera pallida elucidate key aspects of plant parasitism by a cyst nematode. Genome Biol. 2014;15:R43.
33. Chaudhary R, Atamian HS, Shen Z, Briggs SP, Kaloshian I: GroEL from the endosymbiont Buchnera aphidicola betrays the aphid by triggering plant defense. Proceedings of the National Academy of Sciences.2014:201407687. 34. Thorpe P, Mantelin S, Cock PJ, Blok VC, Coke MC, Eves-van den Akker S,
et al. Genomic characterisation of the effector complement of the potato cyst nematode Globodera pallida. BMC genomics. 2014;15(1):923. 35. Hewezi T, Howe PJ, Maier TR, Hussey RS, Mitchum MG, Davis EL, et al.
Arabidopsis spermidine synthase is targeted by an effector protein of the cyst nematode Heterodera schachtii. Plant Physiology. 2010;152(2):968–84. 36. Göhre V, Spallek T, Häweker H, Mersmann S, Mentzel T, Boller T, et al.
Plant pattern-recognition receptor FLS2 is directed for degradation by the bacterial ubiquitin ligase AvrPtoB. Current Biology. 2008;18(23):1824–32. 37. Anathakrishnan R, Sinha DK, Murugan M, Zhu KY, Chen M-S, Zhu YC, et al.
Comparative gut transcriptome analysis reveals differences between virulent and avirulent Russian wheat aphids, Diuraphis noxia. Arthropod-Plant Interactions. 2014;8(2):79–88.
38. Zhang S, Shukle R, Mittapalli O, Zhu YC, Reese JC, Wang H, et al. The gut transcriptome of a gall midge, Mayetiola destructor. Journal of insect physiology. 2010;56(9):1198–206.
39. DeLay B, Mamidala P, Wijeratne A, Wijeratne S, Mittapalli O, Wang J, et al. Transcriptome analysis of the salivary glands of potato leafhopper, Empoasca fabae. Journal of insect physiology. 2012;58(12):1626–34. 40. Su Y-L, Li J-M, Li M, Luan J-B, Ye X-D, Wang X-W, et al. Transcriptomic analysis of
the salivary glands of an invasive whitefly. PLoS One. 2012;7(6):e39303. 41. Ji R, Yu H, Fu Q, Chen H, Ye W, Li S, et al. Comparative Transcriptome
Analysis of Salivary Glands of Two Populations of Rice Brown Planthopper, Nilaparvata lugens. That Differ in Virulence. PloS one. 2013;8(11):e79612. 42. Sarker M, Mukhopadhyay A. Studies on salivary and midgut enzymes of a major
sucking pest of tea, Helopeltis theivora (Heteroptera: Miridae) from Darjeeling plains. India Journal of Entomological Research Society. 2006;8(1):27–36. 43. Steinbauer M, Taylor G, Madden J. Comparison of damage to Eucalyptus
caused by Amorbus obscuricornis and Gelonus tasmanicus. Entomologia experimentalis et applicata. 1997;82(2):175–80.
44. Soyelu O, Akingbohungbe A, Okonji R. Salivary glands and their digestive enzymes in pod-sucking bugs (Hemiptera: Coreoidea) associated with cowpea Vigna unguiculata ssp. unguiculata in Nigeria. International Journal of Tropical Insect Science. 2007;27(01):40–7.
45. Hori K. Insect secretions and their effect on plant growth, with special reference to hemipterans. Biology of insect-induced plant galls. New York: Oxford University Press; 1992. p. 157–70.
46. Adams MD, Celniker SE, Holt RA, Evans CA, Gocayne JD, Amanatides PG, et al. The genome sequence of Drosophila melanogaster. Science. 2000; 287(5461):2185–95.
47. Rodriguez PA, Stam R, Warbroek T, Bos JI. Mp10 and Mp42 from the aphid species Myzus persicae trigger plant defenses in Nicotiana benthamiana through different activities. Molecular Plant-Microbe Interactions. 2014;27(1):30–9.
48. Andrews S. FastQC: A quality control tool for high throughput sequence data. Reference Source 2010.
49. Bolger A, Giorgi F. Trimmomatic: A Flexible Read Trimming Tool for Illumina NGS Data. URL http://www.usadellab.org/cms/index.php.
50. Grabherr MG, Haas BJ, Yassour M, Levin JZ, Thompson DA, Amit I, et al. Full-length transcriptome assembly from RNA-Seq data without a reference genome. Nature biotechnology. 2011;29(7):644–52.
51. Li W, Godzik A. Cd-hit: a fast program for clustering and comparing large sets of protein or nucleotide sequences. Bioinformatics. 2006;22(13):1658–9. 52. Langmead B. Aligning short sequencing reads with Bowtie. Current
protocols in bioinformatics. 2010:11.17. 11–11.17. 14.
53. Robinson MD, McCarthy DJ, Smyth GK. edgeR: a Bioconductor package for differential expression analysis of digital gene expression data.
Bioinformatics. 2010;26(1):139–40.
54. Yang Y, Smith SA. Optimizing de novo assembly of short-read RNA-seq data for phylogenomics. BMC genomics. 2013;14(1):328.
55. Haas BJ, Papanicolaou A, Yassour M, Grabherr M, Blood PD, Bowden J, et al. De novo transcript sequence reconstruction from RNA-seq using the Trinity platform for reference generation and analysis. Nature protocols. 2013;8(8): 1494–512.
56. Finn RD, Clements J, Eddy SR. HMMER web server: interactive sequence similarity searching. Nucleic acids research. 2011;39 suppl 2:W29–37. 57. Bendtsen JD, Nielsen H, von Heijne G, Brunak S. Improved prediction of signal
peptides: SignalP 3.0. Journal of molecular biology. 2004;340(4):783–95. 58. Krogh A, Larsson B, Von Heijne G, Sonnhammer EL. Predicting
transmembrane protein topology with a hidden Markov model: application to complete genomes. Journal of molecular biology. 2001;305(3):567–80. 59. Camacho C, Coulouris G, Avagyan V, Ma N, Papadopoulos J, Bealer K, et al.
BLAST+: architecture and applications. BMC bioinformatics. 2009;10(1):421. 60. Ashburner M, Ball CA, Blake JA, Botstein D, Butler H, Cherry JM, et al. Gene
Ontology: tool for the unification of biology. Nature genetics. 2000;25(1):25–9. 61. Powell S, Szklarczyk D, Trachana K, Roth A, Kuhn M, Muller J, et al.
eggNOG v3. 0: orthologous groups covering 1133 organisms at 41 different taxonomic ranges. Nucleic acids research. 2012;40(D1):D284–9.
62. Lagesen K, Hallin P, Rødland EA, Stærfeldt H-H, Rognes T, Ussery DW. RNAmmer: consistent and rapid annotation of ribosomal RNA genes. Nucleic acids research. 2007;35(9):3100–8.
63. Goecks J, Nekrutenko A, Taylor J. Galaxy: a comprehensive approach for supporting accessible, reproducible, and transparent computational research in the life sciences. Genome Biol. 2010;11(8):R86. 64. Scott MS, Boisvert F-M, McDowall MD, Lamond AI, Barton GJ.
Characterization and prediction of protein nucleolar localization sequences. Nucleic acids research. 2010;38(21):7388–99.
65. Horton P, Park K-J, Obayashi T, Fujita N, Harada H, Adams-Collier C, et al. WoLF PSORT: protein localization predictor. Nucleic acids research. 2007;35 suppl 2:W585–7.
66. Conesa A, Götz S, García-Gómez JM, Terol J, Talón M, Robles M. Blast2GO: a universal tool for annotation, visualization and analysis in functional genomics research. Bioinformatics. 2005;21(18):3674–6. 67. Milne I, Bayer M, Cardle L, Shaw P, Stephen G, Wright F, et al.
Tablet—next generation sequence assembly visualization. Bioinformatics. 2010;26(3):401–2.
68. Thorvaldsdóttir H, Robinson JT, Mesirov JP. Integrative Genomics Viewer (IGV): high-performance genomics data visualization and exploration. Briefings in bioinformatics 2012:bbs017.
69. Chevreux B, Wetter T, Suhai S. Genome sequence assembly using trace signals and additional sequence information. In: German conference on bioinformatics. 1999;1999:45–56.
70. Trapnell C, Pachter L, Salzberg SL. TopHat: discovering splice junctions with RNA-Seq. Bioinformatics. 2009;25(9):1105–11.
71. Enright AJ, Van Dongen S, Ouzounis CA. An efficient algorithm for large-scale detection of protein families. Nucleic acids research. 2002;30(7):1575–84. 72. Jeffares DC, Tomiczek B, Sojo V, dos Reis M. A Beginners Guide to
Estimating the Non-synonymous to Synonymous Rate Ratio of all Protein-Coding Genes in a Genome. In: Parasite Genomics Protocols. New York: Springer; 2015. p. 65–90.
73. Cock PJ, Chilton JM, Grüning B, Johnson JE, Soranzo N. NCBI BLAST+ integrated into Galaxy. GigaScience. 2015;4(39):1–7.