Mallick, Sushanta and Matousek, Roman and Tzeremes, Nickolaos
G. (2016) Financial development and productive inefficiency: A robust conditional directional distance function approach.Economics Letters, ISSN 0165-1765. (In
press) (doi:10.1016/j.econlet.2016.06.019)
Abstract
This paper examines whether the level of financial development helps lower countries' inefficiency using time-dependent robust conditional directional distance functions in a sample of 91 countries over 1970-2011. The overall results reveal that the effect of financial development on countries' productive inefficiency is highly nonlinear, and depends on countries' income levels, suggesting that higher levels of financial development are enhancing more countries' catching-up ability rather than their technological change.
Keywords: Financial development; Technological change; Technological catch-up; Productive inefficiencies; Robust directional distance functions.
1. Introduction
The relationship between financial development and economic growth has been well analysed in the literature for several decades (King and Levine, 1993). Goldsmith (1969) was the first study suggesting that this relationship can be bidirectional. However, several studies suggest that money causes output (Berger and Österholm, 2009; Shen 2013; Beck et al., 2014). Maskus et al. (2012) explain the mechanism between financial development, innovation and economic growth relationship. Badunenko and Romero-Ávila (2013) provide a direct link between financial development and countries' aggregate levels of production efficiency. In their study, by applying the methodological framework of Kumar and Russell (2002), they construct a world production frontier for 57 countries over the period 1965-2005. Based on the theoretical framework of Badunenko and Romero-Ávila (2013), and the hypothesis that financial development drives growth, our study for the first time applies time-dependent conditional robust directional distance functions (Daraio and Simar, 2014; Mastromarco and Simar, 2015) to explore the effect of financial development on countries’ productive inefficiency levels.
on robust nonparametric frontiers and providing empirical evidence on the effect of financial development on countries’ technological catch-up and technological change levels.
2. Methodology
Let us consider countries' production process as a set of p inputs and qoutputs. Then the production set of the technical feasible combinations can be represented as:
x y, p q x can produce y
. (1)
Then the Farrell output distance of
x y, can be obtained as:
x y, sup
0
x, y
.
(2)By following Daraio and Simar (2014), we consider the joint probability measure of ( , ) and the probability function HXY
.,. defined as:
, Prob
,
,XY
H x y Xx Y y (3)
then can be identified with the support of HXY
.,. as:
x y, p q HXY x y, 0 .
(4)
Furthermore, as it has been described in the related literature (Bădin et al. 2012; Daraio and Simar, 2014; Mastromarco and Simar, 2015) and in the presence of time and financial development, we can further define the probabilistic formulation for countries' production process introduced previously. Specifically, let Zddenote the vector of factors/variables which is influencing the production process.1 Furthermore, the time Tas an additional conditional variable for each time period t defines the attainable set
z p q
t
as the support of the conditional probability:
, , Prob , , .
t X Y Z
H x y z X x Yy Z z Tt (5)
Then by following Daouia and Simar (2007) for any (0,1] with
Prob
0X
F x Xx the order-α quantile estimation can be obtained as:
x y, sup
0SY X
x, y
1
,
(6)
where SY X
x y, Prob
Yy X x
.2Recently Simar and Vanhems (2012) have introduced the probabilistic version of directional distance functions and the link with the order-α distances. In a general framework, consider a positive directional distance vector
,
p qx y
g g g having the same unit as the input and output vectors3. Then the order-α output oriented distance function can be defined as:
, ; y
sup
Y X
, y
1
.D x y g S x yg (7)
The order-α directional distance function can also be written as:
, ; y
log
,
,D x y g
x y%% (8)where
x y%%, sup
0SY X%%
y x%%
1
,which is the order-α quantileestimator but in thex y%%, coordinates.4 Then the time dependent conditional order-α directional distance function can be obtained as:
, , ; log , , ,
t y t
D x y g z x y z%% (9)
2 It must be noted that when a 1 then
x y,
x y,
.
3 For our case since we use output oriented measures, the directional distance vector will take the form
of g
0,gy .4In order to obtain the output orientation we adapt a monotonic increasing transformation of the
where ,
,
, sup 0 t , 1 ,
t x y z SY X Z y x z
%%
%%
%%
which is the time dependentconditional order-α quantile estimator presented in Mastromarco and Simar (2015, p.831) but in the x y%%, coordinates. Furthermore, values of D
x y g, ; y
and
, , ;
t y
D x y g z equal to 0 suggest that a country under evaluation is on the α-quantile frontier, whereas a positive value or a negative value indicates respectively that the country is below or above the quantile frontier. Then in a similar manner as in Daraio and Simar (2014, p363), we can analyze the effect of time and financial development by constructing the following differences:
,0.95 0.95 ,0.95
,0.5 0.5 ,0.5
, , , ; , ;
, , , ; , ; .
t y t y
t y t y
x y z D x y g D x y g z
x y z D x y g D x y g z
(10)
When choosing α value near unity (α=0.95) we analyze a robust version of the full frontiers levels and when we are choosing α=0.5 we can estimate the median of the distributions. In that respect when we are looking in a three dimensional picture5 of
,
ˆ , ,
t x y z
as a function of the elements of Z and T we are able to investigate the
tendency of to increase or decrease with zand t. An increasing trend indicates a negative effect of zand t on the attainable set, whereas, a decreasing trend indicates a positive effect. Finally, as has been highlighted by Bădin et al. (2012) and Mastromarco and Simar (2015) when investigating the differences of
t,0.5 we analyse the effect ofzand t on countries' catching-up levels (effects on the distribution of inefficiencies), whereas when investigating the differences of
t,0.95 we investigate the effect on countries' levels of technological change (effects on the boundary/swift of the frontier).
5 We apply a local linear estimator and for computational issues and selections of bandwidths, see Bădin
3. Empirical Findings
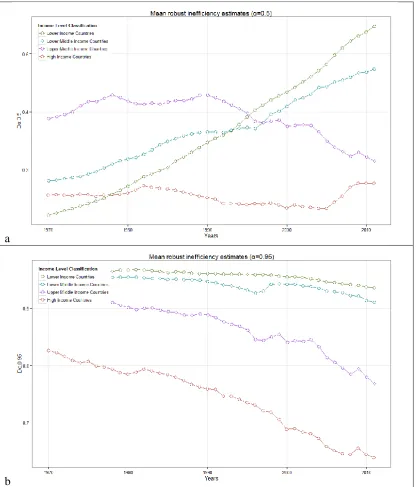
We use a sample of 91 countries6 over the period 1970-2011. We consider here the simplest production model by using countries' aggregate capital stock, total labour force and GDP.7 Following King and Levine (1993) and Arestis and Demetriades (1997), we use money and quasi money (M2) as a proxy of financial development8. Specifically we deploy money and quasi money as percentage of GDP (M2), extracted from World Bank WDI database.9 Figure 1 presents the mean inefficiencies values based on countries income classifications.10 Subfigure 1a with the inefficiencies derived with 0.5indicates that lower- income and lower middle-income countries have increased their production inefficiencies almost in a similar manner. For the upper middle-income countries it is evident that the production inefficiencies have decreased, whereas, the lowest inefficiencies are reported for the high income countries. When we examine subfigure 1b
a0.95
we may argue that lower income and lower middle income countries have the highest inefficiencies (above 0.9 on average terms), whereas, the upper middle income countries seem to lower their inefficiency levels. High income countries lower their production inefficiency levels in a more pronounced way compared to the other three country groups.
6ARG, AUS, BDI, BEN, BFA, BHS, BOL, BRA, BRB, BWA, CAF, CAN, CHE, CHL, CIV, CMR,
COD, COG, COL, CRI, DNK, DOM, ECU, EGY, FIN, FJI, GAB, GBR, GHA, GMB, GTM, HND, IDN, IND, IRL, IRN, ISL, ISR, ITA, JAM, JOR, JPN, KEN, KOR, KWT, LKA, MAR, MDG, MEX, MLI, MLT, MRT, MWI, MYS, NER, NGA, NLD, NOR, NPL, NZL, OMN, PAK, PAN, PER, PHL, PRY, QAT, ROM, RWA, SAU, SDN, SEN, SGP, SLE, SLV, SUR, SWE, SWZ, SYR, TCD, TGO, THA, TTO, TUN, TUR, UGA, URY, USA, VEN, ZAF, ZMB.
7The data have been extracted from Penn World Table v8.1 (Feenstra et al., 2015).
8Due to lack of consistent country-level data availability across different databases (PWT8.1 and WDI),
we extracted our data sample for 91 countries over the period 1970-2011 for our analysis. As a robustness check we also use as a proxy of financial development the domestic credit to private sector (as % of GDP). We have compiled the variable from World Development Indicators within Datastream. Due to length restrictions the results are presented as supplemental material.
9The data can be downloaded from: http://data.worldbank.org/indicator/FM.LBL.MQMY.GD.ZS. 10For the purpose of our analysis we have chosen a direction for
y
Insert Figure 1 about here
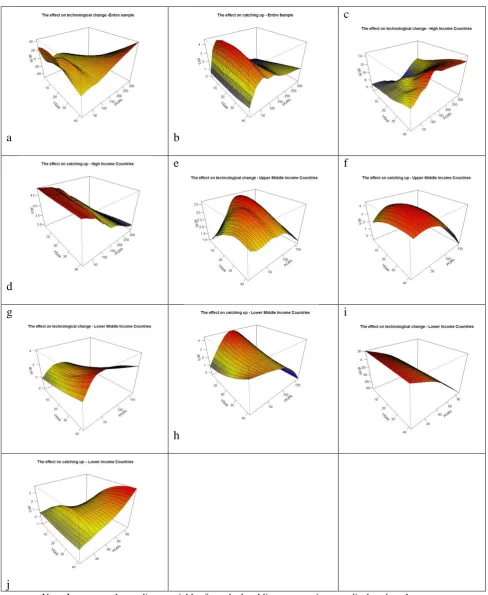
Figure 2 presents the 3-dimensional pictures of the effect of time and financial development on countries' catch-up (subfigures 2b, 2d, 2f, 2h & 2j) and technological change (subfigures 2a, 2c, 2e, 2g & 2i) levels. The evidence of the entire sample (subfigures 2a and 2b) suggest that financial development has a positive effect on countries' technological change up to a certain level; however for higher level of M2 the effect becomes negative.11 In fact this finding presents further evidence by supporting the studies by Shen (2013) and Beck et al. (2014) suggesting the existence of diminishing returns to improvement in financial development. Moreover, for the case of catching-up, the 3-dimensional picture suggests that countries' financial development influences positively countries' catch-up levels but in a nonlinear manner indicated by a decreasing nonparametric regression line. In both cases a nonlinear relationship is revealed providing further evidence to the studies that found that financial development-economic growth relationship is nonlinear (Shen 2013; Beck et al., 2014). For high income countries (subfigures 2c & 2d) it appears that the effect of financial development on those countries' technological change levels forms an 'N'-shape relationship, suggesting that for lower M2 levels the effect is negative, then for higher levels of M2 the effect is positive and for the top-end of M2 levels the effect becomes again negative. This means that lower productive inefficiency around the threshold level of financial development reflects more efficient allocation of financial resources while excessive financial deepening could make firms less efficient increasing the level of average inefficiency again.
11As has been explained previously, a negative slope indicates a positive effect, whereas, a positive
On the other hand the effect of financial development on high income countries catching-up levels is positive, indicated by a decreasing nonparametric regression line. For the upper middle income countries (subfigures 2e & 2f) the results suggest a nonlinear relationship and a positive effect of financial development both on countries' technological change and catching-up levels. For lower middle income countries (subfigures 2g & 2h) the effect suggests an inverted "U"-shape relationship both for countries’ technological change and catching-up. This in turn indicates a negative effect of financial development for lower M2 values and a positive effect for higher M2 values. Moreover, for lower income countries the effect suggests a light "U"-shape relationship both for technological change and catching-up, suggesting that there is a positive effect for lower M2 but after specific threshold values of M2 the effect becomes negative both on countries' technological change and catching-up.
Insert Figure 2 about here
findings suggest a positive effect on countries’ technological change for all values of domestic credit to the private sector.
Insert Figure 3 about here
4. Conclusions
Based on the theoretical framework of Badunenko and Romero-Ávila (2013) our paper applies conditional robust directional distance frontiers analysis in order to examine the dynamic effects of financial development on countries' productive inefficiency levels. Specifically, the paper applies the recent developments on efficiency measurement (Daraio and Simar, 2014; Mastromarco and Simar, 2015) on a sample of 91 countries over the period 1970-2011. Since frontier analysis estimates the run equilibrium relationship, our results provide evidence that the overall long-run effect of financial development on technological change and on technological catch-up is non-linear. To this extent we contribute to the few studies that provide empirical evidence on whether financial development affects technological deepening (Ang, 2011). The overall results suggest that the effect of financial development is positive on countries’ technological change and on technological catch-up but it is subject to countries’ income levels. Finally our findings, regardless of the proxy of financial development whether domestic credit to private sector or M2, suggest that the relationship between financial development, technological change and technological catch-up is highly nonlinear supporting the resent studies by Shen (2013) and Beck et al. (2014) suggesting an inverted U-shaped nonlinear relationship between financial development and growth.
Acknowledgements: We would like to thank Pierre-Daniel Sarte (the Editor) and an
References:
Ang, J.B., 2011. Financial development, liberalization and technological deepening. European Econom. Rev. 55, 688-701.
Arestis, P. and Demetriades, P., 1997, Financial development and economic growth: Assessing the evidence. Econom. J., 107: 783-799.
Bădin, L., Daraio, C., Simar, L., 2012. How to measure the impact of environmental factors in a nonparametric production model? European J. Oper. Res. 223, 818–833. Badunenko, O., Romero-Ávila, D., 2013. Financial development and the sources of growth and convergence. Int. Econom. Rev. 54, 629-663.
Beck. R., Georgiadis, G., Straub, R., 2014. The finance and growth nexus revisited. Econom. Lett. 124, 382-385.
Berger, H., Österholm, P. 2009. Does money still matter for U.S. output? Econom. Lett. 102, 143-146.
Daouia, A., Simar, L., 2007. Nonparametric efficiency analysis: a multivariate conditional quantile approach. J. Econometrics 140, 375–400.
Daraio, C., Simar, L., 2014. Directional distances and their robust versions: Computational and testing issues. European J Oper Res 237, 358-369.
Feenstra, R. C., Inklaar, R., Timmer, M.P. 2015.The Next Generation of the Penn World Table. American Econom. Rev. 105, 3150-3182.
Goldsmith R.W. (1969) Financial Structure and Development. Yale University Press, New Haven.
King, R.G., Levine, R., 1993. Finance and growth: Schumpeter might be right. Q. J. Econom. 108, 717-737.
Kumar, S., Russell, R.R., 2002. Technological change, technological catch-up, and capital deepening: Relative contributions to growth convergence. American Econom. Rev. 92, 527-548.
Maskus, E.K., Neumann, R., Seidel, T., 2012. How national and international financial development affect industrial R&D. European Econom. Rev. 56, 72-83.
Mastromarco, C., Simar, L., 2015. Effect of FDI and time on catching up: New insights from a conditional nonparametric frontier analysis. J. Appl. Econometrics 30, 826-847. Shen, L., 2013. Financial dependence and growth: Diminishing returns to improvement in financial development. ? Econom. Lett. 120, 215-219.
Figure 1: Diachronical representation of countries’ robust inefficiency levels based on countries’ income levels
Figure 2: The effect of 'M2' and 'time' on countries’ technological change and technological catch-up.
a
a b c
d e
f
g
h
i
j
Note: In our case the predictor variables from the local linear regressions are displayed on the axes labelled as ‘YEARS’ and ‘M2%’, and the response variable (i.e. δ0.5, δ0.95) is then represented by a grid
Figure 3: The effect of domestic credit to private sector (as % of GDP)-'PCR%' and 'time' on countries’ technological change and technological catch-up.
a b
c
d
e f
g
h
i
j
Note: In our case the predictor variables from the local linear regressions are displayed on the axes labelled as ‘YEARS’ and ‘PCR%’, and the response variable (i.e. δ0.5, δ0.95) is then represented by a