INTRODUCTION
Studies between species of different sizes have identified musculoskeletal and biomechanical variations that occur with increasing body size to enable an animal to achieve the desired level of athletic performance, whilst maintaining essential safety factors. Variations in morphology and the way in which an animal moves account for much of this, with these factors also being specific for the environment in which the animal must live (Dickinson et al., 2000). For example, birds that are specialised for swimming or wading show differences in gait parameters from those reliant on cursorial gait for survival (Abourachid, 2001). Kinematics of terrestrial gaits therefore vary depending on size, species and environmental pressures. Despite the essential differences in kinematic gait parameters observed between species, there are also similarities, and many species over a large size range have been found to move in a dynamically similar way (Alexander and Jayes, 1983; Bullimore and Burn, 2006; Farley et al., 1993; Gatesy and Biewener, 1991; Heglund et al., 1974).
In order for two systems to be dynamically similar, relevant locomotor parameters should scale appropriately with size, such that if multiplied by a specific numerical scaling factor they would be identical in magnitude. In addition, for two systems to truly move in a dynamically similar way, they should also be geometrically similar, where lengths would be identical if multiplied by a scaling factor, such that masses are directly proportional to body mass (Mb1), lengths scale proportional to Mb1/3and areas scale proportional to
Mb2/3, as has been shown to be the case for many species, both bipedal and quadrupedal, over a large size range (Alexander et al., 1979; Alexander et al., 1981; Biewener, 1982; Christiansen, 2002;
Maloiy et al., 1979; Olmos et al., 1996). Hence, for dynamically similar locomotion at a similar relative speed (equal Froude number), relative stride length, relative stride frequency, relative peak force and duty factor (defining the proportion of the stride time that an individual foot is in contact with the ground) should remain constant with increasing body size. Nevertheless, factors such as the stresses in bone, muscle and tendon limit the forces that an animal can withstand during locomotion and the forces applied to the musculoskeletal system are dependent on size, speed and limb orientation. The ability of biological materials to withstand stress or strain is an inherent material property and is independent of body size (Biewener, 1982; Pollock and Shadwick, 1994; Taylor 2000); therefore, in order to perform in exactly the same way as a small animal, a large animal must be expected to change its design and cannot simply be a larger replica, without significantly increasing the stresses on the limb bones (Biewener, 1982). Hence, maintaining similar stress within the body tissues necessitates appropriate changes in specific segment geometry or postural arrangement (Biewener, 1989; Main and Biewener, 2007).
Ecological constraints placed on the ostrich require that from a young age it is able to run fast to avoid predation and travel long distances economically and the musculoskeletal specialisation which allows this athletic performance includes long light legs, consistent with other terrestrial cursors (Hildebrand and Hurley, 1985), and relatively large body size. As ostriches hatch at masses of approximately 600g and must grow quickly to achieve adult stature, the growth rate in this species is rapid, increasing in mass by a factor of 100 within six months and showing a 10-fold increase in height during the same time span. Ontogenetic studies in other species have
The Journal of Experimental Biology 213, 1347-1355 © 2010. Published by The Company of Biologists Ltd doi:10.1242/jeb.020271
Ontogenetic scaling of locomotor kinetics and kinematics of the ostrich
(Struthio camelus)
Nicola C. Smith
1,*, Karin J. Jespers
1and Alan M. Wilson
1,21The Royal Veterinary College, Hawkshead Lane, North Mymms, Hatfield, Hertfordshire, AL9 7TA, UK and
2University College London, Gower Street, London WC1E 6BT, UK
*Author for correspondence at present address: Faculty of Science, Kingston University, Penrhyn Road, Kingston-upon-Thames, London, KT1 2EE, UK (nicola.smith@kingston.ac.uk)
Accepted 29 December 2009
SUMMARY
Kinematic and kinetic parameters of running gait were investigated through growth in the ostrich, from two weeks up to 10 months of age, in order to investigate the effects of increasing body size. Ontogenetic scaling relationships were compared with published scaling relationships found to exist with increasing body size between species to determine whether dynamic similarity is maintained during growth. During the study, ostrich mass (Mb) ranged from 0.7kg to 108.8kg. Morphological measurements
showed that lengths scaled with positive allometry during growth (hip height ⬀Mb0.40; foot segment length ⬀Mb0.40;
tarsometatarsus length ⬀Mb0.41; tibiotarsus length ⬀Mb0.38; femur length ⬀Mb0.37), significantly exceeding the close to geometric
scaling observed between mammalian and avian species of increasing body size. Scaling of kinematic variables largely agreed with predicted scaling for increasing size and demonstrated relationships close to dynamic similarity and, as such, ontogenetic scaling of locomotor parameters was similar to that observed with increasing body mass between species. However, the ways in which these scaling trends were achieved were very different, with ontogenetic scaling of locomotor mechanics largely resulting from simple scaling of the limb segments rather than postural changes, likely to be due to developmental constraints. Small deviations from dynamic similarity of kinematic parameters and a reduction in the predicted scaling of limb stiffness (⬀Mb0.59)
were found to be accounted for by the positive allometric scaling of the limb during growth.
identified deviations from isometric scaling, reporting evidence of both positive (Carrier, 1983; Carrier and Leon, 1990; Heinrich et al., 1999; Main and Biewener, 2007) and negative (Irschick and Jayne, 2000; Miller et al., 2008) allometry of bone length of specific bones in a variety of species. However, none of the species previously studied through growth show the large and rapid increase in body size observed in the ostrich, or the level of athletic performance of the fastest living biped, which in itself has implications for stress in the musculoskeletal system.
This study aims to investigate whether reported interspecific scaling factors, applied to define size-dependent properties between species, apply within a species during growth, helping to limit stress in biological tissues during locomotion. Our null hypothesis is that the limb bones of ostriches scale equal to or less than isometric scaling, with the alternative being positive allometric ontogenetic scaling as observed in other bird species during growth (Carrier and Leon, 1990; Main and Biewener, 2007). The ontogenetic requirements of the ostrich are closer to species that have been shown to have limb bones that scale with positive allometry [e.g. jack rabbit (Carrier, 1983); gull (Carrier and Leon, 1990); muskox (Heinrich et al., 1999); emu (Main and Biewener, 2007)] than those with negative allometric scaling [e.g. lizard (Irschick and Jayne, 2000); elephant (Miller et al., 2008)]. Positive allometry may relate to the pressure to grow quickly and to the required athleticism of the species during ontogeny and as an adult or to the species-specific starting point in terms of development and limits of growth of the musculoskeletal system. Because interspecific scaling close to isometry allows for dynamic similarity between species of differing size, the proposed allometric scaling during ontogeny may, therefore, result in different scaling of dynamic biomechanical parameters for an ostrich during growth compared with varied species of comparable sizes, with implications for both performance and musculoskeletal loading.
MATERIALS AND METHODS
Fifteen African Black ostriches (Struthio camelus var. domesticus L.), eight males and seven females, were used for this study. The ostriches were obtained from a UK ostrich farm (MNS Ostriches Ltd, Devon, UK) and were hand reared from two days to 10 months of age. The birds all had an identical feeding and exercise regime, with free exercise in a covered pen, size 10m ⫻22m for the first two months and in a large paddock for the remainder of the study. Growth rates were measured from one week to 10 months of age, such that measurements of mass, hip height and segment lengths of the pelvic limb were made at regular but gradually increasing intervals, to coincide with experimental measurements. Pelvic limb segments were measured as lengths, in metres, between bony landmarks on which markers were placed defining the femoral, tibiotarsal, tarsometatarsal and foot segments (including all phalanges of the 3rd digit). Hip height was measured as the height, in metres, of the hip (femoral trochanter) in a standing posture. All measurements were taken five times and the mean lengths for each bird at a specific time point were used in the analysis.
From two weeks of age the ostriches were trained to run at a self-selected speed along a rubber-topped runway with an embedded force plate (9287BA, Kistler Instruments Ltd, Hook, Hampshire, UK), sampled at 1000Hz. Kinematics were measured simultaneously using a 3-D 240Hz four camera motion tracking system (ProReflex, Qualysis Inc., Gothenburg, Sweden) and retroreflective markers placed on anatomical palpable landmarks on the birds [hip (femoral trochanter), knee (lateral femoral condyle), intertarsal (ankle) joint (distal tibiotarsus – lateral condyle),
metatarsophalangeal (MTP) joint (distal tarsometatarsus – lateral condyle) and distal interphalangeal (DIP) joint of the 3rd digit]. Feathers were trimmed around the hip and knee to reduce marker movement and occlusion and wings were restrained in a folded position with a soft bandage, with wing feathers trimmed, to enable the proximal joints to be seen. It was not possible to verify the effects of wing restraint on the kinematics of the pelvic limb as the proximal joints could not be appropriately identified without moving the wing. However, for a given Froude number the basic stride parameters of stride length and stride frequency of the adult birds were comparable with data collected during free straight running without markers or restraints along a fenced runway.
Kinematic data files were tracked manually (Qualysis Track Manager, Qualysis Inc.) and resulting coordinate data were filtered, with a second-order low-pass Butterworth filter (20Hz cut-off frequency), and processed using custom written scripts in Matlab (The Mathworks Inc., Natick, MA, USA). Motion files were analysed where all pelvic limb markers were visible for at least one full stride over the force plate. The kinematic data were used to determine gait parameters, including stride length, stride frequency, protraction time, stance time, duty factor, joint angles and leg length. Individual strides before and after the force plate were determined from the trajectory of the distal interphalangeal marker on the left foot such that the foot was defined as in contact with the ground when the distal interphalangeal marker was less than 20mm above the level of ground markers and moved less than 1mm in the frontal plane. This definition of foot contact corresponded well with the vertical force output defining loading through the foot on the force plate.
For each stride, stance time, protraction time, stride frequency and duty factor were determined. Data were only included in the analysis where duty factor was less than 0.5 (duty factor range 0.3–0.5), to ensure comparison of equivalent gait. The instantaneous forward running velocity was calculated from the body marker using a fourth-order central difference equation (Biewener and Full, 1992). Stride length was calculated from the mean forward velocity of the ostrich divided by the stride frequency. Data where birds were accelerating or decelerating were excluded from the analysis and birds were considered to be locomoting at a steady speed when velocity, V, did not change by more than 10% during the trial. In order to enable comparison of gait parameters at similar relative speeds for birds of different sizes the dimensionless speed, or Froude number, Fr, was also calculated according to standing hip height (Alexander and Jayes, 1983), such that:
Fr V2/ gh,
where gis the acceleration due to gravity and his the hip height. Stride lengths and stride frequencies were also normalised for leg lengths by calculating the relative stride length (RSL: stride length/h) and relative stride frequency [RSF: stride frequency ⫻
冑(hg–1)]. Hip angle was calculated relative to the horizontal (due to the difficulty defining the plane of the body segment with this experimental set-up) using trigonometry. The remaining joint angles were calculated from vectors defining orientation of adjoining segments {cos–1[(v
1⫻v2)/ⱍv1ⱍ⫻ⱍv2ⱍ], where v1 is the vector of the proximal segment and v2 is the vector of the distal segment}. The measured angles were those used functionally, defined at the cranial aspects of the hip and ankle joints and the caudal aspects of the knee and metatarsophalangeal joints (Smith et al., 2007).
with initial leg length, L0, determined from this measurement at initial foot contact. Ground reaction forces in three orthogonal directions, defining vertical, medio-lateral and cranio-caudal force (in the direction of motion), were vector summed to obtain the magnitude and line of action of the resultant ground reaction force. The stance phase was then assumed to fit the spring–mass model (Blickhan, 1989), which has been shown to accurately describe the stance phase characteristics of running gait in many species, both bipedal and quadrupedal (Alexander, 1991; Blickhan, 1989; Bullimore and Burn, 2007; Farley et al., 1993; Robilliard, 2006). This assumes the contact limb is a spring of constant stiffness, k, and initial length, supporting the body mass. For repeatability, the vertical motion of the centre of mass was modelled from the hip joint marker, because previous studies of the running gaits of bird species have suggested that trunk rotations are small (Gatesy, 1999; Rubenson et al., 2007). The vertical excursion of the hip, ⌬Z, was therefore calculated from the difference between the hip height from the ground at foot on and the minimum hip height. The sweep angle, s, defining the angle through which the spring rotates during stance, was calculated from the mean velocity, the stance time, T, and the initial leg (spring) length [ssin–1(V⫻T/2⫻L0)], as defined by the spring–mass model. Calculation of sweep angle was validated against that measured from protraction and retraction angles of the limb from kinematics, with mean values in agreement to within one degree. The leg length change, ⌬L, was then calculated from the sweep angle and the vertical displacement. The overall limb stiffness, kleg, was calculated from the peak resultant GRF and leg length change, and effective vertical stiffness, kvert, enabled description of the vertical motions of the centre of mass (Farley et al., 1993), although not representative of an actual spring in the model, and was calculated from the peak vertical force and vertical excursion.
Relationships between gait parameters and body mass were calculated and compared with published scaling relationships seen between species. Allometric equations were calculated by log10 -transforming the data and then using a linear regression to define scaling relationships in the form of ybMba [variable, y; proportionality coefficient, b; scaling exponent (defining slope of the regression line), a], consistent with other scaling studies (Irschick and Jayne, 2000; Iriarte-Diaz, 2002) and appropriate for the distribution of the data, high correlation and analysis of residuals. Linear regression analysis of the log-transformed data was carried out in order to determine the coefficient of the logarithmic plot, equal to the scaling exponent, the standard error (s.e.) of the exponent (slope) and the 95% confidence interval. Differences from geometric scaling were identified when 0.33 was not included in the 95% confidence interval of the regression coefficient, and significant scaling with body mass was concluded when the 95% confidence interval did not include zero. Differences between scaling exponents were ascertained by no overlap between the coefficients ±s.e., because when comparing between two coefficients with similar variance, overlap of the two 95% confidence intervals has been shown to be insensitive, giving very conservative results (Payton et al., 2003). Data were also combined into 11 mass groups in 10kg steps from 5kg to 105kg to enable comparison of dependent variables between groups using a univariate general linear model with group mass as a fixed factor and Froude number as a covariate. Bird number (defining each individual) was also added as a random factor but the effects were small with no consistent trend of differences between specific birds for the variables analysed and no significant effect on the results of the model. Therefore, bird number was not included in the final analysis. All variables were
analysed for the running speed range observed, correcting for effects of relative speed.
RESULTS
Scaling of height and segment lengths
Ostrich mass during the study ranged from 0.7kg, for the smallest bird at two weeks old to 108.8kg for the largest bird at 10 months old. Mean bird mass and growth trends were consistent with studies of farmed birds (Cooper, 2005). Growth rates between birds varied (Fig.1A); however, regardless of growth rate all birds maintained a similar scaling relationship of hip height with mass (⬀Mb0.40, Fig.1B) up to the hip height of 1.2m, after which there was found to be little increase in hip height with increasing body mass. All segment lengths increased with increasing mass and hip height but showed differing scaling exponents, with the foot and tarsometatarsus showing greater positive allometry (⬀Mb0.40 and
⬀Mb0.41, respectively) with body mass than the femur and tibiotarsus (⬀Mb0.37 and ⬀Mb0.38, respectively). Scaling exponents calculated from linear regression of logarithmic data are shown in Table1, including upper and lower confidence intervals.
Scaling of kinematic parameters
Self-selected speeds of the ostriches varied between 1.1m s–1and 4.7m s–1, with a mean speed of 3.07±0.61m s–1(±s.d.) equating to Froude numbers between 0.3 and 4.2 (mean: 1.20±0.51). Data were analysed over a body mass range of 2.6–108.8kg for running trials, defined by a duty factor of less than 0.5 to ensure all running gait for consistency. Force data were included where a single left foot contact occurred on the force plate. As a result, 839 strides were used in the kinematic analysis and 487 strides were used in the kinetic analysis. As rates of growth varied, resulting in different sized birds at each time point, all birds did not contribute equally
R2=0.98 y=0.40x–0.67
–0.6 –0.5 –0.4 –0.3 –0.2 –0.1 0 0.1 0.2
0.4
0 0.8 1.2 2.0
log (Mass)
log (Hip height)
0 20 40 60 80
2 4 6 8 10 12 14 16 18 20 22 24 26 Age (weeks)
M
ass
(kg)
A
B
1.6 14
15 11 12 13
1 2
3
4 5 6 7
8
9 10
throughout the size range studied, particularly for the larger body masses.
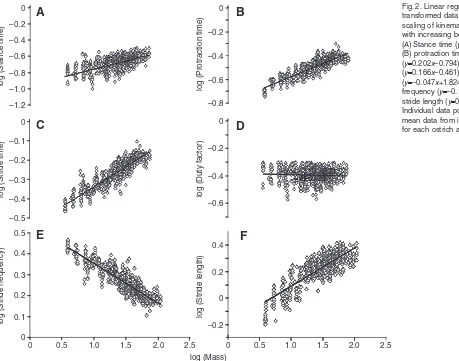
Logarithmic plots of kinematic variables with increasing body mass are shown in Fig.2. All data were analysed taking account of effects of Froude number in the regression analyses and the general linear models, in which group means were estimated at a representative Froude number of 1.23 (the mean value for the data analysed in the model) to give an indication of parameters at a specific relative running speed, where parameters showed significant relationships with Froude number. Stance times for the mass groups varied from 0.18s for group mass 5kg to 0.28s for group mass 105kg at equivalent speeds (Froude number 1.23) while protraction time increased from a mean of 0.24s for group mass 5kg to 0.37s for group mass 105kg. From linear regression analysis of the log-transformed data, stance time, protraction time and stride time were all found to positively scale with increasing body mass for a given relative speed. Results of the regression analysis are shown in
[image:4.612.44.569.81.150.2]Table2. The increase in protraction time with body mass (⬀Mb0.20) was shown to be greater than the increase in stance time (⬀Mb0.12), both of which contributed to increased stride time (⬀Mb0.17). The greater increase in stride time compared with stance time also resulted in a slight decrease of duty factor with body mass, ⬀Mb–0.05. However, when analysed between mass groups, differences in duty factor (mean: 0.41±0.04) were only significant between the smallest birds (5–25kg) and the mid-sized birds (35–75kg), with no significant differences between the smallest and largest mass groups. Mean stride frequency for the mass groups decreased from 2.38Hz (5kg) to 1.56Hz (105kg) at the same relative speed and similarly stride length increased, from an average 0.97m (5kg) to 2.34m (105kg) at a Froude number of 1.23. The scaling relationship of stride frequency therefore decreased with body mass, ⬀Mb–0.17, whilst stride length showed positive allometry, ⬀Mb0.37. However, when normalised for leg length in RSF and RSL changes with body size were small, such that mean (±s.d.) RSF for all groups was 0.54 Table 1. Scaling of body length measurements with increasing body mass, Mb, for regressions of the form: yalogx+logb (ybxa)
Scaling exponent (a) Lower 95% confidence interval Upper 95% confidence interval Constant (log b) R2
Hip height 0.403* 0.393 0.413 –0.674 0.98
Femur length 0.374* 0.360 0.388 –1.259 0.96
Tibiotarsus length 0.382* 0.372 0.392 –0.983 0.98
Tarsometatarsus length 0.407* 0.393 0.420 –1.177 0.97
Foot length 0.403* 0.381 0.417 –1.463 0.94
*Significantly different from geometric scaling (0.33).
–1.2 –1.0 –0.8 –0.6 –0.4 –0.2 0
log (
S
t
a
nce time)
–0.8 –0.6 –0.4 –0.2 0
log (Protr
a
ction time)
A
B
–0.4
–0.5 –0.3 –0.2 –0.1 0
log (
S
tr
ide time) y = -0.0084x -0.3821 R2 = 0.0028
–0.6 –0.4 –0.2 0
log (D
u
ty f
a
ctor)
C
D
0 0.1 0.2 0.3 0.4 0.5
1.0 1.5
0 0.5 2.0
log (Mass)
log (
S
tr
ide freq
u
ency)
0 0.5 1.0 1.5 2.0 2.5
log (
S
tr
ide length)
E
F
2.5
y = 0.38- 21 R2 = 0.0028
–0.2 0 0.2 0.4
Fig.2. Linear regression of log-transformed data describing scaling of kinematic parameters with increasing body mass. (A)Stance time (y0.120x–0.709); (B) protraction time
[image:4.612.51.510.384.745.2](±0.04) and mean RSL was 1.99 (±0.06). The small differences observed through growth resulted in negligible scaling of RSF and RSL with body mass, ⬀Mb0.029and ⬀Mb–0.023, respectively.
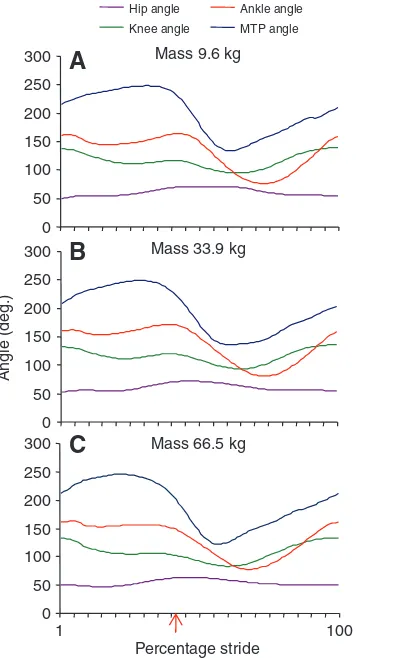
Pelvic limb joint angles throughout a running stride did not vary significantly with increasing body size between groups at the same relative speeds. Maximum and minimum angles at each joint, defining extension and flexion, respectively, are given in Table3, and joint angles through a stride are illustrated in Fig.3, with representative plots from a single bird at three different time points during growth. The greatest range of motion was observed at the MTP joint, where the loading of the digit extended the joint to a maximum angle of 239.9deg. (±5.6deg.) during foot contact and protraction of the limb flexed the joint to 122.2deg. (±9.0deg.), resulting in a mean range of motion of 117.6 (±9.2deg.). The measured joint angles largely defined flexion and extension of the joints, such that out of plane movement at the joints was not considered, due to the limited marker set used. However, previous studies of ostrich locomotion have identified this sagittal plane motion as the predominant plane of movement during straight running (Rubenson et al., 2005).
Scaling of limb stiffness
Results from the spring–mass model were also analysed with respect to increasing body mass using a regression analysis of the log-transformed data. The resulting scaling exponents, confidence intervals and R2values are shown in Table4 whereas mean data for each of the mass groups are shown in Fig.4. The ground reaction force traces were consistent with those observed in other running species and did not vary during growth. When the effect of Froude number was accounted for, peak resultant ground reaction force scaled directly proportional to body mass (Mb1.0). Body-mass-specific force showed no significant differences between any of the groups with a mean value (±s.d.) for all groups of 2.18 (±0.12) times body weight at a Froude number of 1.4.
Leg length at foot on (initial leg length) increased with body mass proportional to Mb0.40, resulting in an increase from 0.50m to 1.35m from the smallest to the largest mass group. Leg length change and vertical height change during stance both showed a similar increase with size, ⬀Mb0.41and ⬀Mb0.42, respectively. Both leg length change and vertical height change showed significant differences between
[image:5.612.45.567.79.186.2]all groups up to group mass 65kg, above which the larger groups were not significantly different from each other. However, when these measurements were considered relative to initial leg length Table 2. Kinematic scaling exponents with increasing body mass, Mb, for regressions of the form: yalogMb+logb(ybMba)
Scaling exponent (a) Lower 95% confidence interval Upper 95% confidence interval Constant (log b) R2
Stance time 0.120 0.109 0.130 –0.709 0.74
Swing time 0.202 0.194 0.211 –0.794 0.75
Stride time 0.166 0.161 0.172 –0.461 0.87
Duty factor –0.047 –0.056 –0.038 1.824 0.38
Stride frequency –0.166 –0.172 –0.161 0.461 0.87
Stride length 0.368 0.360 0.377 –0.462 0.90
Step length 0.321 0.310 0.333 –0.710 0.79
Relative stride frequency 0.029 0.024 0.035 –0.353 0.33
[image:5.612.55.568.216.274.2]Relative stride length –0.023 –0.031 –0.016 0.175 0.84
Table 3. Pelvic limb joint angles observed during slow running across the body size range studied (means ± s.d.)
Maximum (extension) angle (deg.) Minimum (flexion) angle (deg.) Range of motion (deg.)
Hip angle 66.7±5.4 49.5±5.6 17.0±2.8
Knee angle 135.4±3.6 88.6±4.9 46.8±4.3
Ankle angle 164.0±2.7 75.3±6.1 88.7±6.2
MTP angle 239.9±5.6 122.2±9.0 117.6±9.2
MTP, metatarsophalangeal.
Mass 9.6 kg
0 50 100 150 200 250 300
Mass33.9 kg
0 50 100 150 200 250 300
Angle (deg.)
Hip angle Knee angle
Ankle angle MTP angle
Mass 66.5 kg
0 50 100 150 200 250 300
1 100
Percentage stride
A
B
C
[image:5.612.358.562.356.685.2]and initial hip height as percentages, these differences were accounted for in all mass groups. The sweep angle calculated for the model showed no significant scaling with increasing body mass and therefore the limb stiffness and effective vertical stiffness showed similar increases with body mass, proportional to Mb0.59 and Mb0.58, respectively. Limb stiffness increased from a mean of 5.1(±1.1)kNm–1for the 5kg group to 23.8(±2.8)kNm–1for the 95kg group and showed significant increases across all the mass groups up to 85kg, with effective vertical stiffness showing greater values but in a parallel relationship.
DISCUSSION
The pelvic limb segment lengths and hip height were measured in 15 ostriches from two weeks of age up to 10 months in order to establish the scaling relationship between segment lengths and body mass. Body mass increased at different rates in the individual ostriches (Fig.1A) but regardless of the rate at which the ostriches increased height and weight, the relationship between hip height
[image:6.612.48.569.79.166.2]and body mass was similar between all birds, with hip height proportional to body mass, Mb0.40, significantly different (P<0.05) from the scaling exponent of 0.33 defining geometric similarity. This is in agreement with species such as emu, jack rabbits, gulls and muskox (Carrier, 1983; Carrier and Leon, 1990; Heinrich et al., 1999; Main and Biewener 2007) but different to ontogenetic scaling of lizards and elephants (Irschick and Jayne, 2000; Miller et al., 2008). Whilst this difference from isometric scaling could potentially be accounted for by changes in limb posture, since the hip height measures the length between the floor and the hip and takes no account of the positioning of the limb, this is shown not to be the case from 3-D kinematic data, which demonstrate no significant postural changes in the pelvic limb during growth, consistent with previous studies of another ratite, the emu (Main and Biewener, 2007). There were found to be small proximo-distal differences in scaling exponents of the limb segments, with those of the foot and tarsometatarsus (⬀Mb0.40and ⬀Mb0.41, respectively) slightly greater than those of the femur and tibiotarsus (⬀Mb0.37 and ⬀Mb0.38,
Table 4. Scaling exponents of kinetic variables with increasing body mass, Mb, for regressions of the form: yalogMb+logb(ybMba)
Scaling exponent (a) Lower 95% confidence interval Upper 95% confidence interval Constant (log b) R2
Ground reaction force 0.997 0.979 1.015 1.296 0.97
Initial leg length, L0 0.399 0.393 0.404 –0.623 0.98
Leg length change, ⌬L 0.409 0.391 0.427 –1.836 0.83
Height change, ⌬Z 0.415 0.389 0.440 –1.950 0.75
Sweep angle, s 0.005* –0.004 0.015 1.584 0.35
Limb stiffness, kleg 0.588 0.583 0.614 3.132 0.82
Vertical stiffness, kvert 0.580 0.550 0.611 3.247 0.75
*Coefficient not significant (P>0.1), all other coefficients are significant (P<0.001).
0 5 10 15 20 25 30
5 15 2535 45 55 65 7585 95 5 15 2535 45 55 65 7585 95 Mass (kg)
S
tiffne
ss
(kN m
–1
)
E
0 5 10 15 20 25 30 35 40
V
er
tic
a
l
s
tiffne
ss
(kN m
–1
)
F
00.02 0.04 0.06 0.08 0.10 0.12
5 15 2535 45 55 65 7585 95
Leg length ch
a
nge (m)
C
0 0.02 0.04 0.06 0.08 0.10
5 15 2535 45 55 65 7585 95
Height ch
a
nge (m)
D
5 15 2535 45 55 65 7585 950 500 1000 1500 2000 2500
GRF (N)
A
5 15 2535 45 55 65 7585 95
Leg length (m)
B
0 0.2 0.4 0.6 0.8 1.0 1.2 1.4
1.6 Fig.4. Effect of body mass during growth on kinetic
parameters of running ostriches; (A) peak resultant ground reaction force (GRF), (B) initial leg length, L0, (C) leg length
[image:6.612.47.352.410.742.2]respectively), suggesting the distal segments increased more in length with size than the proximal segments. However, it must be considered that the scaling of the foot segment may not be a true representation of scaling segment length as the measurement was defined by a straight line between the distal interphalangeal joint and the metatarsophalangeal joint, which did not take account of the specific morphology of the segment. The linear regression for the log-transformed data for the foot segment also showed the greatest deviation from a straight line relationship at the extremes of body size measured, which may be a result of differential scaling posture or indicative of the induced error described above.
The scaling exponents for the hip height and limb bones of the ostrich during growth are larger than those observed for bone length between species, which are between 0.31 and 0.35 (Alexander et al., 1979; Biewener, 1983; Olmos et al., 1996), but the range of exponents reported may be indicative of the dependency of the relationship on the species included or the quality of the data set over the entire size range analysed. The positive allometry of bone length scaling with growth is in agreement with scaling from ontogenetic studies for a range of species, including both mammals and birds (Carrier, 1983; Carrier and Leon, 1990; Heinrich et al., 1999; Main and Biewener, 2007), and supports rejection of the null hypothesis. However, some species have been shown to demonstrate negative allometry of segment lengths during growth (Irschick and Jayne, 2000; Miller et al., 2008), more in keeping with the ontogenetic relationships observed for cross-sectional area (Main and Biewener, 2004; Main, 2007). The ontogenetic pressures on those species, including the ostrich, that exhibit positive allometric scaling of limb bones are likely to be very different from those species exhibiting negative allometry, such as the lizard and elephant. These requirements include a shorter timescale to adult stature and athletic performance and differing locomotor requirements in terms of gait patterns and pressures of the predator–prey relationship.
Temporal variables of stance time, protraction time and stride time were all shown to increase with increasing body mass at equivalent speeds, resulting in an increase in stride length and a decrease in stride frequency. At similar relative speeds, stride length showed positive allometry (⬀Mb0.37), with similar but slightly lower scaling than that of hip height. The increase in stride length with increasing body mass resulted in a greater angle through which the limb must be protracted for the following stride, the time for which would also be affected by the increased limb inertia, contributing to the increase in protraction time. A comparable increase in stance time is required in order to maintain similar duty factor and hence peak limb forces; therefore, the marginally lesser increase in stance time than protraction time across the size range accounts for the slight, but statistically significant, decrease in duty factor observed, proportional to Mb–0.05. In order to travel at an equivalent speed with their increased stride length, larger birds show a reduced stride frequency (⬀Mb–0.17), as is necessary to swing the increased limb mass through the greater distance and it is energetically expensive to swing a leg faster than its pendular period (Kuo, 2001). Even so, there appears to be a limit for these differences in the growth of the ostrich at over 60kg (group mass 65kg), beyond which increases in stride length or stride frequency are not apparent, despite a further 40kg increase in body mass. This suggests there may be a fundamental constraint in limb swing frequency at a specific relative speed above 60kg body mass when the birds approach their adult height, although it would be useful to investigate this trend at faster running speeds.
When the stride frequency and length parameters were normalised for body size to relative values, taking account of limb length and limb oscillation properties, the differences observed were largely accounted for, resulting in small scaling exponents of 0.029 for relative stride frequency and –0.023 for relative stride length. However, significant differences were still apparent for both of these variables between the smallest mass groups (5kg and 15kg) and all larger mass groups, suggesting the small birds run with a lower relative stride frequency and a higher relative stride length than larger birds at similar Froude number. Similar trends for stride length and stride frequency with increasing body mass have been found to exist between bipedal species, with scaling exponents of 0.38 and –0.17, respectively, found to exist for these parameters at an equivalent speed (maximum treadmill speed) (Gatesy and Biewener, 1991). Despite the large increase in stride length and decrease in stride frequency with body size, Gatesy and Biewener also noted that although comparable values of relative stride length and relative stride frequency occurred across the size range, smaller species tended to have a lower relative frequency and higher relative length than the larger species (Gatesy and Biewener, 1991). This trend was also observed in a study of the effect of limb length on bipeds and quadrupeds across a large size range (Hoyt et al., 2000).
in this, and other, species may be directly related to the dynamic biomechanical requirements.
Behaviour of the limb during loading in the stance phase was investigated by applying a spring–mass model template to the experimental data. There are a number of assumptions for this model, including that the vertical force applied is a fixed fraction of a sine curve, the spring is massless and undamped and the mass is a point mass at the top of the spring. Although these requirements over-simplify the biological system observed due to the complexity of the musculoskeletal system, it has been shown to accurately predict the mechanics of running for both bipedal and quadrupedal locomotion (Alexander, 1992; Blickhan, 1989; Farley et al., 1993; Full and Blickhan, 1992; McGeer, 1990; McMahon, 1985). In this study, the model appeared to be valid because the limb loading trace was close to the half sine wave predicted by the spring–mass model, and leg lengths and hip heights also changed in a sinusoidal fashion during compression of the limb.
The peak resultant GRF scaled directly proportional to body mass, resulting in equivalent force in body weights throughout growth at a similar relative speed consistent with ontogenetic data for the emu and the goat (Main and Biewener, 2006; Main and Biewener, 2007). Compression of the limb during loading resulted in change in hip height, representative of change in height of centre of mass, and causing a comparable leg length change. Both leg length change and vertical height change therefore scaled in a similar way, proportional to Mb0.41 and Mb0.42, respectively. However, the estimate of centre of mass motion from the movement of the hip marker does not take account of rotations of the trunk that may occur around the centre of mass with each stride (McGowan et al., 2005) and consequently vertical height change may overestimate centre of mass motion. Previous studies have suggested such trunk rotations are small in the ostrich (Rubenson et al., 2007) and this assumption is consistent throughout the measurements so that any resulting error could be expected to be similar throughout the study for similar gait patterns; hence, having a minimal effect on the scaling relationship observed.
The positive allometry of leg length and height changes, combined with forces scaling proportional to body mass resulted in limb stiffness and vertical stiffness scaling proportional to Mb0.59 and
Mb0.58, respectively, showing a large increase in stiffness with body mass. However, the increase in stiffness is significantly less than that predicted by dynamic similarity, ⬀Mb0.67, which has been found to apply to increases in limb stiffness between mammalian species across a large size range (Farley et al., 1993). This difference between the scaling of leg stiffness within the ostrich during growth compared with interspecific scaling (also calculated using the spring–mass model) shows that the calculated ostrich limb stiffness during ontogeny does not increase as much with increasing body mass as has been shown for different species of increasing size. The scaling of limb stiffness, however, may be affected by the necessarily simplified way in which the limb stiffness was derived in this study. Movement of the centre of mass was estimated from the position of the hip during running, which does not account for potential lateral body roll during running that may result in reduced fluctuations of the centre of mass compared with that observed at the hip joint. This may result in an underestimate of limb stiffness as calculated by the spring–mass model, which considers centre of mass motion, but because other studies have not identified significant lateral body roll during locomotion in birds (Gatesy, 1999; Rubenson et al., 2007) any such effects are likely to be small. The absolute values of limb stiffness calculated for the large ostriches are consistent with values of limb stiffness shown for mammalian species of a similar body
mass (Farley et al., 1993), suggesting that the effects of the assumptions made for centre of mass motion are small and that the difference observed in scaling of limb stiffness during ostrich growth result from the ontogenetic trends discussed.
Other variables of the spring–mass model, applied during growth in the ostrich, closely agree with those found with increasing size between species and those expected for dynamically similar motion. The limb compression relative to initial limb length, angle swept by the limb and ratio of peak force to body weight, were all found to be independent of body mass. In addition the scaling of stance time, ⬀Mb0.19, is identical to that found by Farley et al. (Farley et al., 1993) between species, which demonstrated dynamically similar spring–mass behaviour. The deviation of limb stiffness from dynamic similarity is therefore likely to be related to the only other differences observed, which again relates to the scaling of limb length and hip height. As the peak leg length change as a proportion of leg length is independent of body size, the limb compression scales with limb length and hip height and as the scaling of these lengths is greater during growth than between species, the limb compression increases more with increasing body size. Coupled with maintenance of body weight specific force, this results in a smaller increase of limb stiffness and effective vertical stiffness in large birds. Although values for limb stiffness for all birds in this study fall within the range of limb stiffness determined for mammalian species across a similar size range, the limb stiffness for the smaller birds appears disproportionately high for their body mass. As interspecific differences in limb stiffness are representative of functional adaptation and ontogenetic trends suggest developmental constraints cannot allow for compromise, young ostriches cannot start with very compliant legs and still achieve the optimum limb stiffness for the adult state in the time required. This may have implications in terms of safety factors of bone, muscle and tendon, which conventional scaling relationships have been shown to conserve and also by virtue of the observed changes to the limb compliance, alterations in passive elastic energy return may be expected, affecting locomotor efficiency. The stiffness scaling relationship observed is achievable by higher limb stiffness in smaller birds, enabling the limb stiffness of adult birds to be closer to that expected from conventional scaling, but the implications of this in terms of the effects on the musculoskeletal system warrant further investigation.
CONCLUSION
as a proportion of leg length, consistent with dynamic similarity and scaling observed between species with increasing size. However, the increased scaling of the limb resulted in the actual length change of the limb showing a greater increase with size and hence a smaller increase of limb stiffness with size than that expected for dynamic similarity, achieved by higher stiffness of the limbs of smaller ostriches.
The similarities between dynamic ontogenetic scaling and scaling observed due to phylogenetic size differences were found to be achievable by differing mechanisms. The size-related alterations observed between species have been found to enable preservation of musculoskeletal stress and strain within similar safety factors. The lack of compensatory postural adaptation may, therefore, be expected to result in changes to stresses, and hence safety factors of some elements of the musculoskeletal system of the ostrich during growth.
ACKNOWLEDGEMENTS
We would like to thank Andrew Spence from the Royal Veterinary College for his helpful comments on the manuscript. This work was funded by the BBSRC. N.C.S. was funded by a Royal Veterinary College studentship. A.M.W. is a Royal Society Wolfson Research Merit Award holder.
REFERENCES
Abourachid, A.(2001). Kinematic parameters of terrestrial locomotion in cursorial (ratites), swimming (ducks), and striding birds (quail and guinea fowl). Comp. Biochem. Physiol. A131, 113-119.
Alexander, R. M.(1991). Energy-saving mechanisms in walking and running. J. Exp. Biol. 160, 55-69.
Alexander, R. M.(1992). A model of bipedal locomotion on compliant legs. Philos. Trans. R. Soc. Lond., B, Biol. Sci.338, 189-198.
Alexander, R. M. and Jayes, A. S.(1983). A dynamic similarity hypothesis for the gaits of quadrupedal mammals. J. Zool. Lond.201, 135-152.
Alexander, R. M., Jayes, A. S., Maloiy, G. M. and Wathuta, E. M.(1979). Allometry of the limb bones of mammals from shrews (Sorex) to elephant (Loxodonta). J. Zool. Lond.183, 291-300.
Alexander, R. M., Jayes, A. S., Maloiy, G. M. O. and Wathuta, E. M.(1981). Allometry of the leg muscles of mammals. J. Zool.194, 539-552.
Biewener, A. A.(1982). Bone strength in small mammals and bipedal birds: do safety factors change with body size? J. Exp. Biol. 98, 289-301.
Biewener, A. A.(1983). Allometry of quadrupedal locomotion: the scaling of duty factor, bone curvature and limb orientation to body size. J. Exp. Biol. 105, 147-171. Biewener, A. A.(1989). Scaling body support in mammals: limb posture and muscle
mechanics. Science245, 45-48.
Biewener, A. A. and Full, R. J.(1992). Force platform and kinematic analysis. In Biomechanics: A Practical Approach (ed. A. A. Biewener), pp. 45-73. New York: Oxford University Press.
Blickhan, R.(1989). The spring mass model for running and hopping. J. Biomech.22, 1217-1227.
Bullimore, S. R. and Burn, J. F.(2006). Dynamically similar locomotion in horses. J. Exp. Biol. 209, 455-465.
Bullimore S. R. and Burn J. F.(2007) Ability of the planar spring–mass model to predict mechanical parameters in running humans. J. Theor. Biol.248, 686-695. Carrier, D. R.(1983). Postnatal ontogeny of the musculoskeletal system in the
Black-tailed jack rabbit (Lepus californicus). J. Zool. Lond201, 27-55.
Carrier, D. R. and Leon, L. R.(1990). Skeletal growth and function in the California gull (Larus californicus). J. Zool.222, 375-389.
Christiansen, P.(2002). Mass allometry of the appendicular skeleton in terrestrial mammals. J. Morphol.251, 195-209.
Cooper, R. G.(2005). Growth in the ostrich (Struthio camelus var. Domesticus). Anim. Sci. J. 76, 1-4.
Dickinson, M. H., Farley, C. T., Full, R. J., Koehl, M. A. R., Kram, R. and Lehman, S.(2000). How animals move: an integrative view. Science288, 100-106. Farley, C. T., Glasheen, J. and McMahon, T. A.(1993). Running springs: speed and
animal size. J. Exp. Biol. 185, 71-86.
Full, R. J. and Blickhan, R.(1992). Generality of spring mass model in predicting the dynamics of many-legged terrestrial locomotion. Physiologist35, 185.
Gatesy, S. M.(1999). Guineafowl hind limb function I: cineradiographic analysis and speed effects. J. Morphol.240, 115-125.
Gatesy, S. M. and Biewener, A. A.(1991). Bipedal locomotion: effects of speed, size and limb posture in birds and humans. J. Zool.224, 127-147.
Heglund, N. C. and Taylor, C. R.(1988). Speed, stride frequency and energy cost per stride: how do they change with body size and gait? J. Exp. Biol. 138, 301-318. Heglund, N. C., Taylor, C. R. and McMahon, T. A.(1974). Scaling stride frequency
and gait to animal size: mice to horses. Science186, 1112-1113.
Heinrich, R. E., Ruff, C. B. and Adamczewski, J. Z.(1999). Ontogenetic changes in mineralization and bone geometry in the femur of muskoxen (Ovibos moschatus). J. Zool. 247, 215-223.
Hildebrand, M. and Hurley, J. P.(1985). Energy of the oscillating legs of a fast-moving cheetah, pronghorn, jackrabbit, and elephant. J. Morphol.184, 23-31. Hoyt, D. F., Wickler, S. J. and Cogger, E. A.(2000). Time of contact and step length:
the effect of limb length, running speed, load carrying and incline. J. Exp. Biol. 203, 221-227.
Iriarte-Diaz, J.(2002). Differential scaling of locomotor performance in small and large terrestrial mammals. J. Exp. Biol.205, 2897-2908.
Irschick, D. J. and Jayne, B. C.(2000). Size matters: ontogenetic variation in the three-dimensional kinematics of steady speed locomotion in the lizard Dipsosaurus dorsalis. J. Exp. Biol.203, 2133-2148.
Kuo, A. D.(2001). A simple model of bipedal walking predicts the preferred speed-step length relationship. J. Biomech. Eng.123, 264-269.
Main, R. P.(2007). Ontogenetic relationships between in vivo strain environment, bone histomorphometry and growth in the goat radius. J. Anat.210, 272-293.
Main, R. P. and Biewener, A. A.(2004). Ontogenetic patterns of limb loading, in vivo bone strains and growth in the goat radius. J. Exp. Biol. 207, 2577-2588. Main, R. P. and Biewener, A. A.(2006). In vivo bone strain and ontogenetic growth
patterns in relation to life-history strategies and performance in two vertebrate taxa: goats and emu. Physiol. Biochem. Zool. 79, 57-72.
Main, R. P. and Biewener, A. A.(2007). Skeletal strain patterns and growth in the emu hindlimb during ontogeny.J. Exp. Biol. 210, 2676-2690.
Maloiy, G. M., Alexander, R. M., Njau, R. and Jayes, A. S.(1979). Allometry of the legs of running birds. J. Zool. Lond. 187, 161-167.
McGeer, T.(1990). Passive bipedal running. Proc. R. Soc. Lond., B, Biol. Sci.240, 107-134.
McGowan, C. P., Baudinette, R. V. and Biewener, A. A.(2005). Joint work and power associated with acceleration and deceleration in tammar wallabies (Macropus eugenii). J. Exp. Biol. 208, 41-53.
McMahon, T. A.(1985). The role of compliance in mammalian running gaits. J. Exp. Biol. 115, 263-282.
Miller, C. E., Basu, C., Fritsch, G., Hildebrandt, T. and Hutchinson, J. R.(2008). Ontogenetic scaling of foot musculoskeletal anatomy in elephants. J. R. Soc. Interface5, 465-475.
Olmos, M., Casinos, A. and Cubo, J.(1996). Limb allometry in birds. Annales des Sciences naturelles, Zoologie, Paris17, 39-49.
Payton, M. E., Greenstone, M. H. and Schenker, N.(2003). Overlapping confidence intervals or standard error intervals: what do they mean in terms of statistical significance. J. Insect Sci. 3, 34.
Pollock, C. M. and Shadwick, R. E.(1994). Relationship between body mass and biomechanical properties of limb tendons in adult mammals. Am J. Physiol. Regul. Integr. Comp. Physiol.266, R1016-R1021.
Robilliard, J. J.(2006). Mechanical basis of locomotion with spring-like legs. PhD thesis, The Royal Veterinary College, University of London.
Rubenson, J., Besier, T. F., Lloyd, D. and Fournier, P.(2005). Three-dimensional joint kinematics and kinetics during bipedal running: effect of limb posture. Comp. Biochem. Physiol. A 141, S146.
Rubenson, J., Lloyd, D. G., Besier, T. F., Heliams, D. B. and Fournier, P. A. (2007). Running in ostriches (Struthio camelus): three-dimensional joint axes alignment and joint kinematics. J. Exp. Biol. 210, 2548-2562.
Smith, N. C., Payne, R. C., Jespers, K. J. and Wilson, A. M.(2007). Muscle moment arms of pelvic limb muscles of the ostrich (Struthio camelus). J. Anat. 211, 313-324.

![Diethyl 4,8 dioxo 2,6 diphenyl 1,3,5,7 tetrahydro 2,3a,4a,6,7a,8a hexaazacyclopenta[def]fluorene 8b,8c dicarboxylate](data:image/gif;base64,R0lGODlhAQABAIAAAP///wAAACH5BAEAAAAALAAAAAABAAEAAAICRAEAOw==)