ORIGINAL RESEARCH
Assessing Disease Severity in Late Infantile
Neuronal Ceroid Lipofuscinosis Using Quantitative
MR Diffusion-Weighted Imaging
J.P. Dyke H.U. Voss D. Sondhi N.R. Hackett S. Worgall L.A. Heier B.E. Kosofsky A.M. Ulug˘ D.C. Shungu X. Mao R.G. Crystal D. Ballon
BACKGROUND AND PURPOSE: Late infantile neuronal ceroid lipofuscinosis (LINCL), a form of Batten disease, is a fatal neurodegenerative genetic disorder, diagnosed via DNA testing, that affects approximately 200 children in the United States at any one time. This study was conducted to evaluate whether quantitative data derived by diffusion-weighted MR imaging (DWI) techniques can supple-ment clinical disability scale information to provide a quantitative estimate of neurodegeneration, as well as disease progression and severity.
MATERIALS AND METHODS:This study prospectively analyzed 32 DWI examinations from 18 patients having confirmed LINCL at various stages of disease. A whole-brain apparent diffusion coefficient (ADC) histogram was fitted with a dual Gaussian function combined with a function designed to model voxels containing a partial volume fraction of brain parenchyma versus CSF. Previously published whole-brain ADC values of age-matched control subjects were compared with those of the LINCL patients. Correlations were tested between the peak ADC of the fitted histogram and patient age, disease severity, and a CNS disability scale adapted for LINCL.
RESULTS: ADC values assigned to brain parenchyma were higher than published ADC values for age-matched control subjects. ADC values between patients and control subjects began to differ at 5 years of age based on 95% confidence intervals. ADC values had a nearly equal correlation with patient age (R2⫽0.71) and disease duration (R2⫽0.68), whereas the correlation with the central nervous system disability scale (R2⫽0.27) was much weaker.
CONCLUSION:This study indicates that brain ADC values acquired using DWI may be used as an independent measure of disease severity and duration in LINCL.
L
ate infantile neuronal ceroid lipofuscinosis (LINCL), a form of Batten disease, is an autosomal recessive lysosomal storage disease that results in neurodegeneration.1 It firstmanifests between the ages of 2– 4 years through seizures fol-lowed by deteriorating motor, cognitive, and visual abilities, traditionally leading to death by ages 8 –12 years.2Definitive diagnosis of LINCL is done via genetic testing for mutations in the CLN2 gene, which results in deficiency of the lysosomal protease tripeptidyl peptidase-I. Absence of this protease leads to lysosomal distension and neuronal death. There are no known treatments for LINCL other than symptom manage-ment. A better understanding of the anatomic distribution of neurodegeneration may permit genetic and cellular therapies to be targeted to appropriate locations in the brain.3
Progression of neuronal degeneration can be assessed by a disability scale based on speech, vision, language, and sei-zures.4To monitor brain-directed therapies, a modified
cen-tral nervous system (CNS) disability score has been estab-lished.1However, these methods are nonspecific in that they
do not implicate specific areas of the brain. Quantitative MR imaging techniques may supplement information provided by
the disability scale and provide a more refined evaluation of neurodegeneration, as well as an opportunity for serial assess-ment of the same patient.
Diffusion-weighted MR imaging (DWI) is a technique that has been shown to detect water diffusion abnormalities in var-ious disease states.5-7Measurement of the apparent diffusion coefficient (ADC) provides a quantitative estimate of the re-strictive nature of the motion of water molecules within tissue for each voxel in a diffusion-weighted image. The ADC is known to decrease with increasing age in normal children as the brain becomes increasingly myelinated and structured.8,9
This study used whole-brain ADC histograms to obtain a mea-sure of the degree of water restriction in the entire brain. The whole-brain histogram was fitted using a dual Gaussian func-tion in addifunc-tion to a partial volume funcfunc-tion. We hypothesized that the global maximum of the model fit characterizing the whole-brain ADC value derived by DWI techniques would supplement clinical disability scale information to provide a quantitative estimate of neurodegeneration, as well as disease progression and severity.
Materials and Methods
Patient Selection
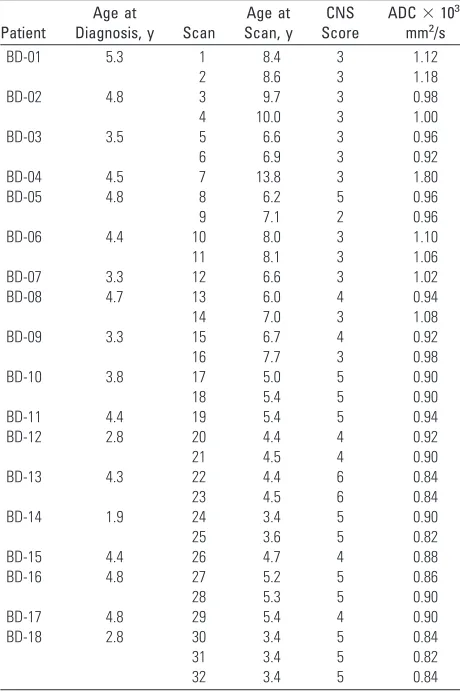
The research protocol was reviewed and approved by the institutional review board at our institution. Eighteen patients presenting with genetically confirmed LINCL (9 boys and 9 girls) of ages 3.4 through 13.8 years participated in this protocol, for a total of 32 DWI exami-nations (Table). The average age at diagnosis for all of the patients was 3.9⫾1.0 years. Disease severity was clinically monitored throughout the study using a modified CNS disability scale.4The visual compo-nent was removed from the scoring system while retaining measures Received October 10, 2006; accepted after revision December 11.
From the Citigroup Biomedical Imaging Center (J.P.D., H.U.V., D.C.S., X.M., D.B.) and the Departments of Radiology (J.P.D., H.U.V., L.A.H., A.M.U., D.C.S., X.M., D.B.), Genetic Medicine (D.S., N.R.H., R.G.C.), and Pediatrics (S.W., B.E.K.), Weill Medical College of Cornell University, New York, NY.
This work was supported by grants 8R01EB002070-09, 5U01NS047458-02, and Nathan’s Battle Foundation, Greenwood, Ind.
Address correspondence to Jonathan P. Dyke, Citigroup Biomedical Imaging Center, Weill Cornell Medical College, Box 234, 1300 York Ave, New York, NY 10021; e-mail: [email protected]
of motor function, seizure activity, and language skills to focus on the neurologic aspects of the disease.1Each of these areas was ranked from 0 to 3 and then summed to provide a total score with 0 being the most severe. At the time of MR imaging, patients presented the fol-lowing CNS disability scores: 2 (n⫽1), 3 (n⫽12), 4 (n⫽6), 5 (n⫽ 11), and 6 (n⫽2).
Clinical MR Imaging Methods
All of the image data were acquired on a 3T MR imaging system (GE Medical Systems, Milwaukee, Wis). Conventional clinical imaging included T1-weighted, T2-weighted, and fluid-attenuated inversion recovery sequences. Next, a spin-echo diffusion-weighted echo-pla-nar imaging sequence was implemented over the entire brain using a section thickness of 5 mm with an FOV of 22 cm, a matrix size of 128⫻128, a TR of 8.2 seconds, a TE of 70 – 80 ms, and 2 averages. Diffusion weighting was acquired using b⫽1000 s/mm2
in 3 orthog-onal directions for a total scan time of 65 seconds.
Analysis Methods
Images were exported to an Optiplex Pentium 4 4.0-GHz PC (Dell, Round Rocker, Texas) and analyzed using the Interactive Data Lan-guage (IDL 6.2; ITT, Boulder, Colo). Images were masked to include voxels having a signal intensity greater than 15% of the maximum value in the DWI series. ADC values were calculated as follows:
1) ADC⫽ ⫺1
bln
冉
S1 S0冊
whereS1represents the signal intensity from the diffusion-weighted image andS0the signal intensity without diffusion weighting (Fig 1).
ADC values were placed in a normalized histogram of unit area. The normalized histogram was fitted with a dual Gaussian distribution function and a partial volume distribution function (Fig 2). These 3 functions were designed to segment the brain, CSF, and brain-CSF partial volume components, respectively. Modeling of these functions was based on arguments given previously8,10but was modified in the following sense: the ADC distribution function was modeled as follows:
2) pADC⫽fbrainpbrain⫹fCSFpCSF⫹共1⫺fbrain⫺fCSF兲pPV,
where
3) pbrain⫽
1
冑
2brainexp
冋
⫺1 2冉
ADC⫺brain
brain
冊
2
册
and
4) pCSF⫽
1
冑
2CSFexp
冋
⫺1 2冉
ADC⫺CSF
CSF
冊
2
册
are the normalized Gaussian functions describing the distribution of ADC values in the brain and CSF, respectively, andf(.)are respective weighting factors. The partial volume distribution function was mod-eled under the assumption that voxels that consist of brain matter and CSF contain both components in all of the possible and equally prob-able fractions, that is:
5) pPV⫽
冕
0
1 1
冑
2共t兲exp冋
⫺ 1 2冉
ADC⫺共t兲
共t兲
冊
2册
dt, where(t)⫽(1⫺t)brain⫹tCSFand2(t)⫽(1⫺t)22brain⫹
t22
CSF. Curve fitting of the 6 parametersbrain,CSF,brain,CSF,
fbrain, andfCSFwas performed within IDL 6.2 using a gradient
expan-sion algorithm to compute a nonlinear least-squares fit to the data. Note that the partial volume function is completely determined by the parameters of the 2 Gaussians. The histogram bin containing the maximum value of the combined fitted function (Equation 2), of the cerebral compartment was used as a measure of the whole-brain ADC value.
A Monte Carlo algorithm was written in IDL 6.2 to verify the functional form of the equations describing the analytical partial vol-ume model. Two standard normally distributed floating point pseu-dorandom number generators,r(.), were used to sample points from Fig 1.A, A diffusion-weighted image (b⫽1000 s/mm2
) and an image acquired without diffusion weighting (B) show enlarged sulci and dilated ventricles consistent with atrophic changes from a representative patient with LINCL.
Whole-brain ADC values for 18 patients with LINCL
Patient
Age at
Diagnosis, y Scan
Age at Scan, y
CNS Score
ADC⫻103, mm2/s BD-01 5.3 1 8.4 3 1.12
2 8.6 3 1.18 BD-02 4.8 3 9.7 3 0.98 4 10.0 3 1.00 BD-03 3.5 5 6.6 3 0.96 6 6.9 3 0.92 BD-04 4.5 7 13.8 3 1.80 BD-05 4.8 8 6.2 5 0.96 9 7.1 2 0.96 BD-06 4.4 10 8.0 3 1.10 11 8.1 3 1.06 BD-07 3.3 12 6.6 3 1.02 BD-08 4.7 13 6.0 4 0.94 14 7.0 3 1.08 BD-09 3.3 15 6.7 4 0.92 16 7.7 3 0.98 BD-10 3.8 17 5.0 5 0.90 18 5.4 5 0.90 BD-11 4.4 19 5.4 5 0.94 BD-12 2.8 20 4.4 4 0.92 21 4.5 4 0.90 BD-13 4.3 22 4.4 6 0.84 23 4.5 6 0.84 BD-14 1.9 24 3.4 5 0.90 25 3.6 5 0.82 BD-15 4.4 26 4.7 4 0.88 BD-16 4.8 27 5.2 5 0.86 28 5.3 5 0.90 BD-17 4.8 29 5.4 4 0.90 BD-18 2.8 30 3.4 5 0.84 31 3.4 5 0.82 32 3.4 5 0.84
Note:—ADC indicates apparent diffusion coefficient; LINCL, late infantile neuronal ceroid lipofuscinosis; CNS, central nervous system.
PEDIATRICS
ORIGINAL
[image:2.585.53.283.58.404.2]the Gaussian distributions (Equations 3 and 4) characterizing the brain and CSF compartments. A uniformly distributed floating point pseudorandom number generator was used to determine the partial volume weighting factors,t. A partial volume voxel was then placed in the histogram according to the following:
6) pPV⫽共1⫺t兲共brain⫹rbrainbrain兲⫹t共CSF⫹rCSFCSF兲,
This process was repeated approximately 200,000 times to get an ad-equate sampling estimate of the functional form of the partial volume
component. The Monte Carlo sampling method was found to pro-duce the same functional form as the analytic solution. In addition, qualitative visual confirmation of gray and white matter, partial vol-ume, and CSF components was obtained using images generated as shown in Fig 3 by displaying only voxels associated with specific ranges of ADC values. In the example of Fig 3, voxels are shown with the following ranges: 1) 1.0⫾0.2⫻10⫺3mm2/s; 2) 1.5⫾0.2⫻10⫺3 mm2/s; 3) 2.0⫾0.2⫻10⫺3mm2/s; 4) 2.5⫾0.2⫻10⫺3mm2/s; 5) 3.0⫾0.2⫻10⫺3mm2/s; and 6) 3.5⫾0.2⫻10⫺3mm2/s.
Previously published ADC values derived from whole-brain his-tograms of age-matched control subjects were used for comparison with the LINCL patients. In that study, data were fitted with a 9-pa-rameter triple-Gaussian model that incorporated components of brain parenchyma, CSF, and a mixing compartment attributed to partial volume averaging.11The mean of the first Gaussian peak char-acterizing brain parenchyma defined the whole-brain ADC value for this method. For the purpose of comparison only, the full dataset of LINCL patients was fitted with the triple-Gaussian model in addition to the partial volume model described in Equation 2.
The method of statistical bootstrapping was used to estimate the error on the maximum of the ADC histogram for 5 DWI patient studies chosen at random from the full dataset.12The histogram con-tained 250 bins of data, which were randomly resampled 100 times with replacement using IDL 6.2. Each of these resampled histograms was fitted with the partial volume model, and the resulting error on the maximum ADC value was calculated. A single-factor analysis of variance (ANOVA) test was used to determine statistically significant variances in the mean ADC values of the patients when grouped by their CNS disability scores. The resulting F value was compared with the critical F value for the specified number of samples, and aPvalue was determined using a 95% confidence interval to gauge significance for all of the results.
Results
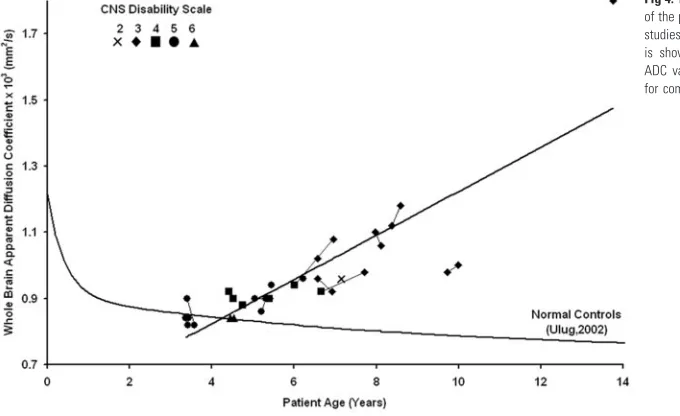
The whole-brain ADC value containing both gray and white matter components of the brain was determined from the 32 DWI scans of the 18 LINCL subjects and given with age, CNS disability score at the time of the scan, and the age at diagnosis (Table). The estimate of percentage error on the maximum ADC value was 1.7%⫾ 0.3% (n⫽ 5) using the statistical bootstrap method. The whole-brain ADC values derived from the histogram increased with age for all of the LINCL patients (Fig 4), in contrast with the decrease in ADC as a function of age as seen in age-matched control subjects. The ADC values increased linearly with patient age [ADC⫻103(mm2/s)⫽ Fig 2.A whole-brain ADC histogram from a representative patient with LINCL shows the dual Gaussian and partial volume functions that were used to fit the whole brain, partial volume, and CSF compartments.
Fig 3.Voxels associated with specific ranges of ADC values provide visual confirmation that compartments identified as whole brain, partial volume, and CSF correspond with specific regions as shown from a representative section of a patient with LINCL. ADC ranges displayed are described below.
A, 1.0⫾0.2⫻10⫺3mm2/s.
B, 1.5⫾0.2⫻10⫺3
mm2
/s. C, 2.0⫾0.2⫻10⫺3mm2/s.
D, 2.5⫾0.2⫻10⫺3
mm2
/s. E, 3.0⫾0.2⫻10⫺3mm2/s.
F, 3.5⫾0.2⫻10⫺3
mm2
[image:3.585.53.304.55.509.2]0.065 * Age (years)⫹0.564] yielding R2⫽0.71 (P⬍.0001). The whole-brain ADC values were correlated with the disease duration calculated as the age at diagnosis subtracted from the age at examination. A linear trend showed significant correla-tion between the whole-brain ADC histogram values and dis-ease duration yielding R2⫽0.68 (P⬍.0001). There were no
significant differences in the ADC values of the Gaussian rep-resenting brain parenchyma of the LINCL patients fitted using both Equation 2 and the triple-Gaussian methods. The point at which the lower 95% confidence interval of the LINCL pa-tients crossed the upper 95% confidence interval of the control subjects was at 5 years. This implies that statistically significant deviations in whole-brain ADC may be detected as early as 5 years of age in this population.
A single-factor ANOVA test with a 95% confidence interval compared the mean of the whole-brain ADC histogram with the modified CNS disability scale. The ANOVA analysis yielded F⬎Fcrit(3.8⬎2.7) and aPvalue of .01, confirming
differences in the means of the whole-brain ADC values be-tween patients grouped by LINCL scale. A linear regression confirmed that the whole-brain ADC values increased with disease severity (R2⫽0.27;P⫽.002).
Discussion
A number of noninvasive imaging approaches have been ap-plied to the brains of subjects with various forms of neuronal ceroid lipofuscinosis. Conventional MR imaging and CT have been used to demonstrate the presence of cerebral atrophy in multiple forms of neuronal ceroid lipofuscinosis.13-16 How-ever, atrophic grading using conventional MR imaging is only a subjective measure of disease severity. A diffuse hyperinten-sity of cerebral white matter has been reported in LINCL pa-tients.2,13Postmortem studies of LINCL and juvenile neuronal ceroid lipofuscinosis patients confirm a loss of myelin and gliosis in periventricular white matter.2Consistent with these
findings, our patients presented with enlarged sulci and ven-tricles in both the supratentorial and infratentorial compart-ments of the brain consistent with marked atrophy. In addi-tion, high signal intensity on T2-weighted images was observed in the periventricular white matter. A previously
published CT study also showed increased subarachnoid and ventricular spaces, which were correlated with patient age.16
However, CT findings were usually normal in patients younger than 10 years of age, and these findings did not cor-relate with onset or severity of the abnormalities, possibly re-flecting the diverse forms of neuronal ceroid lipofuscinosis in this study before genetic testing.16
MR spectroscopic imaging (MRSI) has also been used to noninvasively assess brain metabolism in various neurodegen-erative diseases, such as Alzheimer and Parkinson diseases.7,17 1H-MR spectroscopy has used single voxel techniques to
de-termine abnormal metabolic changes in patients with LINCL within specific regions, such as the white matter of the parietal lobe.18MRSI is a sensitive though nonspecific method for
as-sessing metabolic changes in patients with LINCL compared with normal control subjects. Multivoxel chemical shift imag-ing may provide further information about metabolic degra-dation in specific regions of the brain.19
Traditionally, DWI has been used to assess isotropic re-striction of water molecules in stroke or white matter diseases of the brain, such as multiple sclerosis or ischemic leukoara-iosis.20,21DWI has rarely been used to examine
neurodegen-erative diseases of the brain, which primarily affect gray mat-ter. One study examined patients with Huntington disease with DWI and found a correlation (P⫽.05) between disease stage and the mean of the whole-brain ADC histograms.22Our
study showed a strong correlation between whole-brain ADC values and age along with both disease severity and duration in patients with LINCL.
This study examined the water diffusivity of the entire brain through the use of DWI. Whole-brain ADC histograms were created that included all of the voxels in the brain having signal intensities greater than a predefined threshold. This method eliminated user subjectivity required to place regions of interest on the images. The reproducibility of whole-brain ADC histograms has been confirmed as an accurate method to quantify water diffusion in a robust and objective manner.23 The whole-brain histogram was fitted using dual Gaussian functions in addition to a partial volume function to charac-terize brain parenchyma while excluding partial volume and
[image:4.585.55.395.46.254.2]CSF contamination. The global maximum of this function yielded an estimate of the whole-brain ADC value. As ex-pected, compartments identified as brain parenchyma, partial volume, or CSF corresponded with those specific locations in the brain. The fitted Gaussian function with the lowest mean ADC corresponded with that of parenchyma containing both gray and white matter regions. Voxels labeled as containing partial volume fractions in the model were found to corre-spond with those regions at the boundary between gray and white matter and CSF. As the ADC value increased, voxels along the gray matter boundary were seen to migrate toward regions of CSF. Similarly, the voxels with high ADC were as-sociated with the CSF compartment. Voxels having higher ADC values than CSF were also observed, most likely because of CSF flow artifacts in the region.
A significant correlation between increased whole-brain ADC values and patient age was found for all of the patients. Deviation of whole-brain ADC values from the control subjects became significant at 5 years of age, suggesting a common age of disease onset. This is consistent with the uniform age of manifestation of LINCL clinical symptoms. Because of the progressive increase of ADC values with age and the uniform age at diagnosis, it follows that the ADC values also correlate with time since diagnosis. Sim-ilarly, because severity increases with age, it would be expected that ADC values correlate with severity, which is indeed the case, though this correlation is less strong.
Changes in the ADC values were likely the result of a com-bination of physiologic mechanisms that primarily alter the restrictive nature of gray matter and, to a lesser degree, that of white matter. A study found that calcium-binding proteins linked to GABAergic interneurons in the cortex and cerebel-lum were disrupted in patients with LINCL.24An additional
postmortem study of 13 case subjects with LINCL found a moderate-to-severe loss of myelin and mild-to-moderate gli-osis in the periventricular white matter of 10 of 13 case sub-jects.2Increased signal intensity in the periventricular white
matter on T2-weighted MR images in patients with LINCL was correlated with histology confirming atrophy. These find-ings implied a loss of neuronal integrity in gray matter and decreased myelination in white matter. This is consistent with the increased whole-brain ADC values found in this study showing the progressive nature of the disease.
Whole-brain ADC values correlated better with patient age than the modified CNS disability scale. Whole-brain ADC values may, thus, provide a more accurate physiologically based indica-tor of disease progression and severity. The objective acquisition and analysis criterion of whole-brain ADC histograms is an at-tractive feature of this technique. In addition, ADC measures provide a more continuous scale with which to assess severity in comparison with the discrete characterization of patient disability.
Conclusions
This study was conducted to evaluate whether quantitative data derived by DWI techniques can supplement clinical disability scale information to provide a quantitative esti-mate of neurodegeneration, as well as disease progression and severity. The results presented are consistent with known conventional MR imaging findings but suggest an
objective and complementary technique to monitor disease progression. Increased whole-brain ADC values agree with imaging results characteristic of LINCL. Whole-brain ADC values were significantly correlated with patient age, disease severity as assessed with the modified CNS disability scale, and disease duration. DWI has been shown to detect vari-ances in cerebral water diffusion abnormalities in patients with LINCL and may have the potential to monitor disease progression and severity in conjunction with the clinical characterization of patient disability.
References
1. Crystal RG, Sondhi D, Hackett NR, et al.Clinical protocol. Administration of a replication-deficient adeno-associated virus gene transfer vector expressing the human CLN2 cDNA to the brain of children with late infantile neuronal ceroid lipofuscinosis.Hum Gene Ther2004;15:1131–54
2. Autti T, Raininko R, Santavuori P, et al.MRI of neuronal ceroid lipofuscinosis. II. Postmortem MRI and histopathological study of the brain in 16 cases of neuronal ceroid lipofuscinosis of juvenile or late infantile type. Neuroradiol-ogy1997;39:371–77
3. Sondhi D, Hackett NR, Apblett RL, et al.Feasibility of gene therapy for late neuronal ceroid lipofuscinosis.Arch Neurol2001;58:1793–98
4. Steinfeld R, Heim P, von Gregory H, et al.Late infantile neuronal ceroid lipofuscinosis: quantitative description of the clinical course in patients with CLN2 mutations.Am J Med Genet2002;112:347–54
5. Ballon D, Dyke J, Schwartz LH, et al.Imaging therapeutic response in human bone marrow using rapid whole-body MRI.NMR Biomed2000;13:321–28 6. Bosma GP, Huizinga TW, Mooijaart SP, et al.Abnormal brain diffusivity in
patients with neuropsychiatric systemic lupus erythematosus.AJNR Am J Neuroradiol2003;24:850 –54
7. Kantarci K.Magnetic resonance markers for early diagnosis and progression of Alzheimer’s disease.Expert Rev Neurotherapy2005;5:663–70
8. Ulug AM.Monitoring brain development with quantitative diffusion tensor imaging.Develop Science2002;5:286 –92
9. Mukherjee P, McKinstry RC.Diffusion tensor imaging and tractography of human brain development.Neuroimaging Clin N Am2006;16:19 – 43 10. Laidlaw DH, Fleischer KW, Barr AH.Partial-volume Bayesian classification of
material mixtures in MR volume data using voxel histograms.IEEE Trans Med Imag1998;17:74 – 86
11. Chun T, Filippi CG, Zimmerman RD, et al.Diffusion changes in the aging human brain.AJNR Am J Neuroradiol2000;21:1078 – 83
12. Hedges S, Shah P.Comparison of mode estimation methods and application in molecular clock analysis.BMC Bioinformatics2003;4:31
13. Nardocci N, Verga ML, Binelli S, et al.Neuronal ceroid-lipofuscinosis: a clin-ical and morphologclin-ical study of 19 patients.Am J Med Genet1995;57:137– 41 14. Santavuori P, Vanhanen SL, Autti T.Clinical and neuroradiological diagnostic aspects of neuronal ceroid lipofuscinoses disorders.Eur J Paediatr Neurol
2001;5:157– 61
15. Vanhanen SL, Puranen J, Autti T, et al.Neuroradiological findings (MRS, MRI, SPECT) in infantile neuronal ceroid-lipofuscinosis (infantile CLN1) at differ-ent stages of the disease.Neuropediatrics2004;35:27–35
16. Lagenstein I, Schwendemann G, Kuhne D, et al.Neuronal ceroidlipofuscinosis: CCT findings in fourteen patients.Acta Paediatr Scand1981;70:857– 60 17. Seppi K, Schocke MF.An update on conventional and advanced magnetic
resonance imaging techniques in the differential diagnosis of neurodegenera-tive Parkinsonism.Curr Opin Neurol2005;18:370 –75
18. Seitz D, Grodd W, Schwab A, et al.MR imaging and localized proton MR spectroscopy in late infantile neuronal ceroid lipofuscinosis.AJNR Am J Neu-roradiol1998;19:1373–77
19. Shungu DC, Worgall S, Mao X, et al.Spectral characteristics of late infantile neuronal ceroid lipofuscinosis (“Batten disease”) investigated in vivo by 1H magnetic resonance spectroscopic imaging at 3.0 T.Proc Int Soc Magnet Res Med2005;13:1268
20. Mascalchi M, Moretti M, Della Nave R, et al.Longitudinal evaluation of leuko-araiosis with whole brain ADC histograms.Neurology2002;59:938 – 40 21. Wilson M, Morgan PS, Lin X, et al.Quantitative diffusion weighted magnetic
resonance imaging, cerebral atrophy, and disability in multiple sclerosis. J Neurol Neurosurg Psychiatry2001;70:318 –22
22. Mascalchi M, Lolli F, Della Nave R, et al.Huntington disease: volumetric, diffusion-weighted, and magnetization transfer MR imaging of brain. Radi-ology2004;232:867–73
23. Steens SC, Admiraal-Behloul F, Schaap JA, et al.Reproducibility of brain ADC histograms.Eur Radiol2004;14:425–30