DH INFORMATION READER BOX
Policy Estates
HR / Workforce Commissioning
Management IM & T Social Care
Planning / Finance
Clinical Social Care / Partnership Working
Document Purpose Gateway Reference Title
Author
Publication Date Target Audience
Circulation List
Description
Cross Ref
Superseded Docs
Action Required
Timing Contact Details
0
N/A
0 N/A
Heslington
0
Association of Public Health Observatories
Guidance on Joint Strategic Needs Assessment
0
N/A 01 Jul 2008
PCT CEs, NHS Trust CEs, SHA CEs, Care Trust CEs, Foundation Trust CEs , Medical Directors, Directors of PH, Directors of Nursing, Local Authority CEs, Directors of Adult SSs, PCT PEC Chairs, Directors of Finance, GPs, Directors of Children's SSs, PCT and LA Directors of Commissioning and Directors of Finance, Regional Directors of the Government Offices
N/A
The Department of Health have commissioned the Association of Public Health Observatories to undertake a review of the JSNA process. The core dataset is cross-tabulated against Vital Signs and the National Indicator Set. 10262
For Information
For Recipient's Use
The JSNA Core Dataset
YO10 5DD
0
01904 724488 Anne Cunningham
The Core Dataset
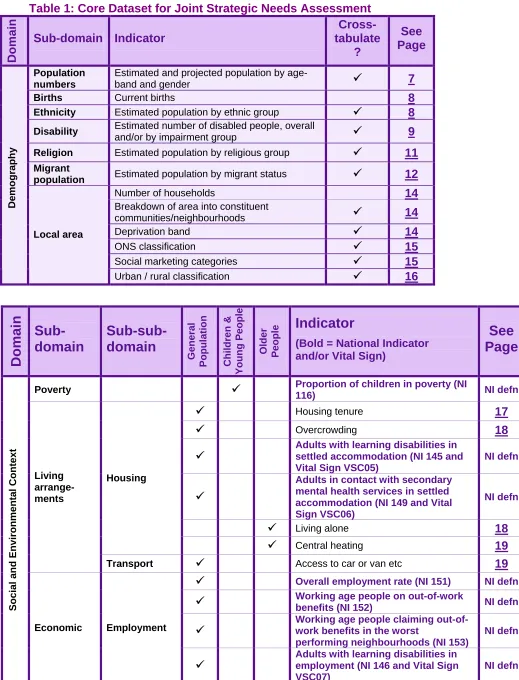
The core dataset in Table 1 provides an indicative list of indicators to assist partnerships in preparing their JSNA. Further information on each indicator is provided either within this document or in the official ‘Handbook of Definitions’ for the National Indicator Set.
Domains
The domains and sub-domains in the dataset are not official categories.
Demography Domain
The ‘Demography’ domain underpins the JSNA, both by setting local context, and as an essential component in producing projections and breakdowns of need.
Other Domains
The remaining domains, sub-domains and sub-sub-domains contain indicators which either measure need or are a proxy for it. Some of them relate to a particular age-group, as indicated by ticks in the ‘Children & Young People’ or ‘Older People’ column.
Projections
The first indicator in Table 1, ‘Population numbers’, specifies projected as well as estimated figures. This is partly to stress the particular importance of population
projections, without which many other projections would not be possible. It also serves as a general reminder of the need to forecast ahead.
Rather than repeat this every time, there is an implicit assumption that a selection of other indicators from across all the domains will also be projected forwards. Simple techniques suitable for forecasting many of the indicators are described in Projection methods for use in JSNA. Sometimes ‘ready-made’ projections are available, and where known about these are mentioned in the Further Information for each indicator.
Inequalities
Demographic indicators which could provide a useful breakdown for the study of
inequality in other indicators are marked with a tick in the ‘Crosstabulation’ column. For instance, a particular need may be higher or lower in certain age-groups or ethnic groups, among disabled people, or in deprived areas. Methods of analysing and expressing inequalities in health and wellbeing are described in Measuring Health Inequalities. The Further Information sections signposts any existing inequalities analyses that are known about. Measuring Equality at a Local Level (launching during summer 2008 at
www.idea.gov.uk/diversity) also sounds highly relevant, and promises new resources on:
• equality and neighbouhood statistics; • disaggregation of national data; and
Table 1: Core Dataset for Joint Strategic Needs Assessment
Domain
Sub-domain Indicator
Cross-tabulate
?
See Page
Population numbers
Estimated and projected population by
age-band and gender 9 7
Births Current births 8
Ethnicity Estimated population by ethnic group 9 8
Disability Estimated number of disabled people, overall
and/or by impairment group 9 9
Religion Estimated population by religious group 9 11
Migrant
population Estimated population by migrant status 9 12
Number of households 14
Breakdown of area into constituent
communities/neighbourhoods 9 14
Deprivation band 9 14
ONS classification 9 15
Social marketing categories 9 15
De
mogr
aphy
Local area
Urban / rural classification 9 16
Domai
n
Sub-domain
Sub-sub-domain
Gener
a
l
Population Children &
Young Peopl
e
O
ld
e
r
People
Indicator
(Bold = National Indicator and/or Vital Sign)
See
Page
Poverty 9 Proportion of children in poverty (NI
116) NI defn
9 Housing tenure 17
9 Overcrowding 18
9 Adults with learning disabilities in settled accommodation (NI 145 and Vital Sign VSC05)
NI defn
9
Adults in contact with secondary mental health services in settled accommodation (NI 149 and Vital Sign VSC06)
NI defn
9 Living alone 18
Housing
9 Central heating 19
Living arrange-ments
Transport 9 Access to car or van etc 19
9 Overall employment rate (NI 151) NI defn
9 Working age people on out-of-work benefits (NI 152) NI defn
9 Working age people claiming out-of-work benefits in the worst performing neighbourhoods (NI 153)
NI defn
Social and Environ
m
en
ta
l Conte
x
t
Economic Employment
Domai
n
Sub-domain
Sub-sub-domain
Gener a lPopulation Children &
Young Peopl e O ld e r People
Indicator
(Bold = National Indicator and/or Vital Sign)
See
Page
9
Adults in contact with secondary mental health services in
employment (NI 150 and Vital Sign VSC08)
NI defn
9 Unemployment rate 20
Employment (continued)
9 Claimant count 20
Economic (continued)
Other 9 Average incomes 21
Environ-ment Isolation 9 Access to services 21
Social and Environ
m en ta l Con tex t (co n tinued )
Voice Satisfaction 9 Satisfaction of people over 65 with
home and neighbourhood (NI 138) NI defn
9 Modelled and/or recorded smoking
prevalence 22
Smoking
9 Quit rates (NI 123 and Vital Sign
VSB05) NI defn
9 Modelled and/or recorded eating behaviour 22
Eating habits
9 Prevalence of breastfeeding at 6-8 weeks from birth (NI 53 and Vital Sign VSB11)
NI defn
9 Alcohol-harm related hospital admission rates (NI 39 and Vital Sign VSC26)
NI defn
Alcohol
9 Modelled and/or recorded drinking behaviour 23
Physical
activity 9
Participation in sport and active
recreation 23
9 Under 18 conceptions (NI 112 and Vital Sign VSB08) NI defn
Behaviour
Teenage pregnancy
9 Under 16 conceptions 24
Hypertension 9 Modelled and/or recorded hypertension 24
9 9 Modelled and/or recorded obesity (adult) 25
9 Obesity among primary school age children in Reception Year (NI 55 and Vital Sign VSB09)
NI defn Lifes tyle/Ris k Factors Other Obesity
9 Obesity among primary school age children in Year 6 (NI 56 & Vital Sign VSB09)
NI defn
9 All-Age All-Cause Mortality (NI 120
and Vital Sign VSB01) NI defn
9 Infant mortality 26
9 Life expectancy 26
9 Main causes of death 27
9 Hospital admissions – top 10 causes 28
Burden of ill-heal
th
Misc All causes
Domai
n
Sub-domain
Sub-sub-domain
Gener
a
l
Population Children &
Young Peopl
e
O
ld
e
r
People
Indicator
(Bold = National Indicator and/or Vital Sign)
See
Page
All causes
(continued) 9
Healthy life expectancy at age 65 (NI 137 and Vital Sign VSC25)
NI defn &
28
Causes considered amenable to healthcare
9 Mortality rate from causes considered amenable to healthcare (Vital Sign VSC30)
29
Misc (continued)
Due to
smoking 9 Deaths attributable to smoking 29
9 Modelled v. recorded prevalence 30
Diabetes General
9 Estimated excess deaths among people
with diabetes 30
General 9
Mortality rate from all circulatory diseases under 75 (NI 121 and Vital Sign VSB02)
NI defn
9 Mortality 31
9 Modelled v. recorded prevalence 31 9 Hospital admission rate for MI (proxy for
incidence) 32
Coronary heart disease
9 Admissions for cardiac revascularisation 32
9 Mortality 32
Circulatory
Stroke
9 Hospital admission rate for stroke (proxy for incidence) 33
General 9 Mortality rate from all cancers under
age 75 (NI 122 and Vital Sign VSB03) NI defn
Cancer
By site 9 Cancer registrations 33
9 COPD mortality 34
Respir-
atory COPD 9 COPD modelled v. recorded prevalence 34
TB 9 TB notifications 35
9 KC60 GUM STI data, particularly gonorrhoea 35
9 New diagnoses of HIV/Aids 36
9 Late diagnoses of HIV/Aids 36
Infectious
STIs & HIV
9 Uptake of Chlamydia screening in under-25s (NI 113 and Vital Sign VSB13)
NI defn
Dental
health Decay 9 % dmft in 5-year olds 37
Dementia 9 Prevalence of dementia 37
Burden of ill-heal
th (continued)
Mental
health Suicide 9
Suicide and injury of undetermined intent mortality rate (Vital Sign
Domai
n
Sub-domain
Sub-sub-domain
Gener a lPopulation Children &
Young Peopl e O ld e r People
Indicator
(Bold = National Indicator and/or Vital Sign)
See
Page
Mental
health cont. Mental illness 9
Mental illness needs indices and
prevalence rates 38
Falls 9 Hospital admissions for fractured
proximal femur (proxy for incidence) 39 9 People killed or seriously injured on roads 39
Road accidents
9 Children killed or seriously injured on roads (NI 48) NI defn
Trauma
Injuries 9
Hospital admissions caused by unintentional and deliberate injuries to children and young people (NI 70 and Vital Sign VSC29)
NI defn
Burden of ill-heal
th (continued)
Musculo-skeletal Arthritis 9
Admissions for hip and knee
replacement 39
9 9
Physical disability, frailty and sensory impairment
1. Number of clients
2. Number receiving services in community
40
9 9
Learning disability 1. Number of clients
2. Number receiving services in community
40
9 9
Mental health
1. Number of clients
2. Number receiving services in community
40
9 9
Substance misuse 1. Number of clients
2. Number receiving services in community
40
Numbers
9 9
Vulnerable people 1. Number of clients
2. Number receiving services in community
40
9
Timeliness of social care
assessment (NI 132 and Vital Sign VSC12) and packages (NI 133 and Vital Sign VSC13)
NI defn
9
People supported to live independently through social services (NI 136 and Vital Sign VSC03) NI defn Services Social care Standard of service 9
Carers receiving needs assessment or review and a specific carer’s service, or advice and information (NI 135)
Domai
n
Sub-domain
Sub-sub-domain
Gener a lPopulation Children &
Young Peopl e O ld e r People
Indicator
(Bold = National Indicator and/or Vital Sign)
See
Page
Social care (continued) Standard of service (continued) 9Adults and older people receiving direct payments and/or individual budgets per 100,000 population aged 18 and over (Vital Sign VSC17, NI 130)
NI defn
Maternity 9 Early access for women to maternity
services (NI 126, Vital Sign VSB06) NI defn
Dental health 9 Number of people accessing NHS
dentistry (Vital Sign VSB18) 41
9 Uptake rates for flu jab 41
9 Proportion of children who complete immunisation by recommended ages (Vital Sign VSB10)
41
Preventative / screening
9 Proportion of women aged 47-49 and 71-73 offered screening for breast cancer (Vital Sign VSA09)
42
9 Offer of an appointment at a GUM service within 48 hours 42
9 Long acting reversible contraception methods 43
Sexual health
9 Access to NHS funded abortions before 10 weeks gestation 43
Mental health 9
Proportion of people with depression and/or anxiety disorders who are offered psychological therapies (Vital Sign VSC02)
44
Health services
Long-term
conditions 9
Proportion of people with long-term conditions supported to be
independent and in control of their condition (NI 124, Vital Sign VSC11)
NI defn
9 The extent to which older people receive the support they need to live independently at home (NI 139)
NI defn
9 User reported measure of respect and dignity in their treatment (NI 128 and Vital Sign VSC32)
NI defn
User perspective on social care
9 Self-reported experience of social care users (NI 127) NI defn
9 National Patients Survey Programme findings for local institutions 46
9 Parental experience of services for disabled children (NI 54, Vital Sign VSC33)
NI defn
9 Patient experience of access to primary care (Vital Sign VSA06) 45
Services (co n tinued ) Voice User perspective on health care
9 User reported measure of respect and dignity in their treatment (NI 128 and Vital Sign VSC32)
Further information to support Table 1
Indicator(s)
1.
Estimated population by age-band and gender
Domain Sub-domain Sub-sub-domain
Demography Population numbers N/A Sources
Description Detail
Available
from
http://www.statistics.gov.uk/StatBase/Product.asp?vln k=601
(Look for ‘Population Estimates – Current Datasets’) ONS mid-year
population estimates
LA level, latest 2006
http://www.statistics.gov.uk/statbase/product.asp?vlnk =14060 for more detailed age-breakdowns etc
http://www.statistics.gov.uk/StatBase/Product.asp?vln k=14357
ONS mid-year population estimates (experimental)
LSOA and MSOA level, latest 2005
Also available from
www.neighbourhood.statistics.gov.uk – Choose ‘People and Society: Population and Migration’, then: • ‘Resident Population Estimates, All
Persons/Females/Males’ (down to MSOA level), or
• ‘Resident Population Estimates by Broad Age Band’ (down to LSOA level)
http://www.statistics.gov.uk/STATBASE/Product.asp? vlnk=997
Use ‘2006-based SNPP – Current Data’ for a pdf interface to the Excel tables, or ‘2006 – based SNPP – Datasets’ to download the tables themselves.
Previous 2004-based projections are also available from POPPI (www.poppi.org.uk) for age-groups 65+
Projections
ONS
Subnational Population Projections
LA level, 2004-based projections
for 2006-31 Previous 2004-based projections are also available via user-friendly tool at
http://www.swpho.nhs.uk/resource/view.aspx?RID=35 108 (see
http://www.swpho.nhs.uk/resource/view.aspx?RID=35 086 for introduction).
Comments
NB – the ONS projections also provide a breakdown of how much of each year’s change is natural (due to births and deaths), and how much due to migration. To see this, choose one of the tables called ‘components of change’ (i.e. Table 6 for Las, counties and
Government Office Regions).
Return to Table 1
Indicator(s)
2.
Current births
Domain Sub-domain Sub-sub-domain
Demography Births N/A Sources
Description Detail
Available
from
[image:10.595.65.559.92.723.2]ONS Vital Statistics Tables VS1
& VS2 (LA level) Birth rates
and numbers
[image:10.595.72.557.452.702.2]ONS Vital Statistics Table VS4 (ward level)
See http://www.ons.gov.uk/about/who-we- are/our-services/unpublished-data/vital-events-data/vso--non-nhs-customers for how to obtain Vital Statistics if you are not an NHS customer.
Comments
• For a description of the Vital Statistics tables available to non-NHS customers, see http://www.esds.ac.uk/government/vitals/datasets/. However the table at the bottom referred to as ‘VS4DL’ should say ‘VS4D’, and the table referred to as ‘VS4D’ should say ‘VS4’.
• For a useful presentation on the Vital Statistics, see
http://www.ccsr.ac.uk/esds/events/2006-07-05/slides/norman.ppt. (Please note that Table VS5 is no longer available to local authorities).
Return to Table 1
Indicator(s)
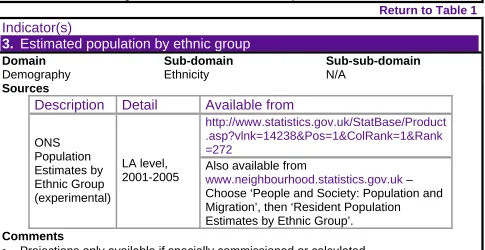
3.
Estimated population by ethnic group
Domain Sub-domain Sub-sub-domain
Demography Ethnicity N/A Sources
Description Detail
Available
from
http://www.statistics.gov.uk/StatBase/Product .asp?vlnk=14238&Pos=1&ColRank=1&Rank =272
ONS Population Estimates by Ethnic Group (experimental)
LA level, 2001-2005
Also available from
www.neighbourhood.statistics.gov.uk – Choose ‘People and Society: Population and Migration’, then ‘Resident Population
Estimates by Ethnic Group’. Comments
• Projections only available if specially commissioned or calculated.
Return to Table 1
Indicator(s)
4.
Estimated number of disabled people, overall and/or by impairment group
Domain Sub-domain Sub-sub-domain
Demography Disability N/A Sources
Description Detail
Available
from
Disability Discrimination Act (DDA) definition
Suggested definition for use in local surveys
Only available by local survey. See Appendix 1 for background information and approved question wording.
Impairment groups are:
• physical impairment
• sensory impairment
• mental health condition
• learning disability
• other long-standing illness / health condition
Health Survey for England 2001
http://www.archive2.official-documents.co.uk/document/deps/doh/survey 01/disa/disa01.htm. National prevalences which could be applied to local population data. Scroll down for tables -e.g. Table 1 gives prevalence of moderate and severe disability by age-group (16+) and sex. Overall
disability by
severity Local estimates (based on Survey of Disability in Great Britain 1988)
‘Capacity to Change’ Table 2
(http://www.jitscotland.org.uk/uploads/paneld
ocs/JIT-Commissioning-Workbook-Tables.xls) generates disability estimates and projections if relevant local population data is entered in preceding tables. Mainly focuses on older people.
Limiting
long-term illness Census 2001
From usual Census sources – e.g. www.neighbourhood.statistics.gov.uk,
www.nomisweb.co.uk. Not the same thing as disability, but may be useful as a proxy. People
registered blind and partially sighted
Latest figures 2006, LA level
From Information Centre, at
http://www.ic.nhs.uk/statistics-and-data- collections/social-care/adult-social-care- information/people-registered-as-blind-and-partially-sighted-triennial-2006-england.
Learning Disabilities
QOF 2005-06, down to PCT and practice level
Indicator(s)
4.
Estimated number of disabled people, overall and/or by impairment group
Simple estimates
A simple guide to estimating local populations of people with learning disabilities can be found at
http://valuingpeople.gov.uk/echo/filedownloa d.jsp?action=dFile&key=1111
National estimates of prevalence
Prevalence estimates available from:
http://www.lancs.ac.uk/fass/ihr/research/lear ning/download/currentneed.pdf
The same team at Lancaster University has produced a new report for Mencap,
summarising nationally representative statistics on various aspects of learning disability:
http://www.mencap.org.uk/displaypagedoc.a sp?id=3160
Learning disabilities
National projections of prevalence
Available from:
www.lancs.ac.uk/fass/ihr/research/learning/d ownload/futureneed.pdf. See also report at www.mencap.org.uk/displaypagedoc.asp?id= 3160
Down’s Syndrome Visual impairment Mobility problems Limiting long-term illness
LA-level projection for older people
www.poppi.org.uk
Projections
Overall disability by severity
Local estimates (based on Survey of Disability in Great Britain 1988)
‘Capacity to Change’ Table 2
(http://www.jitscotland.org.uk/uploads/paneld
ocs/JIT-Commissioning-Workbook-Tables.xls) generates disability estimates and projections if relevant local population data is entered in preceding tables. Mainly focuses on older people.
Inequalitie
s Aspects Disability and employment
LA estimates from Annual Population Survey / Labour Force Survey
Indicator(s)
4.
Estimated number of disabled people, overall and/or by impairment group
Comments
• For a 4-page guide to different definitions of disability from the DWP, see http://www.dwp.gov.uk/asd/asd5/ih2003-2004/IH128userguide.pdf.
• Work is ongoing at Manchester University to produce improved local estimates and projections of numbers of disabled people – see
http://www.ccsr.ac.uk/popgroup/disability.htm
• For more in-depth discussion of various scenarios regarding projected numbers of disabled people, see e.g. the ‘Trends’ section in each chapter of:
http://www.ippr.org.uk/members/download.asp?f=%2Fecomm%2Ffiles%2FDisability %5F2020%5Ffull%2Epdf.
• Two publications which look at the broad area of inequalities affecting disabled people are:
o Purdam, K et al (2008). Disability in the UK: measuring equality. Disability &
Society, 23:1, 53-65. Available from http://dx.doi.org/10.1080/09687590701725658
o Parckar, G (2008). Disability Poverty in the UK. London, Leonard Cheshire Disability. Available from http://www.lcdisability.org/?lid=6386
Return to Table 1
Indicator(s)
5.
Estimated population by religious group
Domain Sub-domain Sub-sub-domain
Demography Religion N/A Sources
Description Detail
Available
from
Religion 2001 Census
Usual Census sources – e.g.
http://www.neighbourhood.statistics.gov.uk/, www.nomisweb.co.uk.
Comments
Return to Table 1
Indicator(s)
6.
Estimated population by migrant status
Domain Sub-domain Sub-sub-domain
Demography Migration N/A Sources
Description Detail
Available
from
Total
International Migration (TIM)
LA level (flows)
Latest estimated international inflow & outflow are in the ‘Components of Change’ sheet for each LA at
http://www.statistics.gov.uk/statbase/product. asp?vlnk=14060..
Foreign NI Number (NINO) registrations
LA level
Tables downloadable from
http://www.dwp.gov.uk/asd/asd1/niall/nino_al location.asp
For those with a ‘.gov.uk’ email address, LA-level data available from
http://www.lgar.local.gov.uk/lgv/core/page.do ?pageId=27879.
Regional data available from
http://www.bia.homeoffice.gov.uk/sitecontent/ documents/aboutus/Reports/accession_moni toring_report/
Workers Registration Scheme (WRS)
Only applies to A8
countries.
LA-level upwards.
WRS-based estimates of A8 workers per 1000 residents at LA level - Appendix B of IPPR report ‘Floodgates or Turnstiles?’ at http://www.ippr.org.uk/members/download.as p?f=%2Fecomm%2Ffiles%2Ffloodgates%5F or%5Fturnstiles%2Epdf. Also in map form at http://news.bbc.co.uk/1/hi/uk/7370955.stm. ‘Flag 4’
marker on Patient
Register Data System
Identifies in-migrants registering with GP.
Mid-2006 LA-level ‘Flag 4’ data available at http://www.statistics.gov.uk/about/data/metho dology/specific/population/future/imps/update s/downloads/AppA.xls. See metadata sheet in this file for explanation of ‘Flag 4’ marker. Pupil Level
Annual School Census (PLASC)
LEA level
Available from individual Local Education Authorities. Only reflects those in-migrants who bring their children with them. Relies on use of ‘first language other than English’ as a proxy for immigration.
Projection
Total
International Migration (TIM)
LA level (flows)
International inflow & outflow for each LA to 2029 are available at
Indicator(s)
6.
Estimated population by migrant status
Comments
Each of the above data sources has its strengths and weaknesses. Discussion and examples of their use can be found at the following addresses:
• Audit Commission: http://www.audit-commission.gov.uk/migrantworkers/
See especially ‘Local data and intelligence’. Its four sub-sections cover the above (and other) national data sources, ideas for gathering and exploiting local data, and a useful guide to what data will help you to answer what question.
• Office for National Statistics:
http://www.statistics.gov.uk/about/data/methodology/specific/population/future/imps/u pdates/default.asp. See particularly a review of administrative data sources at
http://www.statistics.gov.uk/about/data/methodology/specific/population/future/imps/u pdates/downloads/admin.pdf.
• Local Government Analysis and Research (LGAR):
http://www.lgar.local.gov.uk/lgv/core/page.do?pageId=42487. See especially the ‘Sources of research and information….’ section. Resources include:
o A 5-page guide to ‘Sources of information on migration’ at http://www.lgar.local.gov.uk/lgv/aio/35288;
o A report commissioned from the Institute of Community Cohesion (ICoCo) on ‘estimating the scale and impacts of migration at the local level’
(http://www.lgar.local.gov.uk/lgv/core/page.do?pageId=42490);
o A 4-page leaflet following on from the ICoCo report, and called ‘where have recent in-migrants gone?’ (http://www.lgar.local.gov.uk/lgv/aio/67211).
• Greater London Authority:
http://www.london.gov.uk/gla/publications/factsandfigures/dmag-briefing-2008-10.pdf
Inequalities Aspects
As well as issues of enumeration, the Audit Commission and LGAR sites, and the ICoCo report, all provide advice on how to understand the impact of migration upon local
services, and the challenges faced by the in-migrants themselves, illustrated by local case studies.
Some of the social, economic and health issues particularly affecting migrants are
summarised in a paper on Migrant Health in North East England by the North East Public Health Observatory (http://www.nepho.org.uk/view_file.php?c=2679). A study in Fife can be found at www.fifedirect.org.uk/migrantsurvey.
Further ideas for local research were presented at a LARIA/LGA event in May 2007 (see report at http://www.laria.gov.uk/content/features/85/feat6.pdf or slides at
http://www.laria.gov.uk/content/articles/migrant_workers_10052007/migrant_workers_10 052007.htm).
Return to Table 1
Indicator(s)
7.
Number of households
Domain Sub-domain Sub-sub-domain
Demography Local area N/A Sources
Description Detail
Available
from
Number and type of households
Regional, to 2029
http://www.communities.gov.uk/documents/h ousing/xls/707895.xls
Projections Number of households LA level, to 2029 http://www.communities.gov.uk/documents/housing/xls/707899.xls
Comments
Return to Table 1
Indicator(s)
8.
Breakdown of area into constituent communities/neighbourhoods
Domain Sub-domain Sub-sub-domain
Demography Local area N/A Sources
To be determined locally. Comments
Refers to any defined localities (neighbourhoods, towns etc) which may form a natural reporting unit for any of the indicators.
Return to Table 1
Indicator(s)
9.
Deprivation band
Domain Sub-domain Sub-sub-domain
Demography Local area N/A Sources
Description Detail
Available
from
Indices of Deprivation 2007
Lower level SOA
http://www.communities.gov.uk/communities/ neighbourhoodrenewal/deprivation/deprivatio n07/
Comments
• The Index of Multiple Deprivation (IMD), or other constituent elements of the Indices of Deprivation, can be used to allocate local LSOAs to a deprivation quintile.
• Although it is not officially approved, the deprivation indices can be derived for larger areas by taking a weighted average. For example, the 2007 Health Profiles contained MSOA-level averages and quintiles based on the 2004 Income Deprivation index (http://www.communityhealthprofiles.info/indicators/datasets/Deprivation_quintiles.xls) The 2008 Health Profiles will contain a similar MSOA-level summary of the IMD 2007.
Return to Table 1
Indicator(s)
10.
ONS classification
Domain Sub-domain Sub-sub-domain
Demography Local area N/A Sources
Description Detail
Available
from
http://www.statistics.gov.uk/about/methodolo gy_by_theme/area_classification/
National Statistics 2001 Area Classification
Available for LAs, Health areas,
Wards, SOAs and Output Areas
Also available from
www.neighbourhood.statistics.gov.uk
Comments
• This classification allocates each local authority, ward, SOA etc to clusters, known as ‘Supergroups’, ‘Groups’ and ‘Subgroups’, with names such as ‘Disadvantaged Urban Communities’ or ‘Countryside Communities’. Areas in the same cluster will have similar census characteristics.
Return to Table 1
Indicator(s)
11.
Social marketing categories
Domain Sub-domain Sub-sub-domain
Demography Local area N/A Sources
Description
Detail
(spatial level)
Available from
Personicx Geo
Unit
Postcode Axciom (www.acxiom.co.uk)
Mosaic UK
Unit
Postcode / LSOA
Experian (www.experian.co.uk)
People and
Places OA / LSOA
Beacon Dodsworth ( www.beacon-dodsworth.co.uk)
ACORN Unit
Postcode CACI (www.caci.co.uk) Health
ACORN OA CACI (www.caci.co.uk) Comments
• If you have access to one of these products, it can be used instead of the ONS Classification to identify homogeneous sub-areas for analysis and comparison.
• People & Places can also be supplied by postcode, but all postcodes within an OA receive the same classification.
Return to Table 1
Indicator(s)
12.
Urban/rural classification
Domain Sub-domain Sub-sub-domain
Demography Local area N/A Sources
Description Detail
Available
from
ONS Rural & Urban Area Classification 2004
At OA, LSOA, MSOA and Ward level
http://www.statistics.gov.uk/geography/nrudp .asp
(Also described on DEFRA site below, but data not available there.)
http://www.defra.gov.uk/rural/ruralstats/rural-definition.htm
DEFRA LA Classification 2005
(less relevant – see below)
LA level Results also tabulated at
http://www.poverty.org.uk/summary/rural%20 intro.shtml (scroll down).
Comments
• See http://www.poverty.org.uk/summary/rural%20intro.shtml for a quick introduction. • The LA Classification is probably less relevant for JSNA: “We do not recommend that
the classification is used to inform detailed policy design (e.g. for targeting local service delivery).” [DEFRA]
Return to Table 1
Indicator(s)
13.
Housing tenure
Domain Sub-domain Sub-sub-domain
Social & Environmental Context
Living Arrangements Housing
Sources
Description Detail
Available
from
From usual Census sources – e.g. www.neighbourhood.statistics.gov.uk, www.nomisweb.co.uk.
2001 Census data
Down to OA
level Census data on Tenure by Age from Table S017 is also available for Older People only and at LA level only from www.poppi.org.uk. http://www.communities.gov.uk/housing/hous ingresearch/housingstatistics/housingstatistic sby/localauthorityhousing/dataforms/.
Choose desired year, then click on link to HSSA data and choose relevant region. Tenure data is usually on the first sheet. Available up to 2006/07 as of April 2008. HSSA data
(Housing Strategy Statistical Appendix)
LA level only
Also available from
www.neighbourhood.statistics.gov.uk, but only up to 2005/06 as of April 2008. Go to ‘Housing’ domain and choose ‘Dwelling Stock by Tenure and Condition’.
Council Tax Records
Sub-LA level (some LAs only)
Tenure is recorded on some, but not all, local authority Council Tax systems.
Comments
• Census data is the only source which distinguishes between Private Rented and Owner Occupied.
• NB – when obtaining Tenure from Census tables, it is important to note whether the unit of analysis is the household or the individual.
Return to Table 1
Indicator(s)
14.
Overcrowding
Domain Sub-domain Sub-sub-domain
Social & Environmental Context
Living Arrangements Housing
Sources
Description Detail
Available
from
2001 Census data
Down to OA level
From usual Census sources – e.g. www.neighbourhood.statistics.gov.uk, www.nomisweb.co.uk. Look for ‘Occupancy Rating’ or ‘Persons per Room’.
Comments
• The most relevant Census variable is Occupancy Rating, which is defined at
http://www.neighbourhood.statistics.gov.uk/dissemination/LeadMetadataDownloadPD F.do?downloadId=188. It takes account not only of the number of persons, but their relationships, genders and ages, to determine what would be an appropriate number of rooms. A negative Occupancy Rating means too few rooms – i.e. overcrowding. • ‘Persons per Room’ is also available from the Census but is a cruder measure.
Return to Table 1
Indicator(s)
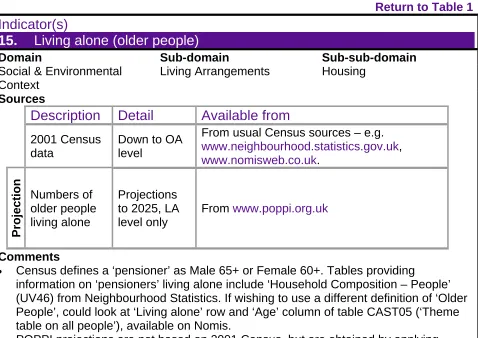
15.
Living alone (older people)
Domain Sub-domain Sub-sub-domain
Social & Environmental Context
Living Arrangements Housing
Sources
Description Detail
Available
from
2001 Census data
Down to OA level
From usual Census sources – e.g. www.neighbourhood.statistics.gov.uk, www.nomisweb.co.uk.
Projection
Numbers of older people living alone
Projections to 2025, LA level only
From www.poppi.org.uk
Comments
• Census defines a ‘pensioner’ as Male 65+ or Female 60+. Tables providing
[image:20.595.76.554.384.722.2]information on ‘pensioners’ living alone include ‘Household Composition – People’ (UV46) from Neighbourhood Statistics. If wishing to use a different definition of ‘Older People’, could look at ‘Living alone’ row and ‘Age’ column of table CAST05 (‘Theme table on all people’), available on Nomis.
Return to Table 1
Indicator(s)
16.
Central heating (older people)
Domain Sub-domain Sub-sub-domain
Social & Environmental Context
Living Arrangements Housing
Sources
Description Detail
Available
from
OA level upwards
www.nomisweb.co.uk. E.g. see Theme Table T06 on ‘Pensioner Households’.
2001 Census data
LA level only www.poppi.org.uk
Comments
• NB - Not available from Neighbourhood Statistics, as Census tables there do not give breakdown by age.
Return to Table 1
Indicator(s)
17.
Access to car or van etc
Domain Sub-domain Sub-sub-domain
Social & Environmental Context
Living Arrangements Transport
Sources
Description Detail
Available
from
OA level upwards
From usual Census sources – e.g. www.neighbourhood.statistics.gov.uk, www.nomisweb.co.uk.
2001 Census data
LA level only www.poppi.org.uk (‘Pensioner Households’ only)
Comments.
Return to Table 1
Indicator(s)
18.
Unemployment rate
Domain Sub-domain Sub-sub-domain
Social & Environmental Context
Economic Employment
Sources
Description Detail
Available
from
ONS surveys
and models LA level
www.nomisweb.co.uk. Easiest to use the ‘Local authority’ profiles available under ‘Summary Statistics’ on home page.
2001 Census
Available below LA level
www.nomisweb.co.uk. For wards, easiest to use the ‘Ward’ profiles available under ‘Summary Statistics’ on home page.
Comments.
• By ‘unemployed’, ONS means the International Labour Organisation definition:
o Without a job, want a job, have actively sought work in the last 4 weeks and are
available to start work in the next 2 weeks, or
o Out of work, have found a job and are waiting to start it in the next 2 weeks
• This can only be ascertained by survey. It is not the same thing as the claimant count. • To express as a rate, the count is divided by the number of economically active. • Even at LA level, sample sizes are small, so ONS has developed more reliable
model-based estimates. Below LA level, the only available data is from the Census. • The LA and Ward profiles in Nomis will automatically select the latest and most
appropriate unemployment data for the chosen area.
• By exploring the ‘Annual Population Survey’ in Nomis it is possible to find limited ethnic breakdowns, e.g. ‘16+ unemployment rate non-white’. However these often have large confidence intervals (e.g. +/- 10% for Bradford) or are suppressed.
Return to Table 1
Indicator(s)
19.
Claimant count
Domain Sub-domain Sub-sub-domain
Social & Environmental Context
Economic Employment
Sources
Description Detail
Available
from
Latest data from ONS
LA and ward level
www.nomisweb.co.uk. Easiest to use the ‘Local authority’ or ‘Ward’ profiles available under ‘Summary Statistics’ on home page.
Comments.
• ‘Claimant count’ refers to the count of those claiming Job Seekers Allowance (JSA). This is not the same as all those who are unemployed, and does not require a survey. • To express as a rate, the count is divided by the working-age population.
Return to Table 1
Indicator(s)
20.
Average incomes
Domain Sub-domain Sub-sub-domain
Social & Environmental Context
Economic Other
Sources
Description Detail
Available
from
ONS Model-based estimates
MSOA level, 2004
www.neighbourhood.statistics.gov.uk. Look for ‘Income: Model-based estimates’ in ‘People and Society: Income and Lifestyles’ domain.
Proprietary products – e.g. Paycheck
Unit
postcode www.caci.co.uk
Comments.
Return to Table 1
Indicator(s)
21.
Access to services
Domain Sub-domain Sub-sub-domain
Social & Environmental Context
Environment Isolation
Sources
Description Detail
Available
from
‘Geographical Barriers’ subdomain of Indices of Deprivation 2007
LSOA level scores
Go to
http://www.communities.gov.uk/communities/neig hbourhoodrenewal/deprivation/deprivation07/
and click on zip file called ‘Subdomains of the IMD 2007’. Look at the Geographical Barriers Subdomain score within ‘Barriers to Housing &
Services’. Remote places will have high positive
scores.
‘Geographical Barriers’ subdomain of Indices of Deprivation 2004
LSOA level distances to GP, primary school, post office and supermarket
The raw data behind the 2004 subdomain is on
www.neighbourhood.statistics.gov.uk (look for ‘Combined Road Distance to Services’ under ‘Indices of Deprivation and Classification’). The 2007 raw data may be expected to be added in due course.
DFT Core Accessibility Indicators 2005
LSOA level misc
indicators
http://www.dft.gov.uk/pgr/statistics/datatablespubl ications/ltp/coreaccessindicators2005.
‘Downloads’ on right-hand side of page gives access to a range of indicators on access to GPs, supermarkets, etc, with accompanying documentation.
Comments.
• DFT Core Accessibility Indicators may be over-technical for JSNA purposes.
Return to Table 1
Indicator(s)
22.
Modelled and/or recorded smoking prevalence
Domain Sub-domain Sub-sub-domain
Lifestyle/risk factors Behaviours Smoking Sources
Description Detail
Available
from
Survey data on smoking prevalence
Local
Currently only available if a local survey is conducted. Will in future be available from new Integrated Household Survey.
Available from
www.neighbourhood.statistics.gov.uk. Look for ‘Healthy Lifestyle Behaviours: Model-based estimates’ under ‘Health and Care’. Modelled
estimates of smoking prevalence
LA, PCT and MSOA, 2003-05
Also available (LAs only) from
http://www.ic.nhs.uk/pubs/healthylifestyles05 Data on
mothers smoking at time of delivery
PCT, quarterly
http://www.dh.gov.uk/en/Publichealth/Healthi mprovement/Tobacco/TobaccoGeneralInfor mation/DH_4139682
Comments
• Model-based estimates show what may be expected locally based on the area’s socio-economic characteristics, and cannot be used to monitor performance.
Return to Table 1
Indicator(s)
23.
Modelled and/or recorded eating behaviour
Domain Sub-domain Sub-sub-domain
Lifestyle/risk factors Behaviours Eating habits Sources
Description Detail
Available
from
Survey data
on prevalence Local Only available if a local survey is conducted. Available from
www.neighbourhood.statistics.gov.uk. Look for ‘Healthy Lifestyle Behaviours: Model-based estimates’ under ‘Health and Care’. Modelled
estimates of ‘5-a-day’ consumption
LA, PCT and MSOA, 2003-05
Also available (LAs only) from
http://www.ic.nhs.uk/pubs/healthylifestyles05
Comments
Return to Table 1
Indicator(s)
24.
Modelled and/or recorded drinking behaviour
Domain Sub-domain Sub-sub-domain
Lifestyle/risk factors Behaviours Alcohol Sources
Description Detail
Available
from
Survey data
on prevalence Local Only available if a local survey is conducted. Available from
www.neighbourhood.statistics.gov.uk. Look for ‘Healthy Lifestyle Behaviours: Model-based estimates’ under ‘Health and Care’. Modelled
estimates of binge drinking
LA, PCT and MSOA, 2003-05
Also available (LAs only) from
http://www.ic.nhs.uk/pubs/healthylifestyles05
Comments
• Model-based estimates show what may be expected locally based on the area’s socio-economic characteristics, and cannot be used to monitor performance.
Return to Table 1
Indicator(s)
25.
Participation in sport and active recreation
Domain Sub-domain Sub-sub-domain
Lifestyle/risk factors Behaviours Physical activity Sources
Description Detail
Available
from
LA level
http://www.sportengland.org/index/get_resou rces/research/active_people/active_people_1 .htm provides link to Headline Results at LA level, and instructions for registering with the Active People Diagnostic tool to analyse LA results in greater depth.
Active People Survey
2005/06
MSOA level (modelled)
The above page also provides links to maps of model-based estimates of participation at MSOA level.
Comments
• Model-based estimates show what may be expected locally based on the area’s socio-economic characteristics, and cannot be used to monitor performance. • At the time of writing, the Active People Survey 2007/08 is under way – see
http://www.sportengland.org/index/get_resources/research/active_people/active_peop le_2.htm
Return to Table 1
Indicator(s)
26.
Under-16 conceptions
Domain Sub-domain Sub-sub-domain
Lifestyle/risk factors Behaviours Teenage pregnancy Sources
Description Detail
Available
from
Number and rate of under-16 conceptions
LA level, 2002-04
http://www.everychildmatters.gov.uk/_files/L A%20teenage%20pregnancy%20analysis%2 0v3.2%20(April%2007).xls (final three
columns of ‘LAD 1 data’ sheet).
Number and rate of under-16 conceptions
LA level, 2003-05 (provisional)
Held on EMPHO website
(www.empho.org.uk) but only available to certain registered users.
Comments
• EMPHO is the lead PHO for Teenage Pregnancy. Both www.empho.org.uk and http://www.everychildmatters.gov.uk/teenagepregnancy/ are also worth visiting in connection with the ‘Under 18 conceptions’ indicator.
Return to Table 1
Indicator(s)
27.
Modelled and/or recorded hypertension
Domain Sub-domain Sub-sub-domain
Lifestyle/risk factors Other Hypertension Sources
Description Detail
Available
from
Modelled hypertension prevalence
PCTs, 2006 (based on 2003/04 data)
www.apho.org.uk/apho/models.aspx
provides links to APHO hypertension model methodology and results. Click on ‘Modelled data for 2007/08 LDPs’ for summary results, or ‘Hypertension Model’ (under ‘Tools’) for more detail.
QOF data
PCTs and practices, 2006/07
Go to
http://www.ic.nhs.uk/our- services/improving-patient-care/the-quality- and-outcomes-framework-qof-2006/07/qof-2006-07-data-tables, scroll down to ‘PCT QOF Tables’ or ‘Practice QOF Tables’, and select the ‘Prevalence’ spreadsheet.
If unfamiliar with practice codes, click on the Practice Lookup Table link.
Comments
Return to Table 1
Indicator(s)
28.
Modelled and/or recorded obesity (adult)
Domain Sub-domain Sub-sub-domain
Lifestyle/risk factors Other Obesity Sources
Description Detail
Available
from
Available from
www.neighbourhood.statistics.gov.uk. Look for ‘Healthy Lifestyle Behaviours: Model-based estimates’ under ‘Health and Care’. Modelled
estimates of obesity
LA, PCT and MSOA, 2003-05
Also available (LAs only) from
http://www.ic.nhs.uk/pubs/healthylifestyles05
Survey data on obesity prevalence
Local Only available if a local survey is conducted.
QOF data –
Not
recommended (see below)
PCTs and practices, 2006/07
Go to
http://www.ic.nhs.uk/our- services/improving-patient-care/the-quality- and-outcomes-framework-qof-2006/07/qof-2006-07-data-tables, scroll down to ‘PCT QOF Tables’ or ‘Practice QOF Tables’, and select the ‘Prevalence’ spreadsheet.
If unfamiliar with practice codes, click on the Practice Lookup Table link.
Pro
jection
Obesity in older people
LA level to
2025 From www.poppi.org.uk
Comments
• Model-based estimates show what may be expected locally based on the area’s socio-economic characteristics, and cannot be used to monitor performance. • http://www.yhpho.org.uk/resource/item.aspx?RID=9819 explains
shortcomings in the first year of QOF data on obesity, and recommends that it should not be used to measure prevalence.
• For child obesity, see separate indicators (NI 55 and 56).
Return to Table 1
Indicator(s)
29.
Infant mortality
Domain Sub-domain Sub-sub-domain
Burden of ill-health Misc All causes Sources
Description Detail
Available
from
Numbers and rates (< 1 yr, < 28 days, < 7 days)
LA and PCT level, 2006 or 2004-06
www.nchod.nhs.uk. Select ‘Go directly to the indicators’, and scroll down to ‘Mortality in Infancy’.
Comments
• It is theoretically possible for the PCT or PHO to calculate breakdowns by birthweight, gestation, deprivation etc, but in many cases numbers will be too small for this to be meaningful or publishable.
Return to Table 1
Indicator(s)
30.
Life expectancy
Domain Sub-domain Sub-sub-domain
Burden of ill-health Misc All causes Sources
Description Detail
Available
from
www.nchod.nhs.uk. Life
expectancy
LA and PCT level, up to
2003-05 http://www.statistics.gov.uk/downloads/them e_population/LE_E&W_2006.xls
Life
expectancy
Ward level 1999-2003
http://www.statistics.gov.uk/statbase/Product. asp?vlnk=14466 (Experimental Statistics)
Inequalitie
s
As
p
ects Life
expectancy
By
deprivation quintile within LA
Latest year’s APHO Health Profiles, at www.communityhealthprofiles.info
Comments
Return to Table 1
Indicator(s)
31.
Main causes of death
Domain Sub-domain Sub-sub-domain
Burden of ill-health Misc All causes Sources
Description Detail
Available
from
[image:29.595.71.558.123.413.2]ONS Vital Statistics Tables VS3
(LA level); Number of
deaths by
cause ONS Vital Statistics Table VS4D
(ward level)
See http://www.ons.gov.uk/about/who-we- are/our-services/unpublished-data/vital-events-data/vso--non-nhs-customers for how to obtain Vital Statistics if you are not an NHS customer.
Approved list of cause groupings
Annex A, p12 of
http://www.statistics.gov.uk/articles/hsq/HSQ 28_death.pdf. See discussion below.
Comments
• There is no single ‘correct’ definition of this indicator, and different results will be obtained depending on the level of precision with which cause of death is defined. • ONS published an article in 2005 on the implications of different ways of grouping
leading causes of death (http://www.statistics.gov.uk/articles/hsq/HSQ28_death.pdf).
Annex A of that article suggested a possible list of cause groups.
• A subsequent consultation approved the use of this list, and it was implemented for the first time in a national report in summer 2006 (see pp 53ff of
http://www.statistics.gov.uk/downloads/theme_health/HSQ30.pdf, esp. Table 3 and Figure 3). A similar presentation of the top ten causes for males and females separately would be appropriate for JSNA.
• Vital Statistics Table VS3 at LA level allows the use of something closely
approximating the approved list of causes. It also permits analysis by age-group. • Vital Statistics Table VS4D at Ward level has a much broader categorisation of cause
of death (see www.esds.ac/government/vitals/datasets). It is important to note that these are not mutually exclusive nor exhaustive. There is also no age breakdown. • For a description of the Vital Statistics tables available to non-NHS customers, see
http://www.esds.ac.uk/government/vitals/datasets/. However the table referred to as ‘VS4DL’ should say ‘VS4D’, and the table referred to as ‘VS4D’ should say ‘VS4’. • For a useful presentation on the Vital Statistics, see
http://www.ccsr.ac.uk/esds/events/2006-07-05/slides/norman.ppt. (Please note that Table VS5 is no longer available to local authorities).
Return to Table 1
Indicator(s)
32.
Hospital admissions – top 10 causes
Domain Sub-domain Sub-sub-domain
Burden of ill-health Misc All causes Sources
Description Detail
Available
from
Yet to be defined
LA or PCT level
Forthcoming ‘APHO Standard Outputs’, based on Hospital Episode Statistics (HES).
Comments
• There is no single ‘correct’ definition of this indicator. Your own PHO may have calculated results for LAs or PCTs in your region (see relevant PHO website), but each has used a different approach.
• Work is under way to develop a joint ‘APHO Standard Outputs’ site for HES results, which it is hoped will include a consensus definition of this indicator.
Return to Table 1
Indicator(s)
33.
Healthy life expectancy at 65 (pending availability of official NI 137)
Domain Sub-domain Sub-sub-domain
Burden of ill-health Misc Causes considered amenable to healthcare Sources
Description Detail
Available
from
Healthy Life Expectancy at 65
LA and above, 2001 (revised)
http://www.statistics.gov.uk/downloads/them e_health/Health_Expectancies.xls. Go to sheet ‘HLA at 65 LAs’.
Comments
• The official indicator will be a new version based on the Place Survey.
Return to Table 1
Indicator(s)
34.
Mortality rate from causes considered amenable to healthcare
Domain Sub-domain Sub-sub-domain
Burden of ill-health Misc Causes considered amenable to healthcare Sources
Description Detail
Available
from
Directly standardised rate (<75)
LA and PCT level,
2004-06
www.nchod.nhs.uk. Look for ‘Mortality from causes considered amenable to healthcare’
Comments
• NCHOD provides documentation of what is meant by ‘causes considered amenable to healthcare’.
• For each age-group and time-period, NCHOD provides three spreadsheets. These contain the following variants:
1. Mortality from causes considered amenable to health care;
2. Mortality from causes considered amenable to health care (exc. Ischaemic heart disease);
3. Mortality from causes other than those considered amenable to health care. • The ‘Vital Sign’ incorporates all three variants. The accompanying technical
documentation states: “The difference between amenable and non-amenable causes in their trends over time may provide evidence of the increasing (or decreasing) effectiveness of health care.”
Return to Table 1
Indicator(s)
35.
Deaths attributable to smoking
Domain Sub-domain Sub-sub-domain
Burden of ill-health Misc Due to smoking Sources
Description Detail
Available
from
Estimated directly age standardised rate, age 35+
LA level, 2003-05 (or latest available)
Latest APHO Health Profiles at
www.communityhealthprofiles.info.uk
Comments
• Anybody wishing to attempt this complex calculation at a lower level should consult the documentation from ERPHO at
http://www.communityhealthprofiles.info/indicators/19SmokingAttributableMortalityIndi cator.php.
Return to Table 1
Indicator(s)
36.
Diabetes – modelled v. recorded prevalence
Domain Sub-domain Sub-sub-domain
Burden of ill-health Diabetes General Sources
Description Detail
Available
from
PBS Model Phase 3
Ward level and above, estimates 2005
QOF data
PCTs and practices, 2006/07
Go to
http://www.ic.nhs.uk/our- services/improving-patient-care/the-quality- and-outcomes-framework-qof-2006/07/qof-2006-07-data-tables, scroll down to ‘PCT QOF Tables’ or ‘Practice QOF Tables’, and select the ‘Prevalence’ spreadsheet.
If unfamiliar with practice codes, click on the Practice Lookup Table link.
Projections
PBS Model Phase 3
Ward level and above, forecasts to 2025
http://www.yhpho.org.uk/PBS_diabetes.aspx #1
Comments
• The PBS model estimates diagnosed and undiagnosed prevalence. It is due to be extended to provide practice-level estimates. Estimates are available broken down by gender, broad age-group, and ethnic group.
Return to Table 1
Indicator(s)
37.
Estimated excess deaths among people with diabetes
Domain Sub-domain Sub-sub-domain
Burden of ill-health Diabetes General Sources
Description Detail
Available
from
Estimated % of deaths aged 20-79 attributable to diabetes
PCT level, 2005
http://www.yhpho.org.uk/resource/item.aspx? RID=9909
Comments
Return to Table 1
http://www.yhpho.org.uk/default.aspx? RID=8467
Return to Table 1
Indicator(s)
38.
Coronary heart disease (CHD) mortality
Domain Sub-domain Sub-sub-domain
Burden of ill-health Circulatory Coronary Heart Disease Sources
Description Detail
Available
from
Death numbers, rates and ratios
LA and PCT level, up to 2004-06
www.nchod.nhs.uk. Look for ‘Mortality from coronary heart disease’.
Comments
• An appropriate measure would be the Directly Age Standardised Rate < 75. • NHS organisations may be able to calculate for lower geographical levels.
Return to Table 1
Indicator(s)
39.
Coronary heart disease (CHD) – modelled v. recorded prevalence
Domain Sub-domain Sub-sub-domain
Burden of ill-health Circulatory Coronary Heart Disease Sources
Description Detail
Available
from
Modelled CHD prevalence
PCTs, 2006
www.apho.org.uk/apho/models.aspx provides links to APHO CHD model
methodology and results. Click on ‘Modelled data for 2007/08 LDPs’ for summary results, or ‘CHD Model and Benchmarking Tool’ (under ‘Tools’) for more detail.
QOF data
PCTs and practices, 2006/07
Go to
http://www.ic.nhs.uk/our- services/improving-patient-care/the-quality- and-outcomes-framework-qof-2006/07/qof-2006-07-data-tables, scroll down to ‘PCT QOF Tables’ or ‘Practice QOF Tables’, and select the ‘Prevalence’ spreadsheet.
If unfamiliar with practice codes, click on the Practice Lookup Table link.
Comments
• Purpose of APHO CHD model was to validate QOF registers. There may be cases of CHD which have been diagnosed but not entered on register.
• The model relies upon people giving reliable answers to a question in the Health Survey for England asking whether they had been diagnosed with CHD.
• POPPI (www.poppi.org.uk) contains a projection of the number of older people with a long-term health condition caused by a heart attack. This is not measuring the same thing, but may be thought relevant.
Return to Table 1
Indicator(s)
40.
Hospital admission rate for MI (proxy for incidence)
Domain Sub-domain Sub-sub-domain
Burden of ill-health Circulatory Coronary heart disease Sources
Description Detail
Available
from
Number and Directly Age Standardised Rate
LA (PCT
forthcoming)
http://www.apho.org.uk/default.aspx? QN=P_HES
Comments
Return to Table 1
Indicator(s)
41.
Admissions for cardiac revascularisation
Domain Sub-domain Sub-sub-domain
Burden of ill-health Circulatory Coronary heart disease Sources
Description Detail
Available
from
Number and Directly Age Standardised Rate
LA (PCT
forthcoming)
Go to www.yhpho.org.uk
Choose ‘Revascularisation, main operations’. Indicator will also be added to PCT Maps as soon as possible.
Comments
Return to Table 1
Indicator(s)
42.
Stroke mortality
Domain Sub-domain Sub-sub-domain
Burden of ill-health Circulatory Stroke Sources
Description Detail
Available
from
Death numbers, rates and ratios
LA and PCT level, up to 2004-06
www.nchod.nhs.uk. Look for ‘Mortality from stroke’.
Comments
Return to Table 1
Indicator(s)
43.
Hospital admission rate for stroke (proxy for incidence)
Domain Sub-domain Sub-sub-domain
Burden of ill-health Circulatory Stroke Sources
Description Detail
Available
from
Number and Directly Age Standardised Rate
LA and PCT
Comments
• POPPI (www.poppi.org.uk) contains a projection of the number of older people with a long-term health condition caused by a stroke. This is not measuring the same thing, but may be thought relevant.
Return to Table 1
Indicator(s)
44.
Cancer registrations
Domain Sub-domain Sub-sub-domain
Burden of ill-health Cancer By site Sources
Description Detail
Available
from
Incidence rates
LA and PCT level, up to 2002-04
www.nchod.nhs.uk. Look for ‘Incidence of’ various types of cancer.
Cancer E-Atlas (Northern, Yorkshire & Humber and East Midlands only)
LA http://www.apho.org.uk/resource/view.aspx? RID=47601
Comments
• Types of cancer for which three-year counts are sufficiently large to be disclosed on the non-NHS version of NCHOD are:
o All cancers
o All skin cancers
o Breast cancer
o Colorectal cancer
o Lung cancer
o Prostate cancer
Return to Table 1 http://www.apho.org.uk/default.aspx?
Return to Table 1
Indicator(s)
45.
COPD mortality
Domain Sub-domain Sub-sub-domain
Burden of ill-health Respiratory COPD Sources
Description Detail
Available
from
Death numbers, rates and ratios
LA and PCT level, up to 2004-06
www.nchod.nhs.uk. Look for ‘Mortality from bronchitis, emphysema and other chronic obstructive pulmonary disease’.
Comments
• An appropriate measure would be the Directly Age Standardised Rate < 75.
Return to Table 1
Indicator(s)
46.
COPD – modelled v. recorded prevalence
Domain Sub-domain Sub-sub-domain
Burden of ill-health Respiratory COPD Sources
Description Detail
Available
from
LAs, 2008
APHO website
(http://www.apho.org.uk/resource/browse.as px?RID=48313). Click on link for Local authority estimates of COPD prevalence and COPD prevalence model. Results are in ‘Results-LA’ sheet (scroll along to find it). Modelled
COPD prevalence
PCTs, 2008
APHO website
(www.apho.org.uk/resource/browse.aspx?RI D=48313). Click on link for Model based prevalence of COPD at PCT level (updated Feb 2008). Results are in first sheet.
QOF data
PCTs and practices, 2006/07
Go to
http://www.ic.nhs.uk/our- services/improving-patient-care/the-quality- and-outcomes-framework-qof-2006/07/qof-2006-07-data-tables, scroll down to ‘PCT QOF Tables’ or ‘Practice QOF Tables’, and select the ‘Prevalence’ spreadsheet.
If unfamiliar with practice codes, click on the Practice Lookup Table link.
Comments
• For an article comparing the APHO prevalence model with QOF, see
www.hsj.co.uk/insideknowledge/2008/03/qof_medicine__improving_the_detection_of _copd.html
• POPPI (www.poppi.org.uk) contains a projection of the number of older people with a long-term health condition caused by bronchitis and emphysema. This is not
Return to Table 1
Indicator(s)
47.
TB notifications
Domain Sub-domain Sub-sub-domain
Burden of ill-health Infectious TB Sources
Description Detail
Available
from
Notification rates and numbers
SHA level and above, 2006
www.nchod.nhs.uk. Look for ‘Incidence of tuberculosis’.
Rate bands PCT, up to 2005
http://www.hpa.org.uk/web/HPAweb&HPAwe bStandard/HPAweb_C/1195733750930
Crude rate
LAs, 2004-2006 average
2008 APHO Health Profiles, due this summer on www.communityhealthprofiles.info
Comments
Return to Table 1
Indicator(s)
48.
KC60 GUM STI data, particularly gonorrhoea
Domain Sub-domain Sub-sub-domain
Burden of ill-health Infectious STIs and HIV Sources
Description Detail
Available
from
New episodes and
diagnoses at GUM clinics
Various tables at SHA level
http://www.hpa.org.uk/web/HPAweb&HPAwe bStandard/HPAweb_C/1195733775264#data
Comments
• Further STI data can be requested by completing the form at
http://www.hpa.org.uk/webc/HPAwebFile/HPAweb_C/1210231688758 and returning it to the named contacts. The level of detail that can be provided will be limited due to disclosure control. See also following point about difficulty in calculating rates.
• NB – Rates are currently calculated by taking diagnoses or episodes at GUM clinics in the SHA, and dividing by that SHA’s resident population. This method may be
acceptable at the regional level, but not LA or PCT level, as not all have their own GUM clinic. The HPA are developing resident-based prevalence rates for local authorities, which should be available by the end of 2008.
Return to Table 1
Indicator(s)
49.
New diagnoses of HIV/Aids
Domain Sub-domain Sub-sub-domain
Burden of ill-health Infectious STIs and HIV Sources
Description Detail
Available
from
Incidence (i.e. notification) rates and numbers
Regional level, up to 2006
Select relevant region from
http://www.hpa.org.uk/webw/HPAweb&HPA webStandard/Page/1202115502744?p=1202 115502744, click on link to the ‘New
Diagnoses�