East of England
A report commissioned by the East
of England Development Agency
Executive Summary 1
1. Introduction and background 7
2. Policy context 9
3. Financial exclusion in the East of England 22
4. Understanding financial capability 34
5. An assessment of service provision 42
6. Conclusions and recommendations 59
Acknowledgements 64
Bibliography 65
Appendix 1: Method statement 68
Appendix 2: Tables 78
Appendix 3: Maps 81
Appendix 4: Charts 86
Rocket Science UK Ltd 70 Cowcross Street London EC1M 6EJ T: 020 7253 6289
E: mark.morrin@rocketsciencelab.co.uk W: www.rocketsciencelab.co.uk
1
Executive Summary
Introduction
Financial exclusion imposes real costs not just on individuals and their families, but also on the communities and neighbourhoods in which they live and can be a significant barrier to employment and starting in enterprise.
Providing improved access to essential ‘basic’ services, including financial services and advice, is an increasingly important component of economic development. Within the region increasing the economic viability of employment and enterprise amongst the economically inactive and working poor will require a holistic approach to workforce
integration that incorporates housing, childcare, education and skills, health, employment and greater access to financial inclusion services.
Aims and objectives
This study explores the complex relationship that exists between financial exclusion, indebtedness and financial capability. The three key areas of this research are:
• To map and understand financial exclusion and indebtedness
• To assess current services and provision, highlighting promising practices, gaps or weaknesses, and future developments
• To look ahead at key drivers of change – national policy developments,
demographic, socio-economic, technological factors and trends that may impact on this agenda in future.
Policy Context
Financial exclusion is broadly defined as the inability of individuals to access mainstream financial products and services. However, the term can be used in different ways. The literature identifies that financial exclusion can result from a variety of barriers, including individual circumstances, geographical exclusion and self-exclusion. The Financial
Inclusion Taskforce has emphasised that the problem is not solely one of access and availability and have increasingly focused on the need to stimulate demand for appropriate services amongst excluded groups.
2 culture of not using financial advice services; a lack of trust in advice services; a lack of understanding of the value and relevance of advice services; a lack of knowledge about where to find advice and prohibitive costs of services. The Thoresen Review, established by government, has recently recommended an independent national Money Guidance service to address these issues. A large-scale regional pathfinder is suggested to help road-test this service.
Financial exclusion in the East of England
Financial exclusion has been analysed in relation to a set of variables about different financial products. The data has been supplied by CACI, a data management company, at the Lower Tier Super Output (LSOA) level. Of the 4.6 million working age people living in the East of England:
• 1,293,000 (28%) have no savings account
• 205,000 (4%) have no current account
• 624,000 (13%) have been refused credit in the past
• 1,332,000 (29%) have no home contents insurance, and
• 2,184,000 (47%) have no credit card.
It is not possible to identify which members of the general population have a combination of the different measures identified above. However, an area based approach allows for a composite ranking of financial exclusion. According to this method we can identify where financial exclusion is most concentrated. There are 624,400 people living in the 500 most financially excluded LSOAs in the East of England. This represents approximately fourteen per cent of the total working age population for the region.
Examination of the financial exclusion variables shows that they are highly correlated with one another. Those without a savings account, for example, are also unlikely to have home contents insurance. However, the gap between the regional average and the most excluded areas is greatest amongst those with no current account. In some areas over 20% of the population have no current account compared with 4% across the region. The distribution of financial exclusion is mostly concentrated in urban areas like Norwich, Luton, Basildon, Peterborough, Ipswich, Thurrock and Great Yarmouth. There are also a small number of rural areas that feature amongst the most financially excluded LSOAs. However, there is a greater proportion of the urban population living in the most
financially excluded areas. There is also a greater likelihood that LSOAs will be in urban areas as the degree of financial inclusion increases.
3
Understanding financial capability
Households in the East of England that exhibit higher levels of financial capability are more likely to save and less likely to resort to high levels of unsecured borrowing or sub-prime loans. They are also more likely to read the financial pages in the papers and know how much they have in their account at any one time. However, the relationship between attitudes (to saving and borrowing) and household income is complex, particularly at the local area level. Analysis at the regional level suggests that capability is most likely to be found in populations where median household income and levels of owner occupancy are higher than average.
The level of sub-prime take up, i.e. use of loans or mortgages provided by the sub-prime sector, is greater amongst couples with no children; lone parents; and those living in social housing. There are a higher proportion of households with sub-prime loans to
finance basic consumption needs than can be found in the mainstream market. Areas with low levels of sub-prime debt broadly correspond to areas of both high and low household incomes. Conversely areas with high levels of sub-prime borrowing correspond to median income households. While many of the identified geographical ‘hotspots’ for sub-prime markets can be found within and alongside more prosperous areas.
An assessment of service provision
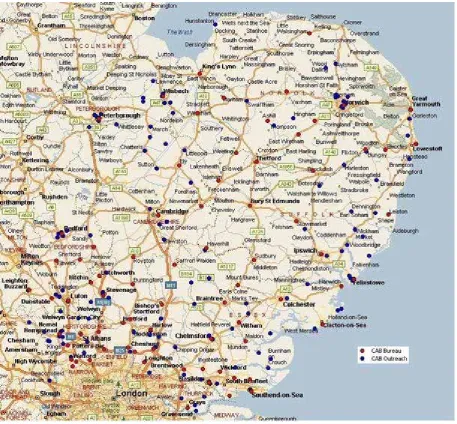
There are a number of organisations delivering money advice, financial services and financial capability training across the region. Services are delivered in a variety of ways and in a number of different locations. However, we have identified financially excluded areas which have limited or no provision in relation to independent money advice and financial services. These areas include;
• Wells-next-the-Sea
• Tilbury
• Lowestoft
• Peterborough
However, what our analysis of both service delivery and best practice shows is that partnerships are developing between organisations that aim to link individuals into different services and to capture and engage with hard to reach and vulnerable groups.
Conclusions
Financial inclusion and financial capability are conflated when discussing issues of savings and indebtedness. However, unlike financial inclusion, financial capability is not
4 There are a significant number of people in the region that remain excluded from the mainstream financial markets and services. Part of the solution, identified by
Government, is to stimulate demand for these services amongst excluded groups. At the same time independent agencies are reporting increasing difficulty by people trying to gain mainstream credit and huge increases in mortgage arrears and new debt problems. The increase in the volume and nature of the demand for financial advice will present a huge challenge for existing services. The solution will require a greater level of multi-agency working. In the case of financial inclusion this will mean improved integration of advisory services, particularly between Jobcentre Plus, Registered Social Landlords, and the independent advice sector (e.g. CAB). Addressing financial capability is likely to require new interventions to improve awareness, promote literacy, and sign post people to appropriate services.
Recommendations
Whilst these recommendations do not address all the nuanced issues of financial
exclusion and capability in the region they do provide a structure for targeting existing limited resources on the most financial excluded areas and groups and the identified
‘hotspots’ for financial capability where the potential return on investment is the greatest. It is recognised that action will need to be taken at the local, sub-regional and regional level by a range of different partners. We have identified EEDA in providing a key
leadership role at the regional level, particularly in championing this agenda and helping to facilitate some of the cross boundary issues that exist between different partners including local government, housing associations and service deliverers. Implementation will clearly be taken forward by other stakeholders and agencies.
1. We recommend that EEDA should form a regional task force to take forward and implement action to address the issues of financial inclusion and capability in the region. This study has identified that excluded households are key service users of Jobcentre Plus (welfare), Social Landlords (housing) and CAB (independent financial advice). We recommend that these partners should form the nucleus of the task force and be tasked with co-ordinating the strategic regional
infrastructure for the integration of services in the region and developing and taking forward the recommendations outlined below.
2. The Thoreson Review has recommended a large scale regional pathfinder to thoroughly road-test a national Money Guidance service. We suggest that EEDA, working with partners, should offer the East of England as the pathfinder region for this service.
3. The National Housing Federation has recommended in their response to HM Treasury’s Financial Capability Strategy (2007) that all RSLs should consider placing a dedicated financial adviser within their organisations to assist tenants. We suggest that RSLs work with CAB and other independent advisory services to provide frontline workers as part of an independent and impartial service.
5 4. The availability of affordable credit to complement financial and debt advice is
increasingly important in the region. While some of the more financially excluded areas in the region have available credit unions, there is a significant mismatch in the South West area of the Eastern region between some of the identified
capability ‘hotspots’ and credit union provision. 1It is recommended that EEDA
should work with the DWP Growth Fund, Local Authorities and ABCUL (Association of British Credit Unions Ltd) to influence the priorities in the region. This may facilitate the expansion of existing credit unions, or failing this the growth of new credit unions, to service this area.
5. This study has identified that in some postcodes in the region more than 20% of the population do not have current bank accounts. Having a current account is necessary for most financial transactions and therefore an essential component of financial inclusion. We recommend that the findings of this study, particularly those post codes with low levels of current accounts, are shared with all
mainstream banks and that they be encouraged to work with partners (e.g. CABs, RSLs) to help promote the take up of basic bank accounts in these areas and across the region.
6. Nearly 30% of all households have no home contents insurance. The correlation between rented accommodation and no home insurance is nearly 90%. It is recommended that RSLs should consider incorporating home contents insurance as part of their tenancy agreements. Smaller RSLs should look to partner with larger RSLs to off-set the set-up costs. Premiums could be kept low through using the combined purchasing power of RSLs in the region. Learning about how to best implement this approach should be based on the best practice examples identified in this report.
7. The Cashmachine Taskforce brought together LINK, banks, independent cash machine operators and consumer groups like the CAB to address the issue of fee-charging cash machine hotspots. It has subsequently drawn up a nationwide list of areas which do not have access to a free ATM. It is recommended that eeda and its partners work with the LINK to place free ATMs in the financially excluded areas in the region which currently do not have provision.
8. We recommend that the regional task force undertake a campaign to address financial literacy / capability in the region. This needs to be targeted on the places where people go to access services, including Jobcentre Plus, Health Centres, Colleges and other community facilities. Ideally this campaign would fit with a regional pathfinder for Money Advice, alternatively it should sign post users to existing services within the region.
1 This area, part of the doughnut effect around Greater London, is also identified in the Thoresen
6 9. The availability of services in rural areas is a key problem which will need to be
tackled by partners in the region. Efforts to address digital inclusion will clearly align with financial inclusion regarding services such as internet banking. There is, however, a proficiency issue – requiring training for users; an affordability issue – requiring free communal internet access points – and a demographic issue – there is an aging population in rural (and urban areas) where strategies to address digital exclusion are unlikely to make significant inroads. There is no easy answer to this problem that doesn’t cost a lot of money. We therefore recommend that any outreach provision, is appropriate and relative to the level of demand and the potential cost-benefit impact compared to other interventions.
10. We have identified that many migrant communities are concentrated in the most financially excluded areas and that many of these areas, such as Peterborough, have limited or no provision in relation to independent money advice and financial services. Although migrants from East European countries arrive in the UK with personal bank accounts and have high levels of financial capability, there are other communities from outside of the ‘Euro-Zone’ that may not be as financially included or capable and may be subjected to higher charges for the payment of remittances. We recommend that mainstream banking services are made more accessible to some migrant communities and that financial literacy (including awareness of products and services) should be embedded in ESOL, basic skills and other learning provision.
11. There is a tendency for the most financially excluded LSOAs to have higher proportions of their population in the younger age bands. The research literature has consistently identified elderly people (aged over 70), who are part of a cash only culture, as a key target group at risk of financial exclusion. However, there would appear to be evidence to support early intervention with young people. To a large extent the national curriculum is currently addressing this through
7
1. Introduction and background
This work could not be timelier, given the current credit crunch which is gripping the global finance markets and threatening to undermine the economic performance of the UK and the English regions. The East of England is one of the UK’s most successful regions and has overseen high levels of economic growth. However, there is evidence of significant disparities in economic performance across the region.
The regional economy is experiencing high growth rates in Gross Value Added (GVA) driven by high value industries and an increasingly competitive and highly skilled
workforce. This economic growth is leading to a rise in the cost of living, most evident in the housing market (rents and mortgages), which is making the region less affordable for the low waged and those on benefits.
This widening gap is leading to major disincentives for workless benefit claimants to enter the labour market, since low paid work does not significantly improve the financial
circumstances of many individuals and families. It is also contributing to increased
financial instability as issues surrounding affordability are leading many of those on lower incomes to increase their indebtedness to meet the cost of living in the region.
But there is a greater risk to the region and not only to those with poor credit histories and low incomes – sub prime borrowers – who are finding it increasingly difficult to get mortgages, personal loans or credit cards. This is a problem which faces the financially included and excluded alike. The literature and emerging discourse concerning
indebtedness and financial capability suggests that the relationship with exclusion is less clear. Indeed there are a much greater number of indebted individuals and households that are financially included (in terms of their access to a range of financial products) that will require different types of information and advice to address their needs.
The current climate presents a significant challenge to EEDA and its partners in maintaining overall levels of prosperity while ‘closing the gap’ between affluent and deprived areas.
People who are socially excluded in terms of income, access to services and a poor environment are likely to have their exclusion exacerbated by financial exclusion. Financial exclusion imposes real costs not just on individuals and their families, but also on the communities and neighbourhoods in which they live and can be a significant barrier to employment and starting in enterprise.
Providing improved access to essential ‘basic’ services, including financial services and advice, is an important component of economic development. Within the region
8
Aims and objectives
This study explores the complex relationship that exists between financial exclusion, indebtedness and financial capability. The three key areas of this research are:
• To map and understand financial exclusion and indebtedness
• To assess current services and provision, highlighting promising practices, gaps or weaknesses, and future developments
• To look ahead at key drivers of change – national policy developments, demographic, socio-economic, technological factors and trends that may impact on this agenda in future.
Method
The methodology is based on the financial inclusion study commissioned by SEEDA (2006). We have adapted the approach to address the particular requirements of this brief and to reflect learning from the South East study.
We have also provided an assessment of financial capability which has been informed by research conducted by the Personal Finance Research Centre (PFRC) at the University of Bristol. This approach has enabled an analysis of areas in the East of England and the degree of financial strain they exhibit.
We have sourced data from CACI to derive a measure of financial exclusion (based on the SEEDA study) and a data extract from the NOP/GfK Financial Research Survey to inform an understanding of financial capability in the region.
The supply of services in the region has been identified using data provided by
independent agencies and commercial databases. The scope of this provision, including the number and type of services, has been mapped using GIS software to assess the gaps between supply and demand.
In addition we have conducted a review of recent policy and research literature, and conducted a range of interviews with key stakeholders in the region.
9
2. Policy context
The following section provides a review of the recent literature relevant to this study. The review highlights recent policy developments in response to the research evidence about why people do not currently access financial services and advice. The aim of this review is to strengthen the understanding of the broader financial exclusion agenda and how
partners in the East of England region can effectively reach and serve their customers.
2.1 Financial exclusion
‘Financial exclusion’ can be broadly defined as the inability of individuals to access mainstream financial products such as bank accounts and low cost loans. According to the Government’s 2004 strategy to tackle financial exclusion, ‘Promoting financial inclusion’, the term ‘financial exclusion’ is used in different ways. It can be a broad concept related to a lack of access to a range of financial services or a narrow concept reflecting particular circumstances such as geographical exclusion. Self-exclusion is also important – where an individual believes there is little point in applying for a financial product because they expect to be refused or where individuals are locked into a cash economy.2
The literature on the financial exclusion of individuals and businesses in the UK recognises that it can occur as a result of a variety of barriers, including:
• Lack of physical access;
• Cost of products and services;
• Conditions attached to products and services that make them inappropriate;
• Language of marketing and sales being targeted at other groups;
• Mistrust of banks and other providers of financial services;
• Attraction of alternatives;
• Risk avoidance strategies of working in cash;
• Lack of literacy skills or numeracy skills;
• Confusion about range of financial products and services on offer; and
• Socio-cultural factors and generational habits.
These aspects of exclusion are not mutually exclusive. They will overlap and reinforce each other, resulting in individuals, households and communities having little or no connection to mainstream banking and financial services.
Barriers to financial inclusion can occur on the demand side (e.g. lack of literacy skills or numeracy skills) or on the supply side (e.g. conditions attached to products and services that make them inappropriate). The financial inclusion agenda has in recent years increasingly focused on the demand side, with the Financial Inclusion Taskforce recognising that “the problem of financial exclusion is not solely one of availability of products or practices of providers” and that there is a “need to stimulate demand for
2 A survey conducted by BMRG for the Financial Inclusion Taskforce identified that unbanked
10 appropriate banking services and credit products amongst financially excluded groups, and to equip individuals to make the most appropriate choice for themselves.”3
As outlined in ‘Financial Inclusion: The way forward’4 the Government’s three goals are
that:
• Everyone should be able to manage their money effectively and securely, through having access to a bank account, and the confidence and capability to get the most from it;
• Everyone should be able to plan for the future with a reasonable degree of security. Therefore, affordable credit, saving accounts and simple insurance products should be available to all who need them; and
• Everyone should have the information, support and confidence they need to prevent avoidable financial difficulty, and to know where to turn if they do find themselves in financial distress.
The table below summaries the Government’s priorities for action to meet these goals, addressing both supply and demand issues.
The government’s first financial inclusion strategy launched in 2004 included a £120 million Financial Inclusion Fund focused on helping people to obtain access to a bank account, affordable credit, and free money advice. To advise the Government and monitor progress it also established an independent Financial Inclusion Taskforce. In the Comprehensive Spending Review in October 2007, the government allocated a further £130 million to financial inclusion along with an action plan and extended the life of the Financial Inclusion Taskforce to cover the period 2008-11.5
3 http://www.financialinclusion-taskforce.org.uk/principles.htm 4 HMT (2007) Financial Inclusion: The Way Forward, March
11
Rural exclusion
In 2006, the Commission for Rural Communities (CRC) reviewed the evidence around rural disadvantage – including financial disadvantage.6 The CRC defines disadvantage as
“an inability to participate fully in society” and sees this inability as determined by more than simply resources, but also by access to opportunities and services. The
Disadvantage Study notes that it is difficult to measure disadvantage in rural areas – particularly because standard metrics emphasise concentration which, in rural areas, will always be less visible than in urban locales. Nonetheless, the Disadvantage Study found that many groups in rural areas are disadvantaged in a variety of ways.
One of the twelve disadvantage ‘headings’ highlighted by the CRC’s Disadvantage Study was ‘Financial disadvantage’. The study found clear evidence in rural communities of both low incomes and wider forms of financial exclusion. For example, the CRC has highlighted that only around one in eight banks and building societies are in rural areas, though a fifth of the population live there. Similarly, under a tenth of cashpoints are in rural areas, with fewer of these free to use ─ around 45% compared to 60% in urban areas. This poor access to services manifests itself in the statistic that 300,000 people in rural areas do not have a bank account, while 22% of rural households live in poverty. Moreover, access to financial services may be getting worse in rural areas. The CRC has produced evidence to suggest that the accessibility of banks and building societies has reduced in rural areas, alongside a trend towards fee-charging cash machines.7
Specific groups were found to be particularly vulnerable, including older people, migrant workers, those with no/low qualifications, those used to operating in a cash-only economy and those that are self-employed. Some of these groups, such as older people and those with disabilities, may find it harder to obtain access to face-to-face advice (which could be more effective than other forms of advice for the financially excluded), particularly if they do not have access to transport, and live in remote rural areas.
The New Policy Institute (NPI) has highlighted the presence of these problems of social exclusion – including financial exclusion – in rural areas in the East of England. It found that although rural East of England is, on average, more affluent than many other parts of the country, it still has significant numbers of people living on low income. An
estimated 400,000 people in rural East of England are living in households with incomes below the low income threshold that the Government uses in measuring progress on its income poverty objectives. Of these, around 100,000 are children, 100,000 are
pensioners and 200,000 are of working age. Furthermore, these statistics do not take account of the local cost of living which is likely to be higher in East of England than in some other parts of the country.
The NPI also found that low income in rural East of England is not just about lack of paid work, it is also about low pay and poor educational attainment. Excluding the pensioners, around 100,000 of those in low income are in workless households but 200,000 are in households where at least one of the adults is in paid work. A fifth of employees in rural East of England earn less than £250 per week. Around 50,000 people in rural East of England are officially unemployed; a further 50,000 of those aged 25 to retirement do not
12 work but do not qualify as officially unemployed and, when surveyed, say that they want paid work. The largest group of these are people with a limiting longstanding illness.8
At both a national and a regional level, therefore, financial exclusion is recognised as a problem in rural areas. A report for CRC by SQW in November 2007 explored the success of schemes to tackle financial exclusion specifically in rural areas.9 The study pointed to
difficulties in maintaining and setting up financial services in rural communities. Examples of financial services which are scarce already or under threat of becoming scarce in rural areas include:
• Post office branches provide a range of banking services, which are particularly important for certain disadvantaged groups who would have difficulty travelling, including older people, those without their own transport, people on low incomes and people with a disability. However, the programme of closing post offices means that some rural communities will be threatened with the loss of a vital resource and an increasingly important means of addressing financial exclusion.
• Credit unions in rural areas face substantial challenges linked to growth and
becoming financially sustainable. Operating in a sparsely populated area, they find it difficult to reach the critical mass of membership base and available funds that would make it possible for them to employ full-time staff. Rural areas are also associated with increased time and travel costs for volunteers to oversee the ‘collection points’, and a scarcity of local banking facilities, which can make the collection and transfer of cash difficult. Furthermore, rural credit unions are often not of a sufficient size to offer other services, such as using PayPoint for paying-in.
• Face-to-face financial advice is not offered in some rural areas for several reasons. One of these is a perceived lack of demand: the extent of rural need is largely
‘hidden’, and in one case study came to light only in response to actively going into new areas which previously had not had ready access to advice services. The extra expense incurred in service delivery in rural areas and the need to meet targets
(which is much easier in urban areas with a higher density of population) also make it difficult to make a business case for the provision of more financial advice in rural areas. However, one of the 16 projects in the Financial Inclusion Fund’s Face-to-Face Debt Advice Programme focuses specifically on providing financial and debt advice through rural Citizens Advice Bureaux. Using the Ely CAB as a case study, SQW found that the rural fund allows case-workers to meet unmet need in rural areas, and the project also reduces waiting times for advice in these areas – often a critical factor in success.
While the case studies in the SQW report emphasise the good practice that is going on in some places across the country, the study also reiterates the extent of the difficulties in establishing financial inclusion programmes in sparsely populated rural areas like those in the East of England. As a result, the focus of many schemes and policy initiatives to tackle financial exclusion to date has been on specific (mostly urban) areas, at least in the initial stages.
8 New Policy Institute (2004), Poverty and Social Exclusion in rural East of England
13
2.2 Financial capability
With the recent emphasis on tackling the demand side of financial inclusion, policy and thinking has been increasingly influenced by the concept of financial capability. This is reflected in the CSR 2007 ‘Fairness and Opportunity for All’ and the different emphasis which is placed on savings, financial capability and inclusion. ‘Financial capability’ (which has largely displaced the narrower concept of ‘financial literacy’) refers to “people’s knowledge and skills to understand their own financial circumstance, along with the motivation to take action.”10
Therefore, this model of financial capability rests on three interrelated elements of an individual’s ability, defined by the Personal Finance Research Centre11 as:
• Knowledge and understanding;
• Skills; and
• Confidence and attitudes.
The dominance of this broader concept of financial capability as a policy issue in the financial inclusion agenda has reflected the growing financial pressures and personal responsibilities placed on people across the UK, which necessitates a wider financial ability than ‘literacy’. As the literature on the topic recognises, these pressures and responsibilities include:
• Costs of higher education: young people have to bear more of the cost of their education and routinely borrow far larger sums of money than previously;
• Changing pattern of pension provision: people are having to take more
responsibility for saving for their retirement as the number of defined benefit (‘final salary’) pension schemes sharply decreases and as growing numbers of elderly people live at a distance from their families;
• Changing labour market: people are having to take more personal responsibility for planning their own finances as they experience less regular work patterns;
• Complexity of financial services market: people are faced with an often bewildering choice of financial products in a fast-paced market and many find it
difficult to understand the terminology around these products and the risks associated with them; and
• Changing attitudes towards saving and debt: people rely more and more upon debt to manage personal finances and many people have no savings at all.
Despite financial capability being increasingly important in the current financial
environment, the overall UK population does not sufficiently display the knowledge, skills and attitudes that make up this capability. A survey for the Financial Services Consumer Panel in 2000 showed that only 45% of people considered themselves financially literate and only 38% were confident about making their own financial decisions.12 Moreover, in
2006, the largest UK survey ever undertaken of financial capability13 found many people
that:
10 HM Treasury (2007), Financial capability: the Government’s long term approach
11 Personal Finance Research Centre for the Financial Services Authority (2005), Measuring financial capability: an exploratory study
14
• Fail to plan for the future: 70% of those questioned are making no personal provision to cover an unexpected drop in income;
• Are not financially prepared for retirement: 81% of the pre-retired think that a state pension will not provide them with the standard of living they hope for in
retirement but 37% of these people have not made any additional pension provision;
• Struggle to make ends meet: 1.5 million people say they are falling behind with bills or credit commitments (of which 500,000 say they have real financial problems), and almost three million more people (or two million households) say it is a constant struggle to keep up with commitments;
• Do not shop around to choose the best financial product: 33% of people, who hold no more complex products than general insurance, bought their policy without comparing it to even one other product;
• Do not understand the risks associated with financial services: 40% of people who own an equity ISA are not aware that its value fluctuates with stock market performance, and 15% of people who own a cash ISA think its value does; and
• Are ‘unduly optimistic’ about their financial situation: for example, 45% of those who said that they would be able to make ends meet if faced with a large drop in income had made no actual provision.
Significantly, it was found that these characteristics apply to people on higher incomes as well as those on lower incomes:
• People who struggle to make ends meet include many earning average or even above average income;
• Plenty of higher earners are not doing well at planning ahead; and
• People on higher incomes are slightly more likely to be less capable at keeping track of their finances, sometimes because they have the luxury of an income which
comfortably exceeds their outgoings.
Other reports have emphasised the particular difficulties faced by people earning lower than average incomes14 but the FSA survey reminds us that there is a need to improve
financial capability across the whole income spectrum.
This idea is supported by the approach taken by the Thoresen Review, set up by the government in January 2007 to explore how Generic Financial Advice (GFA) can be
provided across the UK. The report, published in March 2008, included a segmentation of the potential market and recommended a national Money Guidance service.15
The Thoresen Review identified 7.5 million people who were “most vulnerable” along with a further 11.7 million who could be regular users of the service. The definitions of
“vulnerability” were based on 17 indicators derived from the FSA’s baseline survey of financial capability. With this non-income-based methodology, the Review did however find that the 7.5 million most vulnerable people had average incomes of 60% of the
14 MORI for the Basic Skills Agency (2003), Basic Skills and Financial Exclusion; National Consumer Council (2004), Mind the financial gap: Access to financial services
15 national average, while the 11.7 million regular users had on average incomes slightly lower than national average but approximately 5% had higher incomes.16
Unlike financial exclusion, financial capability is not necessarily correlated with areas of high deprivation. This is reflected in profiling research conducted by the Personal Finance Research Centre (PFRC) at the University of Bristol. In a recent report published by
PFRC, researchers “used a statistical technique called cluster analysis to segment the UK’s population according to the degree of financial strain they exhibited”.17 The PFRC
analysed data reflecting several key financial characteristics ranging from levels of unsecured borrowing to individual attitudes to money. The research concluded that the UK population is comprised of five distinct groups, including:
• Financially sound – This represents 60% of the population who show no real signs of financial strain. People belonging to this grouping tend to owe little money, be older (usually past retirement age). Their attitude to money is prudent and they tend to be “cautious of money managers”.18
• Managing reasonably well – It is thought that 25% of the population fall into this category. With a median monthly income of £1,700, it has the highest median income of all the groups. People belonging to this group tend to be well-educated and have little or no unsecured credit commitments. Of all the groups, this group “had the highest number of two-earner households”.19
• Showing financial stress – With a median monthly income of £1,400 and a high proportion of people aged below 40 years old, this group is set to account for 9% of the population. This group has the second highest education attainment levels and the highest proportion of people in full time education. The research found that members of this group tend to be “spenders and impulse buyers, often in constant overdraft and with high levels of unsecured lending and mortgage borrowing”.20
• Struggling on low-income – Representing 6% of the population, this group has the lowest median monthly income (£780). Over 60% of households in this group had members not in employment and a high proportion of people not working because of sickness or caring for a family member. This group has the lowest educational
attainment and includes the highest number of social housing tenants and lone parents. This group shows markedly low levels of unsecured credit usage, loans or mortgage borrowing, crucially say the researchers, because of limited access to these financial products.
• Over-indebted – Representing 2% of the population, this group admits to being spenders, impulse buyers and heavily dependent on the use of credit. Two-thirds of this group are under 40 and have dependent children. Members of this group have heavy unsecured loan commitments and little or no savings. The group includes the highest number of people not working through illness or disability, despite having above average rates of households headed by someone in work. 21
16 Jackie Wells Consulting, Thoresen Review of Generic Financial Advice: Interim Report Annex I: Target Market Analysis for GFA
17 Kempson, E. & Atkinson, A. (2006) “Overstretched: People at Risk of Financial Difficulties” PFRC: Bristol 18 Ibid
16
2.3 Financial advice
Financial advice is recognised as a key component in any scheme to tackle the
weaknesses in financial capability that has been identified. It is also one of the biggest gaps in current financial capability provision in the UK as a whole. The UK Government recently acknowledged that that there is “a gap in the market” around generic financial advice and “a clear case for developing a national approach”.22
Different types of financial advice
Financial advice falls into three broad categories. The boundaries of these categories are often blurred and it is useful to refer to the Resolution Foundation’s typology:23
• Regulated advice: advice relating to specific products or providers falls under the FSA’s regulatory regime. It is provided through the market by financial services companies, independent financial advisers or other intermediaries (these
arrangements are currently being examined by the FSA’s Retail Distribution Review).
• Debt advice: also known as ‘money advice’, a number of organisations including Citizens Advice, National Debtline and the Consumer Credit Counselling Service provide specialist advice for people with debt problems.
• Generic advice: advice and guidance given in light of people’s individual circumstances which helps them understand their financial needs, identify their options and take appropriate action. As it stops short of making recommendations about particular products or providers, generic advice does not fall under the FSA’s regulatory regime.
Across the UK, there is a well developed network of organisations providing crisis or debt advice but there are widely acknowledged gaps in provision of generic advice, which aims to raise people’s financial capability before they reach the crisis point that causes them to seek debt advice.
2.4 Reasons why people do not access financial advice
The literature points to a number of factors that are particularly important when considering why people fail to access financial advice services.
Culture of not using advice services
People will often consult informal sources (friends, colleagues, family members, and trusted magazines and newspapers) in preference to professional advisers. For example, the FSA has found that, when purchasing financial products, 42% of people rely only on product information and/or advice from family and friends; one in five do not seek any advice at all.24
22 HM Treasury (2007), Financial capability: the Government’s long term approach 23 Resolution Foundation (2007), In brief: Financial Capability
17 Similarly, in a survey for IFA Promotion25, 39% of people said that they would go to a
high-street bank or building society and 19% said that they would ask friends or relatives for financial advice. Only 10% of respondents said that they would go to an Independent Financial Adviser.
Lack of trust in advice services
The FSA has suggested that this culture of not using advice services may stem partly from a lack of trust. Some people assume that a financial adviser will just try to sell them a product, and are unaware that many independent financial advisers can provide generic financial advice.26 This assumption is supported by research recently undertaken for the
Thoresen Review.
“The responses to the Call for Evidence and the Review’s own research have shown some wariness towards the financial services industry. The effect of low levels of trust in financial services contributes to the lack of engagement. Some of the public’s reluctance to trust the industry stems from a perception of disappointing past performance of investment
products, some poor experiences of claiming on protection products and past high-profile mis-selling episodes.”27
The issue of trust was also recognised as vital by a report evaluating a pilot project of joint working between Citizens Advice Bureaux (CAB) and Independent Financial Advisers (IFAs) offering generic financial product advice for people on low and middle incomes:
“The report confirmed the high level of trust that people have in the CAB service and the value that they place on the impartiality of the advice given. Within the financial services industry it is recognized that IFAs do not share the same level of trust for historical reasons.”28
The pilot project aimed to combine the expertise of IFAs with the ‘brand’ that CAB have within the community to increase consumer confidence and trust in the IFA sector. It tested 3 different models of joint working and found that users were more likely to act upon the advice that they were given if they saw an IFA within the bureau rather than being referred to see an IFA in their own office.29
Lack of understanding of the value and relevance of advice services
The culture of not using advice services is also due to the lack of widespreadunderstanding of the value and relevance of advice services. This was highlighted by an IFA in the CAB joint working pilot project, who said that key to people seeking advice was “the value that people placed on financial advice. Although cost was the key issue for
25 IFA Promotion (2004), Omnibus Research
26 FSA (2005), Advice and the best way of delivering it: Literature survey for the Financial Capability Generic Advice project
27 Otto Thoresen (2007), Thoresen Review of Generic Financial Advice: Interim Report 28 Bob Widdowsen for Citizens Advice (2005), Financial advice pilot project: evaluation report
18 most enquirers for some this was not the only question. Giving sufficient priority to
obtaining financial advice was also an issue.”30
People on low to median incomes often find the language of financial advice off-putting. Many on lower incomes are sceptical that such advice is relevant to them, especially since they associate financial advice with saving and investing, and having the surplus cash necessary for these activities.31 As the CAB/IFA evaluation report pointed out, “the
advice and information needed by this group may need to encompass issues such as credit, debt, tax credits and social security benefits, as much as savings, investments, mortgages, insurance and pensions.”32 Mainstream financial advice does not market itself
as catering to these needs.
Yet financial advice is clearly valuable and relevant to consumers at all levels of income. The Resolution Foundation has suggested that increased access to financial advice could leave people on low to moderate incomes up to £60,000 better off by the time they reach 60 years of age.33
Moreover, when a person gains financial advice that helps them to shop around for better financial products, the personal benefits can be immediate. Research by the FSA showed that the typical consumer can save between £70 and £710 a year by making better financial product choices.34 Research for IFA Promotion shows that once people have
actually experienced independent financial advice, they are generally very satisfied.35
The challenge is to communicate these benefits to the target market so that they realise the relevance and value of financial advice to them. In order to encourage a greater take-up of services, any financial advice programme needs to be effectively marketed using language which appeals to people on low to median incomes, as well as those on higher incomes.
Lack of knowledge of where to get advice
The FSA has suggested that even when people are aware of the need to get advice, they do not know where to get it.36 One of their studies found that 20% encountered
problems in connection both with the availability of and need for advice.37 Many people
are not aware of the advice services that are available to them, even though they may be enthusiastic users of services once they are made aware of them and some are even willing to pay for advice.
30 Bob Widdowsen for Citizens Advice (2005), Financial advice pilot project: evaluation report
31 FSA (2005), Advice and the best way of delivering it: Literature survey for the Financial Capability Generic Advice project
32 Bob Widdowsen for Citizens Advice (2005), Financial advice pilot project: evaluation report 33 Resolution Foundation (2006), A national dividend: the economic impact of financial advice
34 FSA occasional paper series 19 (2002), Losing interest: how much can consumers save by shopping around for financial products?
35 IFA Promotion (2004), Enquirer Research - report of findings
36 FSA (2005), Advice and the best way of delivering it: Literature survey for the Financial Capability Generic Advice project
19
Cost of advice services
There has been little substantial research focussing on whether cost is a factor that discourages the general population from accessing generic financial advice. As the FSA has pointed out, “Affluent consumers who engage the services of financial planners are clearly willing to pay for generic financial advice. But there doesn’t seem to be any research into the willingness of consumers generally to pay for generic financial advice.”38
However, there has been some research into the effect of cost on consumers accessing regulated advice. Research undertaken for the FSA in 2003 into initial disclosure reported that “It was a surprise to some of the less financially sophisticated respondents that some firms charged a fee for advice - some of these respondents stated that they would never consider going for advice if a fee was charged.”39
Similarly, the evaluation report of joint working between Citizens Advice Bureaux and IFAs found that “Previous contact with IFAs was rare among the enquirers. For most this was a question of affordability but not always.”40 Even after they had been introduced to
an IFA through a Citizens Advice Bureau and received free generic financial advice, only 6 out of 244 enquirers are recorded as going on to make subsequent fee-paying
appointments with the IFA. One reason given for the figure being this low was that many people on low to medium incomes cannot afford to pay for further advice. They are also more vulnerable to emergencies and cash crises which affected their long-term
engagement with an IFA.
A further indication of how willing people might be to pay for advice is given by
comparisons with other non-financial advice services like Consumer Direct, NHS Direct, and Community Legal Advice. In most cases, the only cost to the consumer of these services is that of the phone call or connecting to the internet. A pilot study that preceded the national launch of Community Legal Services Direct found that telephone advice is cheap enough at local rate call for the cost of calling it not to be an issue.41 This
suggests that more expensive advice could put consumers off accessing the service. A survey carried out by McKinsey & Co found that only 25% of those on low to median incomes would be willing to pay a small fee for a generic financial advice service.42
Similarly, a focus group evaluating the AXA Avenue project in Brighton found that only 3 out of 10 households who had received free access to an independent financial adviser as part of the programme would pay for advice from an IFA in the future, despite the fact that access to the IFA had made the 10 households collectively £50,000 better off over 12 months.43
Furthermore, the issue of paying for independent financial advice is compounded for people on low to medium incomes because the level of business they might bring to an IFA would not be of commercial interest and therefore they are not targeted by advisers.
38 FSA (2005), Advice and the best way of delivering it: Literature survey for the Financial Capability Generic Advice project
39 FSA (2003), Consumer Research 17 – Initial disclosure documentation research
40 Bob Widdowsen for Citizens Advice (2005), Financial advice pilot project: evaluation report
41 Legal Services Commission (2004), Improving access to advice in the Community Legal Service – Report on Evaluation Research on Alternative Methods of Delivery
42 Resolution Foundation (2006), Closing the Advice Gap
20 Affordable Credit
In addition to financial and debt advice, affordable credit, savings and insurance help people plan for the future and manage short-term fluctuations in income and expenditure. They provide a financial buffer against a range of short-term contingencies, both known and unknown. Those without access to these products are often forced into using high-cost credit, such as home credit, pawnbrokers or mail order catalogues (see box below).
The use and cost of non-mainstream credit44
As part of its recent investigation into the home credit market, the Competition Commission has published findings on usage and estimated cost of non mainstream types of credit..17
Home credit companies, also referred to as doorstep lenders, lent £1.5 billion to around 2.3 million
customers in 2004. Loans, usually for several hundred pounds, are repaid in weekly instalments (typically £10-25) through agents. APRs vary from around 150 per cent to 500 per cent for short-term loans; customers typically pay a total cost of credit of between £40 and £80 per £100. The Competition Commission recently concluded that the consumer detriment of high prices is substantial, and made a number of recommendations to increase competition.
Agency mail order is one of the most popular sources of credit for those on low incomes – research
shows that in 2004, over 20 per cent of low-income households had used this type of credit.18 Weekly or monthly repayments are made through agents. Agency mail order credit can be advertised as ‘interest free’ but prices for goods can be far higher than from high street outlets.
Pawnbrokers are used by about 600,000 customers a year, who are required to deposit an item of value
as security for a loan. The majority of loans are for a six-month redemption period, with interest rates of seven to 12 per cent a month. A loan of £200 over four months would cost around £56. An estimated 29 per cent of customers fail to recover the pawn.
Cheque cashers may advance money against a borrower’s cheque. Charges vary from £6 to £14 for a
£100 cheque. There are around 400 cheque cashers in the UK with 1,500 outlets.
Sale and buy-back is a service offered by some lenders whereby the customer sells an item to the lender
and can then buy it back at a higher price within a short period of time. There are more than 100 outlets in the UK, often combining sale and buy-back with pawn broking and cheque cashing services.
Rental purchase shops allow customers to spread the cost of buying goods, either by paying in weekly
instalments or monthly by direct debit. The advertised APR is normally around 30 per cent, however the good is often more expensive than on the high street. Customers are also strongly encouraged to take out insurance, which will add to the cost of the loan. The largest provider has over 130 stores.
In addition to these legal non-mainstream sources of credit, a minority of people are forced to resort to borrowing from illegal lenders. Research 19 has estimated that there are some 165,000 UK households using illegal lenders, concentrated in areas of high crime and social problems that are often not served by legal home credit lenders. Borrowers on average pay a total cost of credit of £185 per £100 borrowed, and APRs can run into several thousand per cent. Late or missed payments are frequently punished with disproportionate and often arbitrary charges, and the use of intimidation and violence to elicit payment are common.
Third sector lenders have been identified as key players in delivering the Government’s objective to promote improved access to affordable credit. The Financial Inclusion Action Plan notes that whilst progress has been made, coverage remains incomplete and the key challenge is to increase the coverage and capacity of credit unions and CDFIs so that they are able to provide affordable credit to excluded consumers nationwide.
21 The DWP Growth Fund has been fully operational since July 2006. In that period, more than 46,000 loans have been made, totalling over £20 million. 85% of these have reached low income individuals in the areas of highest financial exclusion.
Supply and demand mapping of third sector affordable credit commissioned by the Financial Inclusion Taskforce's working group on third sector credit shows that there are 25 "red alert" areas, and a further 56 "amber" areas, with very high or high levels of under-served demand for affordable credit.
To address this mismatch the Working Group recommended a doubling of the capacity of the third sector in order to provide affordable credit to 150,000 financially excluded customers a year, and to extend coverage into 25 priority under-served areas. To deliver this increase, the Government has agreed to continue to support the DWP’s Growth Fund initiative, with £38 million of funding from the Financial Inclusion Fund. This funding will go towards supporting the revenue and capital funding requirements of existing
performing Growth Fund lenders, including continuing support for training needs within third sector lenders, as well as providing capital to new lenders established in priority areas. The banks have also committed to support third sector affordable credit, including actions to develop new provision in the 25 high priority areas.
2.5 Summary
Financial exclusion is broadly defined as the inability of individuals to access mainstream financial products and services. However, the term can be used in different ways. The literature identifies that financial exclusion can result from a variety of barriers, including individual circumstances, geographical exclusion and self-exclusion. The Financial
Inclusion Taskforce has emphasised that the problem is not solely one of access and availability and have increasingly focused on the need to stimulate demand for appropriate services amongst excluded groups.
22
3. Financial exclusion in the East of England
This section provides a measurement of financial exclusion in the region, mapping the geographies of exclusion and identifying some of the characteristics of excluded
individuals and groups.
3.1 The five measures of financial exclusion
The key variables for measuring financial exclusion, which were identified in the South East Study for SEEDA, include individuals and households with:
• No savings
• No current account
• Difficulty in accessing affordable credit
• No home contents insurance
• No credit card.
Data for the five variables, as well as median household income and population count were supplied at Lower Tier Super Output Area (LSOA) level by CACI.45 This covered all
3,550 Eastern Region LSOAs. Of the 4.6 million working age people living in Eastern region:
• 1,293,000 (28%) have no savings account
• 205,000 (4%) have no current account 46
• 624,000 (13%) have been refused credit in the past
• 1,332,000 (29%) have no home contents insurance, and
• 2,184,000 (47%) have no credit card.
The five variables were converted to proportions, using the LSOA population counts, to indicate the share of each LSOA population with no savings account; no current account; no home contents etc. Examination of the financial exclusion variables shows that they are highly correlated with one another, so that, for example, areas where a relatively high proportion of the working age population have no current account are also likely to have a relatively high proportion with no savings account or no home contents insurance. See Table 1 in Appendix 2.
When the variables were ranked and charted across the range of LSOAs they all produced similar characteristics – a reclining S shaped distribution - similar to that for ‘proportion with no savings account’ shown in Chart 1 below.
45 CACI is a data management company providing demographic and market information for the United Kingdom and Europe.
46 The type of current account, or number of multiple accounts, held by individuals are not identified by CACI.
23 Chart 1: No savings accounts
Percentage of the population in Eastern Region's 3,550 Lower Tier Super Output Areas with no savings account
0% 10% 20% 30% 40% 50% 60% 70%
0 500 1,000 1,500 2,000 2,500 3,000 3,500 4,000
Number of Lower Tier Super Output Areas
% of popu la tion i n eac h LS O A w ith no s av in gs ac coun t
This distribution shows a small number of LSOAs with very low proportions of their populations with no savings account and a small number at the other extreme, with very high proportions of their population with no savings account. The upper part of the ‘S’ curve represents the 500 most excluded LSOAs. The highest LSOA contained over 60% of its population with no savings compared with an average across the region of 28%.
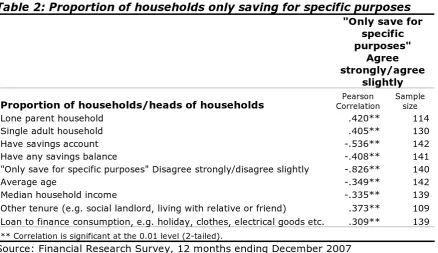
Correlations were carried out for each exclusion variable in turn and these are shown in Appendix 4. The single variable showing the highest degree of correlation with the rest is the proportion of the population with no current account. This variable together with household income was also correlated against LSOA level IMD2007 income deprivation scores for the region. As expected the degree of correlation was high as can be seen in Table 2 in Appendix 2.
3.2 A composite measure of exclusion
Analysis was also carried out using a composite exclusion measure. In order to aggregate the five financial exclusion variables they were each ranked across all LSOAs from 1 to 3,550. The five ranks were then averaged and the average rank was used for mapping (Appendix 3, Map 2). However, a composite of all five variables distorts the distribution of financial exclusion across LSOAs since no single LSOA ranks highest or lowest for all five variables.
24 In addition public policy has given emphasis to the current account. Without a current account it is difficult to conduct most of the financial transactions taken for granted in modern society. Most utilities offer discounts for payment by direct debit – impossible without a current account. Having a current account is an important aspect of credit checks for mortgages, loans and credit – even in the subprime market (with the exception of the provident). Most mortgage providers insist on direct debit payments as do providers of other kinds of loans and credit. Increasingly, wages and particularly benefit income can only be paid into a current account; often employers will not employ somebody unless they have a current account. Research also shows that the costs to individuals of being unbanked rise as the number of unbanked people falls.47 This variable
was therefore considered to be an essential component in exclusion.
Our composition variable was therefore formed by taking the most excluded 500 LSOAs according to each of the five exclusion variables and identifying the LSOAs which figured in the top 500 for all five variables. This resulted in:
• 224 LSOAs having all five measures
• 94 LSOAs having four measure including ‘no current account’
• 64 LSOAs having three measures including ‘no current account’
• 73 LSOAs having two measures including ‘no current account’, and
• 41 having ‘no current account’ only.
This process gave us 500 financially excluded LSOAs graded from one through to five. Five being those LSOAs where all the financial exclusion variables were ranked in the most excluded 500. These excluded LSOAs cover 624,400 working age residents comprising 13.5% of the East of England population.48
3.3 The geography of financial exclusion
Having settled on a composite exclusion measure, the next step was to map it so as to discover the distribution of financial exclusion across Eastern England. Figure 1, below, shows pockets of exclusion concentrated in mostly urban areas:
• Norwich
• Luton
• Basildon
• Peterborough
• Ipswich
• Thurrock, and
• Great Yarmouth.
47 Policy level responses to financial exclusion in developed countries: lessons for developing
countries, Personal Finance Research Centre, May 2006).
48 This is not to say that there are 624,400 financially excluded people living in the East of
25 However, there are also a number of rural areas that feature amongst the most financially excluded LSOAs. This includes, for example, single LSOA in rural areas of Rochford and Three Rivers. We discuss the urban/rural morphology further below.
Figure 1: Financial exclusion in the East of England
Financial exclusion and household income
26 incomes are to the north of the region and around the coast. Financial exclusion is
virtually the inverse of this, with the highest levels of financial exclusion to the north of the region and around the coast and the lowest levels around the main London commuter routes.
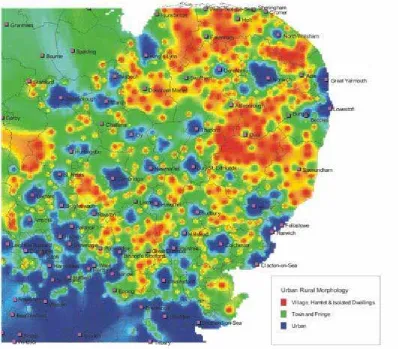
Urban/Rural morphology
We have categorised the financially excluded LSOAs by standard urban/rural morphologies (Urban with populations greater than 10,000; Town and Fringe; Village, Hamlet & Isolated Dwellings). The results are shown in Chart 2 below.
Chart 2: Urban/Rural morphology of financial exclusion
0% 10% 20% 30% 40% 50% 60% 70% 80% 90% 100%
Urban > 10K Town and Fringe Village, Hamlet & Isolated Dwellings
Morphology
P
e
rc
e
n
ta
ge
of
L
S
O
A
s
Most financially excluded LSOAs All other LSOAs
In population terms the number of people living in the most financially excluded ‘Urban’ LSOAs is 583,800; the number living in the most financially excluded LSOAs in ‘Town and Fringe’ areas is 39,400 and the number living in LSOAs classified as ‘Village. Hamlet & Isolated Dwelling’ is 1,220. This means that 93.5% of people living in the most financially excluded LSOAs live in urban areas. In those LSOAs not among the most financially excluded two thirds live in urban areas with the remainder divided roughly equally between ‘Town and fringes’ and ‘Village, hamlet, isolated dwelling’.
27 Chart 3: Urban/Rural morphology by degree of exclusion
0% 10% 20% 30% 40% 50% 60% 70% 80% 90% 100%
Urban > 10K Town and Fringe Village, Hamlet & Isolated Dwellings
Morphology
P
e
rc
e
n
ta
g
e
of
LS
O
A
s
No current account only No current account + 1 other No current account + 2 others No current account + 3 others No current account + 4 others
There are significantly greater numbers of financially excluded people in urban areas. However, the analysis has identified a small number of LSOAs in rural areas where the degree of exclusion is as severe as some urban areas. (See Table 3 in Appendix 2 which presents all LSOAs ranked by degree of exclusion). Of those financially people living in rural areas in the East of England:
• 169,539 have no savings account (none in the most excluded 500 LSOAs)
• 22,713 have no current account (98 in the most excluded 500 LSOAs)
• 79,638 have been refused credit in the past (199 in the most excluded 500 LSOAs)
• 168,475 have no home contents insurance (937 in the most excluded 500 LSOAs) and
• 340,279 have no credit card (15,407 in the most excluded 500 LSOAs).
The urban/rural morphology presents a different set of policy and service delivery challenges which we address later in the report.
3.4 Characteristics of the most financially excluded areas
Financial exclusion variables were analysed against a number of characteristics including: housing tenure; benefits and Working Tax Credits status; age distribution and migrant populations.
Housing tenure
28 renting.49 Chart 4, below, shows that those LSOAs with the highest levels of financial
exclusion are likely to have higher proportions of their population living in rented accommodation and lower proportions living in owner occupied housing than LSOAs not among the most financially excluded.
Chart 4: Housing tenure in the most financially excluded LSOAs
0% 10% 20% 30% 40% 50% 60% 70%
1% to 24% 24% to 47% 47% to 70% 70% to 96%
Proportion of rented housing in LSOA
P
e
rc
e
n
ta
ge
o
f
LS
O
A
s
Most financially excluded LSOAs All other LSOAs
Only 2 per cent of the most financially excluded LSOAs have 1 to 24% of rented accommodation whereas 40% of the most financially excluded LSOAs have between 24 and 47% of rented accommodation and the remaining 58% have over 47% of rented accommodation. The correlation between living in rented accommodation and having no house contents insurance is over 90%. For owner occupation the pattern observed for renting is reversed, with only 2% of the most financially excluded LSOAs having over three quarters of their housing in owner occupation.
Benefit status
The most financially excluded LSOAs tend to also have the highest proportions of benefit claimants in their populations. The proportion of benefit claimants in the LSOAs ranges from 0 to 44%. Chart 5, below, shows that only 10% of the most financially excluded LSOAs have between 0 and 11% of benefit claimants whereas most LSOAs outside the most excluded are in this benefits band. The majority of the most financially excluded LSOAs have more than 11% of their population claiming some kind of state benefit, and nearly a fifth of the most excluded LSOAs have over 22% of their population claiming state benefits of some kind.
49 Analysis of combined rented tenures reveals stronger correlation with financial exclusion than
29 Chart 5: State benefits claimants in the most financially excluded LSOAs
0% 10% 20% 30% 40% 50% 60% 70% 80% 90% 100%
0% to 11% 11% to 22% 22% to 33% 33% to 44%
Proportion of benefit claimants in LSOA
P
e
rc
e
n
ta
g
e
of
LS
O
A
s
Most financially exc