RESEARCH ARTICLE
Biomechanical control of vocal plasticity in an echolocating bat
Jinhong Luo1,2,* and Lutz Wiegrebe2,*ABSTRACT
Many animal species adjust the spectral composition of their acoustic signals to variable environments. However, the physiological foundation of such spectral plasticity is often unclear. The source-filter theory of sound production, initially established for human speech, applies to vocalizations in birds and mammals. According to this theory, adjusting the spectral structure of vocalizations could be achieved by modifying either the laryngeal/syringeal source signal or the vocal tract, which filters the source signal. Here, we show that in pale spear-nosed bats, spectral plasticity induced by moderate level background noise is dominated by the vocal tract rather than the laryngeal source signal. Specifically, we found that with increasing background noise levels, bats consistently decreased the spectral centroid of their echolocation calls up to 3.2 kHz, together with other spectral parameters. In contrast, noise-induced changes in fundamental frequency were small (maximally 0.1 kHz) and were inconsistent across individuals. Changes in spectral centroid did not correlate with changes in fundamental frequency, whereas they correlated negatively with changes in call amplitude. Furthermore, while bats consistently increased call amplitude with increasing noise levels (the Lombard effect), increases in call amplitude typically did not lead to increases in fundamental frequency. In summary, our results suggest that at least to a certain degree echolocating bats are capable of adjusting call amplitude, fundamental frequency and spectral parameters independently.
KEY WORDS: Anthropogenic noise, Behavioural flexibility, Instantaneous frequency, Noise pollution, Speech production
INTRODUCTION
Many animals are capable of adjusting their behaviour in response to variable environments, a phenomenon referred to as phenotypic flexibility (Piersma and Drent, 2003). Phenotypic flexibility acts as a crucial feature that allows animals to maximize performance for a given environment. For example, many animals alter their ways of searching for and obtaining food in order to maximize the benefits, a behaviour known as optimal foraging (Krebs, 2009).
Another well-known form of phenotypic flexibility is the behavioural plasticity of the acoustic phenotype. Animals as diverse as insects, amphibians, birds and mammals adjust their acoustic signals in response to background noise (Brumm, 2013). The typical acoustic parameters found to vary with background noise include signal amplitude (the Lombard effect), signal duration, and spectral composition of signals such as the minimum frequency of bird songs (Nemeth et al., 2013), the
bandwidth of echolocation calls (Tressler and Smotherman, 2009) and the spectral tilt of human speech (Lu and Cooke, 2009). In addition to the Lombard effect and the elongation of signal duration, increasing evidence suggests that spectral plasticity in noise represents an adaptive strategy to reduce noise interference (for review, see Slabbekoorn, 2013). However, it has also been pointed out that in many cases spectral plasticity in noise might simply be a by-product of the Lombard effect because of the biomechanical link in the sound production process (Hotchkin and Parks, 2013). Thus, knowledge on the sound production processes of noise-related spectral plasticity can be crucial in testing the hypothesis that spectral plasticity is a behavioural mechanism used by animals to reduce noise interference (Slabbekoorn and Peet, 2003).
Initially developed for human speech, the source-filter theory of sound production applies to birds and mammals (Lieberman, 2007; Elemans, 2014). According to this theory, vocalizations are products of the vocal tract, which filters source signals generated by the syrinx of birds or by the larynx of mammals (Fant, 1960). The vocal tract is controlled by moving articulators such as the tongue, the lips or the soft palate. In human speech, the vocal tract determines formants, whereas the vibration rate of the vocal folds determines the pitch or fundamental frequency (F0). As a result, altering the spectral composition of vocalizations can be achieved by adjusting either the laryngeal/syringeal source signal or the filtering feature of the vocal tract. Nevertheless, to get insight into the production processes of spectral adjustment, information about either the source signal or the vocal tract suffices.
Here, we asked how mammals and birds, to which the source-filter theory applies, achieve spectral adjustments induced by interfering noise. We predicted that positive correlations betweenF0 and spectral parameters of vocalizations would be observed if spectral adjustments are achieved by altering the source signal. To address this question, we made sound recordings from six individuals of pale spear-nosed bats (Phyllostomus discolor) experimentally exposed to four different levels of artificial noise that overlapped in frequency with the echolocation calls (Fig. 1). The echolocation calls ofP. discolorare frequency modulated (FM), with theF0attenuated strongly (Fig. 2A). We conducted a point-by-point frequency estimation for the F0 of the echolocation calls (Fig. 2), based on a recently developed frequency estimation algorithm, namely the time-corrected instantaneous frequency (TCIF) method (Fulop and Fitz, 2006; Fulop, 2011). Through correlating theF0with spectral parameters, we show that spectral plasticity in P. discolor induced by moderate-level background noise is mainly mediated by the vocal tract. In this study, spectral parameters are specifically referred to as those parameters extracted from the power spectrum, excluding theF0.
MATERIALS AND METHODS Animals and setup
Six individuals of adult Phyllostomus discolor Wagner 1843 (3 males and 3 females) were tested in an echo- and sound-attenuated acoustic chamber. During the experiment, two bats were tested
Received 18 November 2015; Accepted 14 January 2016
1
Max Planck Institute for Ornithology, Acoustic and Functional Ecology Group,
Eberhard-Gwinner-Straße, Seewiesen 82319, Germany.2Division of Neurobiology,
Department Biology II, Ludwig-Maximilians-Universität München, Großhaderner
Straße 2, Planegg-Martinsried 82152, Germany.
*Authors for correspondence (luojh135@gmail.com; lutzw@lmu.de)
Journal
of
Experimental
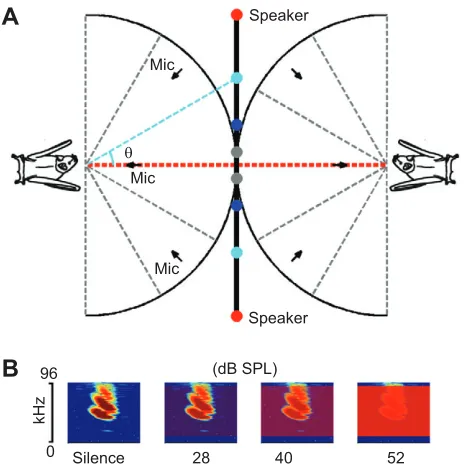
simultaneously, with bats held individually in pyramidal mesh cages (30 cm high, 30×30 cm at the base and 10×10 cm at the top; Bat World Sanctuary, Weatherford, TX, USA). Bats were assigned to the same pairs throughout the experiment. On each experimental day, we collected data from all three pairs for a period of 40 min. The 40 min test session comprised a 4 min habituation phase at the beginning, followed by three 6 min noise treatments and three 6 min silence periods, in an alternating order. Vocalizations of each bat were recorded by three microphones (CO 100K, Sanken, Saitama, Japan) placed in a horizontal plane (Fig. 1A). Uncorrelated broadband artificial noise (with a constant spectral density between 10 and 90 kHz) was delivered through two omnidirectional speakers (Elac 4PI PLUS.2, Elac Electroacoustic, Kiel, Germany) between the bats. The positions of the speakers were changed on a daily basis among four locations (Fig. 1A, illustrated by a pair of circles of the same colour) to investigate possible effects of noise source location on bats. As the experiment was neither invasive nor stressful, it did not require explicit approval according
to the regulations. The licence to keep and breedP. discolorwas issued by the responsible agency (Regierung von Oberbayern, Germany).
Recording and playback
Sound recording and noise playback were synchronized through an audio interface (Ultralite-mk3 Hybrid, MOTU, Cambridge, MA, USA), which was controlled by SoundMexPro software (HörTech, Oldenburg, Germany) in MATLAB (v7.5, The MathWorks Inc., Natick, MA, USA). Bat vocalizations were continuously sampled at 192 kHz, and whenever any of the two centre microphones received a signal of a peak amplitude≥70 dB sound pressure level (SPL), recordings of 1.9 s before and 0.1 s after the trigger event were saved to hard disk.
Band-pass filtered white noise of 10–90 kHz was digitally created and broadcast to bats from each speaker at three levels: 28, 40 and 52 dB SPL (Fig. 1B). In effect, the received noise level at the position of the bats was about 3 dB higher for each noise presentation because of the summation of two uncorrelated noise sources. For the silence control, the noise level was digitally set to −20 dB SPL. We achieved a flat frequency response of the speakers (±1 dB) through digital filtering the noise with each speaker’s compensatory impulse response [511-order finite impulse response (FIR) filter with cut-off frequencies of 7 and 90 kHz]. Initial speaker measurements were conducted with a 1/8 inch measurement microphone (Type 4138, Brüel & Kjær, Denmark; protective grid removed) oriented perpendicular to each speaker at a distance of 55 cm. When speakers were placed at different locations (Fig. 1A), the distance between the bat and the speakers was larger than the 55 cm calibration distance and thus bats would receive a weaker List of symbols and abbreviations
CI confidence interval
F0 fundamental frequency
FIR finite impulse response
FM frequency modulated
Padj P-value adjusted by Bonferroni correction for pairwise
comparisons
SPL sound pressure level relative to 20 µPa TCIF time-corrected instantaneous frequency
96
0 28 40 52
(dB SPL)
Silence
kHz
Mic
Mic
Mic
Speaker Speaker
A
B
[image:2.612.312.561.56.276.2]θ
Fig. 1. Experimental setup and artificial noise.(A) Experimental setup (top view, not to scale). Vocalizations of each bat were recorded by three microphones during presentation of uncorrelated white noise through a pair of omnidirectional speakers (coded in the same colour) at four different locations (θ=5, 15, 30 and 45 deg) relative to the reference axis (red dashed line), which was in the middle of and perpendicular to the axis holding the speakers. (B) Illustrations of the spectrograms of artificial noise in relation to a typical echolocation call ofPhyllostomus discolor. The noise had a frequency range of 10–90 kHz and was presented at three different sound pressure levels (28, 40 and 52 dB SPL re. 20 µPa). During the silence control, the noise was digitally switched off.
0 0.4 0.8
0 48 96
F0
A
Frequency (kHz)
0 0.4 0.8
0 48 96
Time (ms)
B
0 0.4 0.8
0 48 96
C
0 0.4 0.8
15 18 21 24
Time (ms) F0
(kHz)
gof coef.: 0.99
F01
F02
F03
D
Initial fitting
Refined fitting
Good data
Outlier
[image:2.612.58.291.393.628.2]Estimated F0
Fig. 2. Procedures for fundamental frequency estimation.Unlike the conventional spectrogram (A), the time-corrected instantaneous frequency (TCIF) spectrogram (B) is not subjected to the time–frequency resolution trade-off. Thus, the TCIF spectrogram can maintain high resolution for both frequency and temporal domain. The fundamental frequency (F0) is
estimated by (i) computing the TCIF (B), (ii) extracting the 3rd harmonic (C), (iii) dividing the 3rd harmonic by 3 to get the fundamental raw frequency points (D), (iv) removing the outliers by fitting the raw frequency points with a 2nd order power function, and (v) estimating the fundamental frequency at 12.5% (F01), 50% (F02) and 87.5% (F03) of the time (duration) axis from the refitted 2nd
order power function. gof coef., goodness-of-fit coefficient.
Journal
of
Experimental
noise level as a result of transmission loss. We compensated for the distance-related transmission loss (i.e. the geometric attenuation of −6 dB per doubling of distance and the frequency-specific atmospheric attenuation) through digital filtering. We double checked the playback system by recording the noise with the reference microphone placed at the same position as the bat for all four noise source locations. Amplitude analysis of the recorded noise confirmed that both the recording and playback systems worked well.
Data analysis
We performed sound analysis in MATLAB with custom-written programs, based on Luo et al. (2015). First, we accounted for the frequency response of the microphones by filtering the recorded call with each microphone’s compensatory impulse response (32nd order FIR filter) and high-pass filtered all recordings at 35 kHz (5th order FIR filter). All echolocation calls with a peak amplitude ≥70 dB SPL were automatically identified by the software, followed by a manual check of the spectrogram to ensure correct call identification. Second, for each call, the spatial position of the calling bat was determined based on the time of arrival difference of the recordings between three corresponding microphones. The time delay of the recordings between two microphones was determined by normalized cross-correlation. To improve the quality of time-delay estimation, calls were up-sampled to 1 MHz to achieve better temporal resolution and only call samples over the call duration were used. Call samples were defined as −10 dB from the peak amplitude of the Hilbert envelope. Although at least four microphones are required to precisely locate a given sound source in a 3D space, in our situation, the bat can only be at a limited number of positions because of the physical constraints of the cage. Based on information from three microphones, for each call, we found all the possible positions of the bat and calculated their distance to each microphone. Then the averaged distance was taken as the bat–microphone distance to compensate for the transmission loss, which included the geometric attenuation of −6 dB per doubling distance and the frequency-dependent atmospheric attenuation. For each microphone, the root-mean-square amplitude over the call duration at 10 cm distance from the bat was calculated. For each call, the recording from the microphone of maximum call amplitude was used for frequency analysis to reduce the effect of bat calling direction. Frequency estimation of high-frequency sounds such as echolocation calls is sensitive to calling direction because high-frequency sounds are by nature more directional. Frequency estimation was based on the power spectrum by short-time Fourier transform of the determined call samples, using 512 samples for the discrete Fourier transform. Peak frequency was defined as the frequency point of the maximum amplitude. The minimum and maximum frequencies were those frequency components that were 10 dB lower in magnitude relative to the magnitude of the peak frequency (see Fig. 3A). Bandwidth was the difference between the maximum and minimum frequency. Spectral centroid was referred to as the ‘centre of mass’ of the power spectrum across the bandwidth (Schubert et al., 2004).
Fundamental frequency estimation
For sounds of multiple harmonics, such as the echolocation calls ofP. discolor, the fundamental frequency is defined as the harmonic of the lowest frequencies and is normally referred to asF0. Because theF0 ofP. discolor is strongly attenuated during the sound production process, as can be seen in the spectrogram in Fig. 2A, direct estimation ofF0is not possible. Nevertheless,F0can be indirectly
estimated based on other harmonics that are by definition the multiple integers ofF0in frequency. We estimatedF0of the echolocation calls based on the 3rd harmonic (Fig. 2C). The reason for choosing the 3rd harmonic instead of the 2nd or the 4th is that the lower part of the 2nd harmonic is often attenuated during the sound production process, possibly by the same process as forF0. The 4th harmonic is more vulnerable to distortion because of processes such as atmospheric attenuation and calling direction. To improve the frequency estimation quality, the time-corrected instantaneous frequency (TCIF) of each call was computed using the MATLAB algorithm (function‘Nelsonspec’) from Fulop (2011). Unlike the conventional spectrogram, the spectrogram based on the instantaneous frequency is not subjected to the frequency–time resolution trade-off (Fig. 2B) and, thus, can maintain high spectral and temporal resolution simultaneously (Nelson, 2001; Fulop and Fitz, 2006; Fulop, 2011). Additionally, F0 estimation based on instantaneous frequency is more resistant to additive background noise and frequency distortion (Nakatani and Irino, 2004). Practically, TCIF-based frequency estimation is probably the only effective approach applicable to vocalizations of strong frequency modulation, such as the songs of humpback whales (Fulop and Fitz, 2006).
Because the echolocation calls are strongly FM over time, it makes little sense to estimate the averageF0over the call duration. This means that point-by-point estimation of F0 is required to represent the FM feature. However, the quality of frequency estimation at a single time frame is rather vulnerable to different factors and thus is often not accurate. To ensure the estimation quality, the power spectrum density of a section of 20 time frames was computed, from which theF0was estimated and referred to as F0of the 10th time frame. Then,F0of a next section of 20 time frames that overlapped with the former section by 19 time frames (i.e. 95% overlapping rate) was estimated, and so forth until the end. Subsequently, a statistical fitting of a power function was applied to these original estimations to search for inaccurate estimations, which were referred to as outliers. Outliers were defined as 1.5 times of the average of the residuals of the fitting (Fig. 2D). After removing outliers, the remainingF0estimations were fitted again by a power function, from which the finalF0estimation was extracted. In this study, we extractedF0at 12.5% (F01), 50% (F02) and 87.5% (F03) of the call duration for each call (Fig. 2D). AnalysingF0at 12.5% and 87.5% of the time axis, instead of the first and last time points, ensured that estimatedF0was based on the original data but not on extrapolation. Moreover, only calls with high goodness of fit (≥0.95) were used.
Calling direction of bats
To further reduce the effect of calling direction of bats on frequency estimation, we repeated the analysis by limiting it to those calls that were directed to the centre microphone (Fig. 1A; microphones on the reference axis). Directed calls were selected based on two criteria: (i) the centre microphone had the highest call amplitude and (ii) the difference in call amplitude between the two side microphones was smaller than 2 dB. Here, we focused on the calling direction of the horizontal plane because of the changes in loudspeaker location in this plane (see above for details). As there was no change in any of the environmental factors in the vertical plane, we did not control for the calling direction in the vertical plane.
Statistics
We modelled the fundamental frequency (F02) and each spectral parameter (i.e. the peak frequency, minimum frequency, maximum frequency, bandwidth and spectral centroid) as a function of three
Journal
of
Experimental
explanatory variables: noise level, speaker location and bat identity, using general linear models (LMs) run in SPSS 21.0 (IBM Corp., New York, NY, USA). For all models, the identity link function was used. The model fits were examined by subsequent analysis of residuals, which were confirmed to be independently distributed. For correlation analysis, Pearson correlation was used. AllP-values for pairwise comparisons reported in this paper were adjusted by Bonferroni correction and denoted asPadj.
RESULTS
In total, we analysed 32,702 echolocation calls from six bats. We found that when the bats were exposed to noise, several spectral parameters dropped significantly (Figs 3 and 4A). Specifically, when the bats were exposed to 52 dB SPL noise, there was on average a 5.2 kHz decrease in peak frequency [Fig. 3C; confidence interval (CI) 4.7–5.7 kHz, Padj<0.0001], a 1.3 kHz decrease in minimum frequency (Fig. 3E; CI 1.1–1.5 kHz, Padj<0.0001), a 3 kHz decrease in maximum frequency (Fig. 3F; CI 2.7–3.3 kHz, Padj<0.0001), a 1.7 kHz decrease in bandwidth (Fig. 3D; CI 1.4–2.0 kHz, Padj<0.0001) and a 3.2 kHz decrease in spectral centroid (Fig. 4A; CI 2.9–3.5 kHz, Padj<0.0001). Similarly, all five spectral parameters were significantly lower in the 40 dB SPL noise condition compared with the silence control (allPadj<0.0001), yet the reductions in frequency were significantly smaller than those in the 52 dB SPL noise condition (all Padj<0.0001). In contrast, there was no difference in any of the five spectral parameters between the 28 dB noise condition and the silence control (all Padj>0.14).
We checked the validity of these results by analysing only those calls that were directed to the centre microphone (Fig. 3C–F, grey error bars). For these calls, the potential influence of bat calling direction on frequency estimation was minimized (see Materials and methods). Although the number of calls was largely reduced, which resulted in wider confidence intervals (Fig. 3C–F, grey versus black error bars), the frequency decreases were also observed in this restricted dataset and were statistically similar to those based on the entire dataset (Table S1). As a result, for convenience, all results below are based on the entire dataset.
We conducted a point-by-point estimation of theF0across call duration. For quantitative analyses, we extracted the instantaneous F0at 12.5% (F01), 50% (F02) and 87.5% (F03) of the call duration
(Fig. 2D). As we found that these three F0 estimates correlated strongly with each other, withF02explaining 62% and 69% of the variation ofF01andF03, respectively (Fig. 5; Pearson correlation, allP<0.0001), we chose the central fundamental frequency estimate (F02) to represent theF0for each call.
We found thatF0variations were overall very small. Specifically, when the noise was presented at 52 dB SPL, the F0 increased by only 0.11 kHz (from 19.03 to 19.14 kHz; Fig. 4B; CI 0.08– 0.14 kHz, Padj<0.0001). When data were analysed for each individual separately, we found that different individuals exhibited different patterns of adjusting theF0across noise levels (Fig. 4B). Specifically, comparing the 52 dB noise condition with the silence control, three bats decreased theF0 (Bat 2, CI 0.19– 0.35 kHz,Padj<0.0001; Bat 5, CI 0.30–0.44 kHz,Padj<0.0001; Bat 6, CI 0.04–0.26 kHz,Padj<0.01), one bat increased theF0(Bat 1, CI 0.58–0.69 kHz,Padj<0.0001) and two bats did not change theF0 (Bat 3,Padj=0.79; Bat 4,Padj=0.99). In contrast, all bats decreased the spectral centroid and increased the call amplitude (Fig. 4A,C; allPadj<0.0001).
To test whether the noise-induced spectral adjustments are direct products ofF0adjustments, for each bat the noise-induced changes in spectral centroid andF0were calculated by subtracting the mean in the silence control from the mean in the three noise conditions. Subsequently, changes in spectral centroid were correlated with changes in F0. We found that there was no correlation between changes in spectral centroid and changes inF0 (Fig. 6A; Pearson correlation, R2=0.082, P=0.25). In contrast, changes in spectral centroid negatively correlated to changes in call amplitude (Fig. 6B; Pearson correlation,R2=0.43,P<0.01).
Moreover, we found that changes inF0were positively related to changes in call amplitude (Fig. 6C, black line; Pearson correlation, R2=0.33, P=0.013). However, by removing the data point that represented the strongest increase in call amplitude (Fig. 6C, black circle), the positive correlation disappeared and became non-significant (Fig. 6C, grey line; Pearson correlation, R2=0.055, P=0.37). This shows that the positive correlation between changes in call amplitude and changes inF0was largely driven by a single data point. These results led to the hypothesis that a small increase in call amplitude (up to about 6 dB) did not result in an increase in fundamental frequency, while larger increases in call amplitude (up to 10 dB) may lead to an increase inF0.
28 40 52 59
61 63 65 67
Fpeak
(kHz)
S
C
28 40 52 40
42 44 46 48
Noise level (dB SPL)
Bandwidth (kHz)
S
D
28 40 52 36
38 40 42 44
Fmin
(kHz)
S
E
28 40 52 83
85 87 89 91
Fmax
(kHz)
S
F
0 24 48 72 96
–100 –80 –60 –40 –20
A
Fpeak
0 24 48 72 96
–100 –80 –60 –40 –20
Frequency (kHz)
Magnitude (dB)
Fpeak
B
[image:4.612.48.396.526.731.2]All calls (N=32,702) Calls directed to the centre microphone (N=2269)
Fig. 3. Echolocating bats decrease call frequencies when exposed to noise.
(A,B) Mean power spectrum (±s.d.) of 100 randomly selected calls from one bat for the silence control and the 52 dB SPL noise condition, respectively. (C–F) Marginal mean and 95% confidence intervals (S, silence control). The black error bars were plotted based on all calls and the grey error bars were plotted based on the calls that were directed to the centre microphones, i.e. on the red reference axis as illustrated in Fig. 1A. The number of calls involved in the analysis is indicated.Fpeak,
peak frequency;Fmax, maximum frequency;
Fmin, minimum frequency.
Journal
of
Experimental
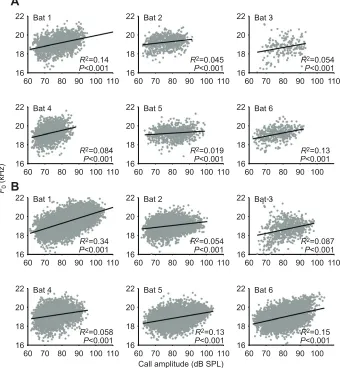
To test this hypothesis, we correlated the absolute call amplitude with the absoluteF0for each individual. Focusing on the absolute call amplitude resulted in a much larger dynamic range (maximally 45 dB; Fig. 7B, Bat 1) than obtained by focusing on the noise-induced changes (maximally 10 dB; Fig. 4C, Bat 1). If this hypothesis is true, we would see a positive correlation between the absolute call amplitude and the absoluteF0. Indeed, we found that for all bats theF0was positively related to the call amplitude, even when only calls from the silence control were included (Fig. 7A;R2 of 0.02–0.14, allP<0.001). When calls from the noise treatments were included, which further increased the dynamic range of call amplitude, we found that the positive correlation betweenF0and call amplitude became stronger, as indicated by an increase in the correlation coefficient for five out of six individuals (Fig. 7B;R2of 0.05–0.34, allP<0.001).
DISCUSSION
Physiological foundations of sound production have been intensely studied for a variety of animal species (Suthers, 2010; Bradbury and Vehrencamp, 2011; Au and Suthers, 2014; Elemans, 2014). While the majority of studies focused on the physiological bases of producing distinct vocalization types, the physiological processes responsible for fine adjustments of the same vocalization type are less clear. Here, we show that the spectral plasticity in bat vocalizations induced by moderate noise level is mainly mediated by the vocal tract. Specifically, we found that under the noise exposure the very small and inconsistent changes in F0 did not explain the systematic decreases in the spectral parameters. Furthermore, the positive correlation between the absoluteF0and absolute call amplitude confirmed that our bats abide by the biomechanical link between vocal amplitude andF0. Yet, we also
–6 –3 0
3 Bat 1 Bat 2 Bat 3
28 40 52 –6
–3 0 3 Bat 4
S 28 40 52
Bat 5
S 28 40 52
Bat 6
S
28 40 52
–6 –3 0 3
S All calls
Change in
spectral centroid (kHz)
A
–0.5 0 0.5
1 Bat 1 Bat 2 Bat 3
28 40 52 – 0.5
0 0.5
1 Bat 4
S 28 40 52
Bat 5
S 28 40 52
Bat 6
S
28 40 52
–0.5 0 0.5 1
S All calls
Change in
F0
(kHz)
B
0 4 8
12 Bat 1 Bat 2 Bat 3
28 40 52 0
4 8 12 Bat 4
S 28 40 52
Bat 5
S 28 40 52
Bat 6
S
28 40 52
0 4 8 12
Noise level (dB SPL) S
All calls
Change in
call amplitude (dB)
[image:5.612.49.394.57.418.2]C
Fig. 4. Adjustment of the spectral centroid,F0 and call amplitude by bats exposed to noise.
Data are presented as marginal mean and 95% confidence intervals at both the species (calls pooled for all bats) and individual level (S, silence control).
15 17 19 21 23
18 20 22 24 26
F02 (kHz)
F01
(kHz)
R2=0.62 P<0.0001
A
15 17 19 21 23
12 14 16 18 20
F02 (kHz)
F03
(kHz)
R2=0.69 P<0.0001
B
12 14 16 18 20
18 20 22 24 26
F03 (kHz)
F01
(kHz)
R2=0.22 P<0.0001
C
Fig. 5. Positive correlation betweenthree estimatedF0.F01,F02andF03
represent theF0at 12.5%, 50% and
87.5% of the time axis for each call (Fig. 2D).F02explained 62% of the
variation ofF01, and 69% of the
variation ofF03.
Journal
of
Experimental
[image:5.612.49.427.626.737.2]found that small changes in call amplitude (up to about 6 dB), as induced by the moderate noise level in this study, did not result in an increase inF0.
Echolocating bats decrease call frequencies in broadband noise
A number of studies have reported adaptive frequency shifting when animals’ acoustic signals were partially masked by background noise (e.g. insects, Lampe et al., 2014; frogs, Parris et al., 2009;
birds, Nemeth et al., 2013; mammals, Bates et al., 2008). For instance, in urban areas where noise is dominated by low-frequency components, birds sing at a higher pitch, which reduces masking by shifting their songs to a frequency range where background noise contains less energy (Slabbekoorn, 2013). We found that under exposure to broadband white noise, bats consistently decreased the spectral parameters of their calls, including the minimum frequency, maximum frequency, peak frequency, bandwidth and spectral centroid, with increasing noise level. Intuitively, it appears that such
−6 −4 −2 0 2
−0.4 0 0.4 0.8
Change in spectral centroid (kHz)
R2=0.082 P=0.25
A
Change in
F0
(kHz)
−3 0 3 6 9 12
−6 −4 −2 0 2
Change in call amplitude (dB)
R2=0.43 P<0.01
B
Change in spectral
centroid (kHz)
−3 0 3 6 9 12
−0.4 0 0.4 0.8
Change in call amplitude (dB)
R2=0.33 P=0.013
R2=0.055 P=0.37
C
Change in
F0
[image:6.612.113.499.57.173.2](kHz)
Fig. 6. Correlation between the noise-induced changes in three call parameters.Correlation between changes in (A)F0and spectral centroid; (B) spectral
centroid and call amplitude; and (C)F0and call amplitude. Data points for the correlation were the average changes in call parameters in noise relative to the
silence control at the individual level (Fig. 4). Thus, there were 18 data points in total from three noise conditions (28, 40 and 52 dB SPL) and six individuals. The data point indicated by the arrow in C represents the strongest increase in call amplitude among all bats and all noise conditions. By removing this data point, the significant correlation between changes inF0and call amplitude (black line) became non-significant (grey line).
60 70 80 90 100 110 16
18 20 22 Bat 1
R2=0.14 P<0.001
A
60 70 80 90 100 110 16
18 20 22 Bat 2
R2=0.045 P<0.001
60 70 80 90 100 110 16
18 20 22 Bat 3
R2=0.054 P<0.001
60 70 80 90 100 110 16
18 20 22 Bat 4
R2=0.084 P<0.001
F0
(kHz)
60 70 80 90 100 110 16
18 20 22 Bat 5
R2=0.019 P<0.001
60 70 80 90 100 16
18 20 22 Bat 6
R2=0.13 P<0.001
60 70 80 90 100 110 16
18 20 22 Bat 1
R2=0.34 P<0.001
60 70 80 90 100 110 16
18 20 22 Bat 2
R2=0.054 P<0.001
60 70 80 90 100 110 16
18 20 22 Bat 3
R2=0.087 P<0.001
60 70 80 90 100 110 16
18 20 22 Bat 4
R2=0.058 P<0.001
60 70 80 90 100 110 16
18 20 22 Bat 5
Call amplitude (dB SPL)
R2=0.13 P<0.001
60 70 80 90 100 16
18 20 22 Bat 6
R2=0.15 P<0.001
B
Fig. 7. Call amplitude is positively related toF0.
(A) Correlation based on calls from the silence control; (B) correlation based on calls from all conditions. Because bats called louder in noise, the dynamic range of call amplitude based on all calls was larger than that based on calls from the silence control alone. Note, call amplitudes presented here are the root-mean-square amplitude, which were on average 8.5 dB lower than the peak amplitude used for call
identification.
Journal
of
Experimental
[image:6.612.51.398.368.736.2]behaviour does not rescue animals from masking at all, considering that their vocalizations are still entirely immersed in the broadband noise after frequency shifting. However, we propose that decreasing call frequencies in white noise can indeed improve the detectability of the signals through at least two distinct processes.
First, decreasing call frequency leads to lower atmospheric attenuation. Atmospheric attenuation strongly constrains the transmission distance of echolocation calls (Griffin, 1971; Lawrence and Simmons, 1982). A 5.2 kHz decrease in peak frequency by P. discolor, as found in this study (from 66.2 to 61.0 kHz), decreases the atmospheric attenuation from 2.4 to 2.1 dB m−1 (calculation based on a typical tropical climate for foraging bats, 27°C air temperature, 87% humidity and 101,325 Pa air pressure; Luo et al., 2014). This means that for locating a target at a 2 m distance by echolocation, the received echo by bats will be >1 dB louder owing to the decrease in peak frequency per se.
Second, decreasing call frequency reduces the amount of noise integrated by the auditory filters, and thus improves the signal-to-noise ratio. The bandwidth of inner ear auditory filters in bats (as well as in birds, humans and many other taxa) becomes wider with increasing centre frequency of auditory filters (Wiegrebe, 2008). The present noise, with frequency-independent spectral density, thus produces stronger excitation at higher auditory filters. Consequently, lowering call frequency shifts frequency components of the vocalization to auditory filters of narrower bandwidth that integrate less background noise. This explanation is consistent with the results found in birds. Potvin and Mulder (2013) found that silvereyes (Zosterops lateralis) significantly decreased the minimum song frequency in response to high-pass noise, while the birds only showed a trend to increase the minimum song frequency in response to low-pass noise.
Together with decreasing call frequency, we found that bats in noise also produced calls with narrower bandwidth. It is well established in sonar/radar research that narrowband signals are better suited for detecting targets at a distance while broadband signals are good at accurate distance estimation (Simmons and Stein, 1980). Perceptually, there is evidence that the detection threshold for sound signals improves with decreasing signal bandwidth in animals (Lohr et al., 2003). Moreover, animals are indeed found to decrease the bandwidth of their vocalizations in response to interfering noise (Osmanski and Dooling, 2009; Montague et al., 2013; Redondo et al., 2013). Hence, by decreasing call bandwidth, the bats can further improve signal detectability.
Interestingly, in a playback experiment with flying free-tailed bats (Tadarida brasiliensis), Tressler and Smotherman (2009) found that they produced echolocation calls with broader bandwidth when exposed to broadband white noise. One possible explanation for the observed difference is the behavioural status of bats during testing (stationary versus flying). In contrast to the stationary status, one major task of echolocation for flying bats is spatial orientation. Successful spatial orientation relies strongly on accurately estimating the distance between the bat and obstacles so as to avoid collisions. As mentioned above, the broader the bandwidth, the more accurate the distance estimation by echolocation. Thus, it is conceivable that for flying bats the echolocation signals represented compromised outcomes between two conflicting selection forces: spatial resolution selecting for broadband signals and signal detection selecting for narrowband signals. Nevertheless, we cannot rule out the possibility that the discrepancy between the results is simply due to the intrinsic species differences.
Spectral plasticity is achieved by adjusting the vocal tract Any vocalization is affected by the vocal tract, which filters the source signal generated in the larynx of mammals or in the syrinx of birds (Fant, 1960; Lieberman, 2007; Elemans, 2014). In this study, we observed consistent reductions in a suite of spectral parameters with increasing noise levels, with a magnitude of up to 5.2 kHz for the peak frequency. In contrast, we found that bats on average only increased theF0marginally, with a maximum of 0.1 kHz. Detailed analysis at the individual level revealed a larger maximum change (0.6 kHz), but also strong individual variations. Moreover, changes in F0 did not explain the observed spectral adjustments. These results strongly support our conclusion that the observed frequency reductions arise from vocal tract adjustments.
The importance of the vocal tract in human speech as well as in birdsong has been well illustrated (Fant, 1960; Beckers et al., 2004; Riede et al., 2006). In contrast, our knowledge on how the vocal tract shapes echolocation signals is rather limited and has been investigated only in a few species (for review, see Au and Suthers, 2014). In particularly, it is unclear to what extent the vocal tract is actively used by bats to adjust their calls to variable environments. This is quite surprising considering that spectral adjustment of echolocation signals is well documented, and it can be broadly divided into two categories: spectral adjustment based on bat–object distance, with the object being prey (Griffin et al., 1960), obstacle (Kalko and Schnitzler, 1993) or other bats (Cvikel et al., 2015); and spectral adjustment based on interfering sounds (Ulanovsky et al., 2004; Tressler and Smotherman, 2009; Hage et al., 2013). By clearly separating F0 and spectral parameters in our analyses, we show that the vocal tract is recruited by the bats to adjust their vocalizations to background noise.
With regard to this point, we might be able to have a clearer look at the general correlation analysis between spectral adjustments and the Lombard effect, a topic that has received considerable attention and yet remains debatable. In this study, we found that changes in spectral centroid were correlated negatively with changes in call amplitude. Nevertheless, this statistical correlation did not reveal any causative relationship between these two parameters. This is because, as ourF0data suggest, changes in spectral centroid were probably achieved by adjusting the vocal tract, a process that is not related to call amplitude modification. Therefore, we urge that studies investigating the relationship between spectral adjustments and the Lombard effect should seek the physiological mechanisms underlying both spectral and amplitude adjustments to better understand the causative relationship.
Biomechanical link underlying signal plasticity
In the field of studying noise-induced vocal modifications, one open question is the degree to which animals can independently adjust different signal parameters (Hotchkin and Parks, 2013). Our finding that across different noise levels theF0inP. discolorwere fairly stable despite an evident Lombard effect immediately raises the question whether our data break the biomechanical link between vocalization amplitude andF0. Such a biomechanical link has been shown for birds and mammals including humans both behaviourally (Gramming et al., 1988; Nemeth et al., 2013) and mechanistically (Elemans et al., 2008; Kobayasi et al., 2012). The physiological foundation of this link is clear: signal amplitude depends on the subglottal pressure, which determines theF0as well. Specifically, to produce a louder vocalization, one has to hold the cricothyroid muscle tighter, and vice versa. TheF0is determined by the vibration rate of vocal folds, or vocal membrane of echolocating bats, which is controlled by the same cricothyroid muscle (Suthers, 2010). As a
Journal
of
Experimental
consequence, vocalization amplitude andF0couple with each other. Note, however, that humans can concisely break this link by increasing their vocalization loudness without increasing theF0, as is evident during choral singing. This example reflects the influence of cognitive control on pitch.
By correlatingF0with call amplitude in our whole data set, we found that F0 was indeed positively related to call amplitude, supporting the biomechanical link hypothesis. However, we also found that when the dynamic range of call amplitude was restricted, the biomechanical link became weaker. Specifically, by excluding the data point representing the strongest Lombard effect (Fig. 6C, black circle), we have shown that the Lombard effect induced by moderate level background noise does not lead to an increase inF0. Despite the appeal to conclude that the biomechanical link can be broken off under certain circumstances in a mammal other than humans, we are aware that it would represent rather a premature view considering the lack of knowledge on how bats achieve higher amplitude of echolocation calls.
Emerging data suggest that bats are capable of adjusting the beam shape of echolocation calls through either spectral adjustment (Jakobsen and Surlykke, 2010) or the emitter size, i.e. the vocal tract (Jakobsen et al., 2013; Kounitsky et al., 2015). As echolocation calls are highly directional, it is conceivable that higher call amplitude can be achieved by narrowing the sonar beam. Evidence supporting such a view comes from measuring the beam width and call amplitude of the same bat species in the field and in the laboratory. Surlykke et al. (2009) found that Daubenton’s bats (Myotis daubentonii) in the field produced echolocation calls with narrower beam width than in the laboratory. At the same time, they found that calls in the field were also louder than those in the laboratory.
No matter the exact mechanism of amplitude control, our results do suggest that echolocating bats can adjust the call amplitude, the F0 and the spectral parameters independently to some degree. Independent adjustments of signal amplitude and spectral parameters have also been documented in a horseshoe bat species (Hage et al., 2013, 2014). Independent control of different signal parameters might be a crucial feature for echolocating bats, which deal with moving prey and/or acoustically challenging environments in the dark. Moreover, our results have implications for the on-going debate concerning whether spectral plasticity of animals in noise is an adaptive strategy to reduce noise interference. As spectral plasticity can be achieved not only by adjusting the source signal but also by adjusting the vocal tract, spectral plasticity in some animals might be an adaptation to reducing noise interference.
Acknowledgements
We thank C. Gravot for drawing the bats ofFig. 1. Two reviewers provided helpful comments for improving the manuscript.
Competing interests
The authors declare no competing or financial interests.
Author contributions
J.L. and L.W. designed the study. J.L. performed the experiment, analysed the data and wrote the manuscript. L.W. offered technical support for the experiment, participated in the interpretation of the data and commented on the manuscript.
Funding
J.L. is funded by the China Scholarship Council and by the International Max Planck Research School for Organismal Biology.
Supplementary information
Supplementary information available online at
http://jeb.biologists.org/lookup/suppl/doi:10.1242/jeb.134957/-/DC1
References
Au, W. L. and Suthers, R.(2014). Production of biosonar signals: structure and form. InBiosonar, Vol. 51 (ed. A. Surlykke, P. E. Nachtigall, R. R. Fay and A. N. Popper), pp. 61-105. New York: Springer.
Bates, M. E., Stamper, S. A. and Simmons, J. A.(2008). Jamming avoidance response of big brown bats in target detection.J. Exp. Biol.211, 106-113.
Beckers, G. J. L., Nelson, B. S. and Suthers, R. A.(2004). Vocal-tract filtering by lingual articulation in a parrot.Curr. Biol.14, 1592-1597.
Bradbury, J. W. and Vehrencamp, S. L. (2011). Principles of Animal Communication. Sunderland, MA: Sinauer Associates, Inc., Publishers.
Brumm, H.(2013).Animal Communication and Noise, pp. 453. Berlin: Springer.
Cvikel, N., Levin, E., Hurme, E., Borissov, I., Boonman, A., Amichai, E. and Yovel, Y.(2015). On-board recordings reveal no jamming avoidance in wild bats. Proc. R. Soc. B Biol. Sci.282, 20142274.
Elemans, C. P. H.(2014). The singer and the song: the neuromechanics of avian sound production.Curr. Opin. Neurobiol.28, 172-178.
Elemans, C. P. H., Zaccarelli, R. and Herzel, H.(2008). Biomechanics and control of vocalization in a non-songbird.J. R. Soc. Interface5, 691-703.
Fant, G.(1960). Acoustic Theory of Speech Production. The Hague: Mouton Publishers.
Fulop, S. A.(2011).Speech Spectrum Analysis. Berlin: Springer.
Fulop, S. A. and Fitz, K.(2006). Algorithms for computing the time-corrected instantaneous frequency (reassigned) spectrogram, with applications.J. Acoust. Soc. Am.119, 360-371.
Gramming, P., Sundberg, J., Ternström, S., Leanderson, R. and Perkins, W. H.
(1988). Relationship between changes in voice pitch and loudness.J. Voice 2, 118-126.
Griffin, D. R. (1971). The importance of atmospheric attenuation for the echolocation of bats (Chiroptera).Anim. Behav.19, 55-61.
Griffin, D. R., Webster, F. A. and Michael, C. R.(1960). The echolocation of flying insects by bats.Anim. Behav.8, 141-154.
Hage, S. R., Jiang, T., Berquist, S. W., Feng, J. and Metzner, W.(2013). Ambient noise induces independent shifts in call frequency and amplitude within the Lombard effect in echolocating bats.Proc. Natl. Acad. Sci. USA110, 4063-4068.
Hage, S. R., Jiang, T., Berquist, S. W., Feng, J. and Metzner, W.(2014). Ambient noise causes independent changes in distinct spectro-temporal features of echolocation calls in horseshoe bats.J. Exp. Biol.217, 2440-2444.
Hotchkin, C. and Parks, S.(2013). The Lombard effect and other noise-induced vocal modifications: insight from mammalian communication systems.Biol. Rev. 88, 809-824.
Jakobsen, L. and Surlykke, A.(2010). Vespertilionid bats control the width of their biosonar sound beam dynamically during prey pursuit.Proc. Natl. Acad. Sci. USA 107, 13930-13935.
Jakobsen, L., Ratcliffe, J. M. and Surlykke, A.(2013). Convergent acoustic field of view in echolocating bats.Nature493, 93-96.
Kalko, E. K. V. and Schnitzler, H.-U.(1993). Plasticity in echolocation signals of European pipistrelle bats in search flight: implications for habitat use and prey detection.Behav. Ecol. Sociobiol.33, 415-428.
Kobayasi, K. I., Hage, S. R., Berquist, S., Feng, J., Zhang, S. and Metzner, W.
(2012). Behavioural and neurobiological implications of linear and non-linear features in larynx phonations of horseshoe bats.Nat. Commun.3, 1184.
Kounitsky, P., Rydell, J., Amichai, E., Boonman, A., Eitan, O., Weiss, A. J. and Yovel, Y.(2015). Bats adjust their mouth gape to zoom their biosonar field of view. Proc. Natl. Acad. Sci. USA112, 6724-6729.
Krebs, C. J. (2009).Ecology: The Experimental Analysis of Distribution and Abundance. San Francisco, USA: Benjamin Cummings.
Lampe, U., Reinhold, K. and Schmoll, T.(2014). How grasshoppers respond to road noise: developmental plasticity and population differentiation in acoustic signalling.Funct. Ecol.28, 660-668.
Lawrence, B. D. and Simmons, J. A.(1982). Measurements of atmospheric attenuation at ultrasonic frequencies and the significance for echolocation by bats. J. Acoust. Soc. Am.71, 585-590.
Lieberman, P.(2007). The evolution of human speech.Curr. Anthropol.48, 39-66.
Lohr, B., Wright, T. F. and Dooling, R. J.(2003). Detection and discrimination of natural calls in masking noise by birds: estimating the active space of a signal. Anim. Behav.65, 763-777.
Lu, Y. and Cooke, M.(2009). The contribution of changes in F0 and spectral tilt to increased intelligibility of speech produced in noise.Speech Commun. 51, 1253-1262.
Luo, J., Koselj, K., Zsebök, S., Siemers, B. M. and Goerlitz, H. R.(2014). Global warming alters sound transmission: differential impact on the prey detection ability of echolocating bats.J. R. Soc. Interface11, 20130961.
Luo, J., Goerlitz, H. R., Brumm, H. and Wiegrebe, L.(2015). Linking the sender to the receiver: vocal adjustments by bats to maintain signal detection in noise.Sci. Rep.5, 18556.
Montague, M. J., Danek-Gontard, M. and Kunc, H. P.(2013). Phenotypic plasticity affects the response of a sexually selected trait to anthropogenic noise.Behav.
Ecol.24, 343-348.
Journal
of
Experimental
Nakatani, T. and Irino, T.(2004). Robust and accurate fundamental frequency estimation based on dominant harmonic components.J. Acoust. Soc. Am.116, 3690-3700.
Nelson, D. J.(2001). Cross-spectral methods for processing speech.J. Acoust. Soc. Am.110, 2575-2592.
Nemeth, E., Pieretti, N., Zollinger, S. A., Geberzahn, N., Partecke, J., Miranda, A. C. and Brumm, H. (2013). Bird song and anthropogenic noise: vocal constraints may explain why birds sing higher-frequency songs in cities. Proc. R. Soc. B Biol. Sci.280, 20122798.
Osmanski, M. S. and Dooling, R. J.(2009). The effect of altered auditory feedback on control of vocal production in budgerigars (Melopsittacus undulatus).J. Acoust. Soc. Am.126, 911-919.
Parris, K. M., Velik-Lord, M. and North, J. M. A.(2009). Frogs call at a higher pitch in traffic noise.Ecol. Soc.14, 25.
Piersma, T. and Drent, J. (2003). Phenotypic flexibility and the evolution of organismal design.Trends Ecol. Evol.18, 228-233.
Potvin, D. A. and Mulder, R. A.(2013). Immediate, independent adjustment of call pitch and amplitude in response to varying background noise by silvereyes (Zosterops lateralis).Behav. Ecol.24, 1363-1368.
Redondo, P., Barrantes, G. and Sandoval, L.(2013). Urban noise influences vocalization structure in the House WrenTroglodytes aedon.Ibis155, 621-625.
Riede, T., Suthers, R. A., Fletcher, N. H. and Blevins, W. E.(2006). Songbirds tune their vocal tract to the fundamental frequency of their song.Proc. Natl. Acad. Sci. USA103, 5543-5548.
Schubert, E., Wolfe, J. and Tarnopolsky, A. (2004). Spectral centroid and timbre in complex, multiple instrumental textures. InProceedings of the 8th International Conference on Music Perception & Cognition (ICMPC), pp. 654-657. http://newt. phys.unsw.edu.au/jw/reprints/SchWolTarICMPC8.pdf
Simmons, J. A. and Stein, R. A. (1980). Acoustic imaging in bat sonar: echolocation signals and the evolution of echolocation.J. Comp. Physiol. A 135, 61-84.
Slabbekoorn, H.(2013). Songs of the city: noise-dependent spectral plasticity in the acoustic phenotype of urban birds.Anim. Behav.85, 1089-1099.
Slabbekoorn, H. and Peet, M.(2003). Birds sing at a higher pitch in urban noise. Nature424, 267.
Surlykke, A., Boel Pedersen, S. and Jakobsen, L.(2009). Echolocating bats emit a highly directional sonar sound beam in the field.Proc. R. Soc. B Biol. Sci.276, 853-860.
Suthers, R. A.(2010). Sound production: vertebrates. InEncyclopedia of Animal Behavior, Vol. 3 (ed. M. Breed and J. Moore), pp. 293-303. London: Academic Press.
Tressler, J. and Smotherman, M. S.(2009). Context-dependent effects of noise on echolocation pulse characteristics in free-tailed bats.J. Comp. Physiol. A195, 923-934.
Ulanovsky, N., Fenton, M. B., Tsoar, A. and Korine, C.(2004). Dynamics of jamming avoidance in echolocating bats. Proc. R. Soc. B Biol. Sci. 271, 1467-1475.
Wiegrebe, L.(2008). An autocorrelation model of bat sonar.Biol. Cybern.98, 587-595.
Journal
of
Experimental