Document Version 1.3 September 2000 Copyright © COSMIC Software Inc. 1999, 2000
EVAL12
IDEA, C Cross Compiler with ZAP SIM
Evaluation kit for Motorola’s 6812
1
Quick Start Guide
EVAL12 Quick Start Guide
w
Overview
w
Installing EVAL12
w
IDEA/COMPILER Tutorial
w
ZAP 6812 SIM Tutorial
w
Running IDEA
w
Managing a project
w
Building a project
w
Debugging a project
S
TARTOverview
Who is Cosmic Software?
Cosmic Software provides highly-optimized target support for Motorola microcontrollers and microprocessors, including 68HC05, 68HC08, 6809, 68HC11, 68HC12, 68HC16, CPU32/ CPU32+, and M680x0, with others in development.
The product line includes complete ANSI/ISO C language cross compilers, macro assemblers, linkers, utilities, ZAP C and assembler source-level cross debuggers, and the IDEA integrated development environment. These products are prepackaged and ready-to-run on PC/Windows workstations. Cosmic Compilers are known worldwide for highly optimized code generation while still providing all of the benefits of portable high level code.
The ZAP debugger product line is packaged to work off-the-shelf with popular debugging hardware configurations, such as low-cost evaluation boards or In-Circuit Emulators. The simulator versions of ZAP allow application code to be debugged entirely on a PC without access to target hardware, and can therefore simplify the development effort by providing for a “software debugging” phase before hardware/software integration.
The IDEA integrated development environment provides a Windows-based graphical user interface (GUI) for building and managing projects. IDEA is fully integrated with all Cosmic tools, including compilers, assemblers, linkers, utilities, and ZAP debuggers.
What is IDEA?
With IDEA you can create and edit projects; compile, assemble and link C or assembler code; run an application Make or Build; and run a ZAP debugger session; all with a few simple mouse clicks in a user-friendly, graphical Windows interface.
Using IDEA
The IDEA GUI (graphical user interface) provides immediate access to all the tools you need to manage full projects.
The Project window at the left provides a graphical, tree-struc-tured view of your project. Using just the Project window, you can add or remove files from the project, set compiler options, configure build utilities, and much more.
The File windows at the right allow you to open project files for editing and compiling. IDEA provides color-coding of Comments, Preprocessor Keywords, C Keywords, and several other coding items so that you can easily edit source code files.
All IDEA functionality is available from the nine drop-down menus under the title bar. The most frequently used options are also available via a single click on the Tool bar. In addition, you can assign custom key bindings to any program option.
Installing EVAL12
Preparing for installation
Installation requirements
In order to run IDEA, your system must meet the following minimum hardware and software requirements:
• PC with an 80386 or better microprocessor • Microsoft Windows 95/98 or Windows NT OS
• 3 1/2'', 1.44 Mb diskette drive and/or CD ROM Drive
• Hard disk drive with at least 15 Mb of free space • 16 Mb of RAM
Eval12 media
Your EVAL software package consists of the IDEA Integrated Development Environment, CX6812 Cross Compiler and ZAP 6812 Simulation debugger programs, documentation and installation script files, and is supplied on a CD ROM or several 3 1/2'', 1.44 Mb floppy diskette. The diskette/CD label identifies the product and the product version number.
Evaluation Restrictions
Eval12 contains a full featured size restricted version of the Cosmic IDEA, Compiler/Assembler and ZAP Simulator debugger products. This evaluation is designed to demonstrate the options and features of the tools, but limit the size of the application. The following size restrictions are imposed on the Evaluation version. The Commercial version imposes no size restrictions whatsoever.
An IDEA project is limited to 8 source files
Source files are limited to 150 lines and 5 include files
Installation process
In the installation instructions that follow, we assume that your floppy disk drive is designated by the letter “A”, your CD ROM drive as “D:” and your hard disk partition by the letter “C”. If your system uses different letter designations, change the installation instructions accordingly.
IDEA is installed by an Installshield Setup utility program. Throughout the installation procedure, there is an assumed default directory in which IDEA is installed. This directory is C:\Cosmic\Eval12.
If you install IDEA in a different directory or on a different hard disk drive, you must substitute your specified location wherever you see C:\Cosmic\Eval12.
Running the installation program
1. Insert the EVAL CD ROM or Disk1 into the appropriate drive.
2. Open the Windows Explorer and in the left pane double click on “3 1/2 Floppy (A:)” or “CD ROM (D:) drive.
3. In the right pane, double click on Setup.exe to run the IDEA installation and setup program.
As an alternative to Steps 2 and 3 you can use the RUN command from the Windows Start Menu and type
a:\setup to run the installation program.
4. The Welcome screen appears.
Figure 1-2: Welcome screen
Click on Next> when you are ready to proceed.
5. The Software License Agreement screen appears.
Figure 1-3: Software License Agreement
6. The Choose Destination Folder screen appears.
Figure 1-4: Choose Destination Folder dialog box
Select the destination folder where you want Eval 12 to be installed. By default, Eval 12 will be installed in the C:\Cosmic \Eval12 folder. You can select the default or click on the Browse button to specify a different location. The Installation program will create the following directory structure:
Destination Folder\ \Examples
\paged_example \Docs
\Lib \H6812
7. The Select Program Folder screen appears.
Figure 1-5: Select Program Folder screen
Specify a program folder for IDEA and ZAP SIM and click on Next> to proceed.
8. The next screen that appears depends on whether your host system is running Windows NT or Windows 95/98.
Windows 95/98 Installation
Figure 1-6: Windows 95/98 Path Setup
If your host computer is running Windows NT, the following dialog box will appear. If you choose “YES” the compiler execution Path will be added to the Path Environment variable under HKEY_CURRENT_USER which will allow you to execute the compiler from any Command shell. If you choose “NO”, the compiler path is not registered and the compiler will only work from IDEA or from a Command shell created by IDEA. The batch file cx6812_path.bat is created in the desti-nation folder and contains the appropriate execution path necessary to uses the compiler from any Command Shell.
9. The Installation program proceeds with the installation of EVAL12. After the installation is complete, the Setup Complete screen appears.
Figure 1-8: Setup Complete screen
If you want to run the compiler from any Command shell you need to restart Win 95/98 systems for the changes to autoexec.bat to take effect. Select Yes to have the install program restart your computer. Note: It is not necessary to reboot Windows NT for the changes to the Registry Path to take effect.
IDEA/Compiler Tutorial
This evaluation kit is preconfigured with a demo project that will compile and build for execution with ZAP 6812 SIM. To build the demo application perform the following steps:
• Open “Idea CPU12 (Eval)” from the Windows Start menu. i.e. select Programs > Cosmic Tools > Eval12\Idea CPU12 (Eval)
• The demo files are located in the Examples subfolder created under your chosen installation folder.
• Select demo 12.prj from the history list on the Project Menu to load the demo project.
• Right Click on the Project Name “demo12” at the top of the Project window and choose Build from the pop-up. This will build the application executable (demo12.h12), generate S-records (demo12.s19) and absolute listings (demo.la, sieve.la ..) The file demo12.h12 is ready to download into ZAP.
• To review the compiler options used, expand the Tools icon and right click on Compiler.
• Right click on Linker under tools to review or edit the link command file or linker options.
• Click on the ZAP Debugger icon to open ZAP and automat-ically load the demo application. See the section “ZAP 6812 SIM” tutorial below for more on ZAP.
68HC12 Paged Examples
The 68HC12 evaluation includes 4 example projects. One project is non paged and 3 projects are paged. Two of the paged projects are built for the MCS912DP256 and one is built for the DG128A or any other HC912 device with 128K of on-chip Flash. To build and debug the 128K paged demo perform the following steps:
• The non paged demo files are located in the \Examples\ subfolder created under your chosen installation folder.
• Select demo 12.prj from the history list on the Project Menu to load the non paged demo project.
• The 128 K paged demo files are located in the
\Examples\128K_paged_example subfolder created under your chosen installation folder. Select demo12_paged.prj from the history list on the Project Menu to load the paged demo project. To build the application:
1. Choose Build from the Project menu of IDEA. This will build the application executable (.h12), generate S-records (.s19) and absolute listings (demo.la, sieve.la ..) The project file with the .h12 extenstion is ready to download into ZAP.
2. To review the compiler options used, expand the Tools icon and right click on Compiler.
3. Right click on Linker under tools to review or edit the link command file or linker options.
4. Click on the ZAP Debugger icon to open ZAP and automatically load the demo application. See the section “ZAP 6812 SIM” tutorial below for more on ZAP.
• To build the DP256 example select
\Examples\DP256_example\test.prj from the project menu and repeat steps on through 4. This example links each page of the 256K flash explicitly.
• To build the DP256 packed example select
\Examples\DP256_example\packed\test.prj from the project menu and repeat steps on through 4. This example uses the linkers automatic bank packing mechanism to fill the 256K flash. Note the entire application fits into one page (Bank).
ZAP 6812 SIM Tutorial
Welcome to the COSMIC ZAP debugger tutorial. This tutorial is designed to give you a small sample of the many features of ZAP SIM as you go through a typical Windows debugging session.
Starting ZAP and Loading an Application
If you’ve just gone through the IDEA tutorial ZAP should already be open with the demo project loaded. Skip to the section titled
“Executing the application”.
Non Paged Example
• From the Windows Start menu, select
Programs > Cosmic Tools > Eval12\ZAP 6812 SIM (Eval) to start ZAP. This example was written for a 912B32 processor, but is applicable to any non paged 68HC12 application. It is located in the \Examples folder created under your chosen instal-lation folder.
• Choose load from the file menu and select the non paged example file demo12.h12 located in the \Examples\ folder. Skip over the Paged Examples and Goto the section entitled “Display
Options” to complete the tutorial with the non paged example.
Paged Examples
• From the Windows Start menu, select
Programs > Cosmic Tools > Eval12\ZAP 6812 SIM (Paged Eval) to start the paged version of ZAP 6812 SIM.
128K Flash Example
pages at 0x4000 and 0xC000.
• Choose load from the file menu and select the 128K paged example file demo1_paged2.h12 located in the
\Examples\128K_Paged_example\ folder. Goto the section named “Display Options” to complete the tutorial with the 128K Example.
DP256 Flash Example
There are two DP256 examples. They are both made up of the same code modules, but are linked differently. One is linked with an explicit page for each 16K block of memory and the other uses the linkers automatic bank allocation mechanism and is refereed to as the packed example.
• Select DP256 from the target menu of ZAP to setup the proper paging simulation for a 256K Flash part with fixed pages at 0x4000 and 0xC000.
• Choose load from the file menu and select
\Examples\DP256_Example\test.h12 to load the example with explicit pages. Goto the section named “Display Options” to complete the tutorial with the DP256 Example.
• Choose load from the file menu and select
\Examples\DP256_Example\Packed\test.h12 to load the packed DP256 example. Goto the section named “Display Options” to complete the tutorial with the DP256 packed Example. Note: Since the example is very small, all of the code fits into one page. We recommend that you use the standard example to see how the paging mechanism works with ZAP.
Figure 1-9: ZAP Debugger with Project loaded
Display Options
Let’s take a look at some of the various display options. During a typical debugging session you‘ll probably want to monitor a couple of variables, keep an eye on the stack and watch the CPU registers as you execute the code. In order to do this we’re going to open a monitor, stack and register window as follows. Note: The config file (zaps12.ini) supplied with EVAL12 should open these windows automatically so you can skip this section and go to the section “Executing the Application”.
• Choose Monitors from the Show menu to open up a monitor window.
• Choose Stack from the Show menu to open up the stack window.
Status Bar
Disassembly Window Source Window
Menu and Button Bar
Command Window
Monitor Window
• Choose Registers from the Show menu to open up the register window. Notice the cycle counter at the bottom of the Register window (simulator only). This provides an accurate MCU cycle count between execution points.
To make it easier to execute the most commonly used commands let’s open up the Button Bar.
Figure 1-10: ZAP Button Bar
Executing the Application
There are several ways to execute your code. Let’s try a couple of examples.
• Click on StepI in the Button Bar or select Step Inst from the debug menu to step one assembler instruction.
• Click on Step High Level Instruction (Source) in the Button Bar to step one Source Instruction.
• Select “Go Till” from the Debug Menu and select the function main.
• Choose Destination Folder\Examples and add it to the search path. Note: Destination Folder is the root folder where Eval12 was installed. The C code should now appear in the source window.
• Now Click on Step High Level again to execute the first C instruction.
• We’re now going to step a couple of C lines and for this example we want to step into the function “clear_ports( )” so we’ll choose
High Level Step from the Button Bar. Click on this button until the Blue Highlight in the Source window returns from the clear_ports( ) function.
Note the matching C and assembly code highlights for the current Program Counter (PC) in the Source and Disassembly Windows. The yellow highlight in the disassembly code denotes the assembly instructions that make up the single Blue highlighted line of C code.
function “toggle_bits( )” silently and return and stop on the next source line in function “main”.
Monitor and Evaluate Expressions
Now let’s monitor a couple of global variables so we can follow the application’s output.
• Double click on the variable reset_add and choose monitor to add it to the Monitor window.
• Double click on the variable memptr and countand choose monitor to add them to the Monitor window as well.
You can also select an expression to monitor or evaluate. Try the following:
• Select “Go Till” from the Debug Menu and select the function “sieve”.
• Left Click and drag to highlight prime_table[count] and select monitor to add just the one array member to the Monitor window.
If you want to monitor a valid expression that is not available in the source window you can use the Command window.
e.g. Monitor prime_table[6].
• Click on the Command window and press the enter key then type monit prime_table[6] at the ZAP prompt.
You can change the display format of any variable by double clicking on the variable in the Monitor window. Let’s change the display formats for prime_table[6].
• Double click on prime_table[6] in the Monitor window and choose format from the pop-up menu
• Select hexadecimal to display the value of prime_table[6] in hex notation.
• If you want to view all of the variables in the application select “Variables->In Global List” from the Browser menu.
the function toggle_bits( ) which uses a union between a bit field structure and a char.
• Choose Go Till from theDebugMenu and select toggle_bits.
• Double click on the variable PORTX and select Evaluate to open the structure editor. Notice this displays both members of the union.
Breakpoints
To set a breakpoint simply Double click (Left mouse button) on any active line number in the Source window or Source Browser window. You can also double click on an address in a Disassembly window. Let’s reset the application and set some breakpoints.
• Select Reset from the Debug menu
• Select Go Till “main” from the Debug menu.
• Double click on the line number to the left of the C line “clear_ports( ); ” in the function “main”. You’ll notice the line number is highlighted in red to signify that there is a breakpoint set.
• Click on Go on the Button Bar to execute to the breakpoint.
• Choose Function Listfrom Browse menu to open a list of all the source files and functions which make up the demo application.
• Double click on the function name “toggle_bits( )” to open up a source browser window containing the source to the function.
• Let’s set a breakpoint on the line “for (i = 0; i < count; i++)” by double clicking on its line number.
• Click on Go on the Button Bar to execute the code to the break-point.
• Let’s delete the other breakpoints. Choose Events from the Browse menu. Double click on each breakpoint and choose delete from the pop-up. Alternatively, select the Command window and type the following to delete all events:
Zap> del /e *
ZAP SIM also supports Data Breakpoints (events). Let’s set a Data Event on the global variable count such that the program execution will stop when count is written to.
• Select Reset from the Debug menu
• Select Go Till “main” from the Debug menu.
• Double click on the variable count and select “Write Break” from the pop-up. Click on Go and you should see ZAP stop after count is written.
• Choose browse Events and delete the breakpoint by double click-ing on it.
Browser
ZAP lets you browse all of the source code in the application and dump any memory locations using several different formats.
• Choose Memory from the Browse menu, enter an address and choose to view memory as Data or as Code (i.e. disassembly). • If you choose Code you’ll see a disassembly of the memory in
which you can set a breakpoint on any address.
• If you choose data you can select a display format and you can click directly on any value and modify it.
Program Analysis
Let’s look at a couple of reports. First you need to Reset and zero out the analyzer.
• Select Reset from the Debug menu
• Select Go Till “main” from the Debug menu.
• Select “Performance->Zero” from the Analyzer menu. • Set a Breakpoint on the first line inside the “for (; ;)” loop.
• Click on Go twice to execute completely through the loop once to collect some execution data. This may take a minute or two.
Performance Analysis
• Select “Performance->view” from the Analyzer menu to view the performance analysis graph.
• Double click on a function name in the Performance Analysis window for execution details.
Code Coverage
• Select “Code Coverage->full” for a report that details what code has been executed.
• The Source window and Source Browser windows maintain a colored icon next to each source line which denotes whether an instruction has been executed or not. A Green icon means the code has been executed and a red icon means the code has not been executed.
• Select “Variable Usage->Full” to create a printable report detailing variable usage.
Running IDEA
Starting IDEA
From the Windows Start menu, select Programs > Cosmic Tools > Eval12\Idea12
The IDEA main window appears:
Figure 1-11: IDEA main window
Figure 1-12: IDEA main window with Open Project
The IDEA main window is the principal graphical user interface (GUI) for the Cosmic Compiler program.
For complete details on the components of the IDEA main window, refer to Chapter 4, IDEA User Interface in the IDEA User’s Guide.
Starting a new project
To start a new project, click on the New Project tool on the Tool bar, or select Project > New from the Main menu.
Figure 1-13: IDEA Project window with new project
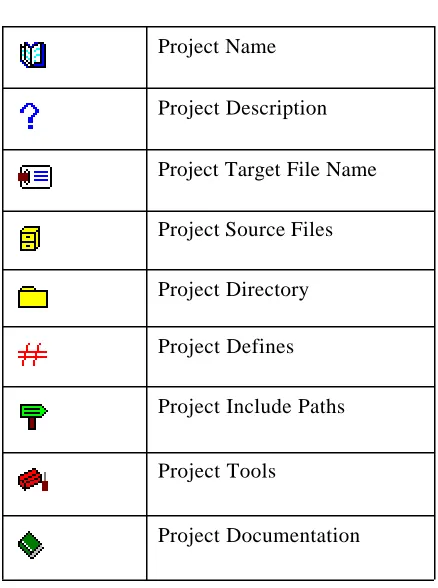
Table 1-1: Project Components
A sign next to a component icon means that sub-components are hidden below the icon. Click on the sign or double click on the icon to display the sub-components.
A sign next to a component icon means that the first level of sub-components below the icon is displayed. Click on the sign or double click on the icon to hide the sub-components.
For additional details on the Project window, refer to Chapter 4, IDEA User Interface in the IDEA User’s Guide.
For details on project management, refer to Chapter 7, Managing an IDEA Project in the IDEA User’s Guide.
Project Name
Project Description
Project Target File Name
Project Source Files
Project Directory
Project Defines
Project Include Paths
Project Tools
Exiting IDEA
To exit IDEA, click on Exit in the File menu. Alternatively, type Alt+F+X.
Managing a Project
Opening the project
EVAL12 is supplied with an example project called “demo12.prj”, You can use this example project to become familiar with the principles of managing an IDEA project.
If you opened a new project earlier, save it by clicking on the Save
Project tool on the Tool bar. Close the project by selecting Project > Close from the Main menu.
To open the example project, click on the Open Project tool on the Tool bar. In the dialog box that appears, select demo12.prj from the Examples folder. The Project window appears with the
demo12.prj project opened.
Naming the project
The Project Name component lets you specify a name for the project. It also represents the parent component for all project sub-components.
To specify a name for the project, click on the Project Name
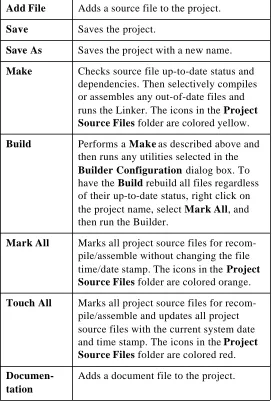
Right click on the Project Name icon to view a menu of project commands. These commands are shown in the following Table.
Table 1-2: Project commands
Add File Adds a source file to the project.
Save Saves the project.
Save As Saves the project with a new name.
Make Checks source file up-to-date status and dependencies. Then selectively compiles or assembles any out-of-date files and runs the Linker. The icons in the Project Source Files folder are colored yellow.
Build Performs a Make as described above and then runs any utilities selected in the Builder Configuration dialog box. To have the Build rebuild all files regardless of their up-to-date status, right click on the project name, select Mark All, and then run the Builder.
Mark All Marks all project source files for recom-pile/assemble without changing the file time/date stamp. The icons in the Project Source Files folder are colored orange.
Touch All Marks all project source files for recom-pile/assemble and updates all project source files with the current system date and time stamp. The icons in the Project Source Files folder are colored red.
Documen-tation
Describing the project
The Project Description component lets you specify a short description for the project.
To specify a description for the project, click on the
Project Description icon . A text cursor appears to the right of the icon. Click on the text cursor to open a text box and enter a short project description.
Naming the project target file
The Project Target File Name component lets you specify a target file name for the project (for example, demo12.h12). The name entered here is the actual name of the linked executable which can also be modified under Tools->Linker ->options->Output to File.
To specify a project target file name, click on the Project Target File
Name icon .
A text cursor appears to the right of the icon. Click on the text cursor to open a text box and enter a target file name. Be sure to include the target file name extension; for example, “.h12” for the Cosmic 6812 compiler.
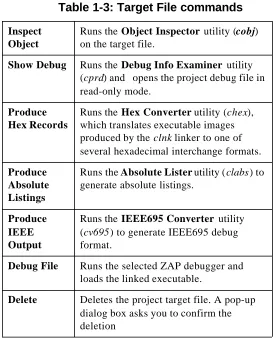
Table 1-3: Target File commands
Inspect Object
Runs the Object Inspector utility (cobj) on the target file.
Show Debug Runs the Debug Info Examiner utility (cprd) and opens the project debug file in read-only mode.
Produce Hex Records
Runs the Hex Converter utility (chex), which translates executable images produced by the clnk linker to one of several hexadecimal interchange formats.
Produce Absolute Listings
Runs the Absolute Lister utility (clabs) to generate absolute listings.
Produce IEEE Output
Runs the IEEE695 Converter utility (cv695) to generate IEEE695 debug format.
Debug File Runs the selected ZAP debugger and loads the linked executable.
Managing project source files
The Project Source Files component lets you specify the C and Assembly language source files to be included in the project.
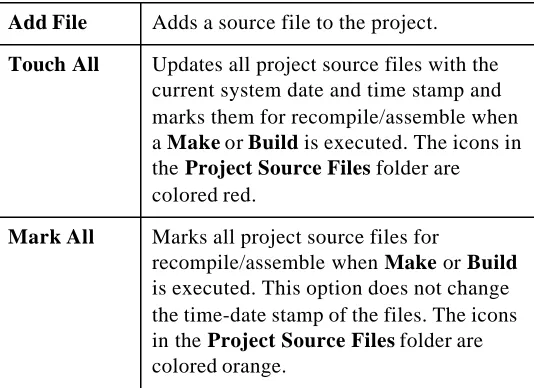
[image:36.612.155.422.281.475.2]Right click on the Project Source Files icon to view a menu containing source file management commands. These commands are shown in the following Table.
Table 1-4: Source file management commands
Add File Adds a source file to the project.
Touch All Updates all project source files with the current system date and time stamp and marks them for recompile/assemble when a Make or Build is executed. The icons in the Project Source Files folder are colored red.
Mark All Marks all project source files for
Adding source files to the project
You can add source files to the project using the Add File command or the Windows Explorer.
• To add a source file using the Add File command, right click on the Project Source Files icon, select Add File, and select the file(s) to add from the Add File dialog box. • To add a source file using Windows Explorer, select the
Windows Explorer tool on the Tool bar. Windows Explorer appears next to the Project window. Select a file(s) from Windows Explorer and drag it to the Project window.
Using either method, you can select more than one source file at a time using standard Windows conventions for selecting and grouping files.
Working with individual source files
Each source file included in the project is listed next to a
Source File icon . The Source File icon lets you view the source file and its attributes.
[image:37.612.190.466.511.624.2]Right click on the Source File icon to view a menu containing source file commands. These commands are shown in the following Table.
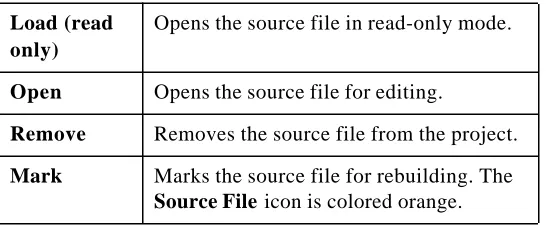
Table 1-5: Source file commands
Load (read only)
Opens the source file in read-only mode.
Open Opens the source file for editing.
Remove Removes the source file from the project.
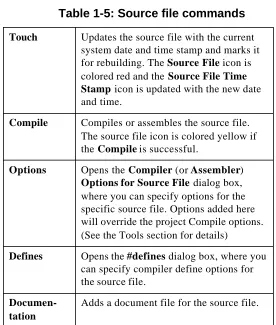
Each icon in the source file tree represents a source file component. The source file components are described in the following Table.
Touch Updates the source file with the current system date and time stamp and marks it for rebuilding. The Source File icon is colored red and the Source File Time Stamp icon is updated with the new date and time.
Compile Compiles or assembles the source file. The source file icon is colored yellow if the Compile is successful.
Options Opens the Compiler (or Assembler) Optionsfor Source File dialog box, where you can specify options for the specific source file. Options added here will override the project Compile options. (See the Tools section for details)
Defines Opens the #defines dialog box, where you can specify compiler define options for the source file.
Documen-tation
[image:38.612.150.426.153.478.2]Adds a document file for the source file.
Table 1-6: Source File Components
Source File Time Stamp
Source File Documentation
Source File Options
Source File Defines
Source File Dependencies
Source File Functions
Appears only if Project Analysis option is selected in Options sub-menu.
Source File Variables
Source File Time Stamp
The Source File Time Stamp component and icon shows the day, date, and time that the file was last saved or “touched”.
Source File Documentation
The Source File Documentation component shows all documents that are associated with the source file.
Right click on the Documentation icon and select Add Doc to associate a documentation file with the source file.
The Document component lets you view, edit, or remove a document associated with a source file. The
appearance of the Document icon varies, depending on the type of document.
Right-click on the Document icon to view a menu containing documentation file commands. The documentation file commands are described in the following Table.
Table 1-7: Documentation file commands
Load (read only)
Opens the document in read-only mode.
Open Opens the document for editing using the appropriate Windows-registered appli-cation.
Source File Options
The Source File Options component lets you specify compiler or assembler options for the source file. These options override the default project compiler or
assembler options.
Right-click on the Source File Options icon to open the Compiler (or Assembler) Options for Source File dialog box.
The Compiler (Assembler) Options dialog box has five tabs:
• General options
• Optimizer options • Listings options • Miscellaneous options
• User Flags
Choose a tab and select the desired options. Selected options are displayed in bold and unselected options are greyed out. To select an option simply click on the option description. To deselect an option click on the option again.
For a detailed explanation of compiler and assembler options, refer to Chapter 8, IDEA Command Reference in the IDEA User’s Guide.
The source file compiler or assembler options will override the project compiler and/or assembler options.
Refer to “Setting default compiler options” on page 1-52 or “Setting default assembler options” on page 1-53 for details.
Source File Defines
The Source File Defines component lets you specify compiler #define options for a source file.
Figure 1-16: Source File #defines
To add a symbol to the list, enter the symbol in the Item field and click on Add. To remove a symbol from the list, select the symbol and click on Remove.
The source file Defines will override the project Defines.
You can also add the current project #defines to the source file #define list by clicking on Add Project Defines.
Refer to “Specifying Project Defines ” on page 1-48 for details.
After you add #defines, they appear as individual sub-components in the Defines list, each one after a Define
icon. In addition, the day, date, and time that the #defines were last updated is shown next to the Source File Defines icon.
Source File Dependencies
The Source File Dependencies component and icon let you view the files that are included in the source file #includes.
The File icon shows a file that is named in the source file #includes. If the file name is enclosed in brackets, it is a system include file and is not typically modified in each project.
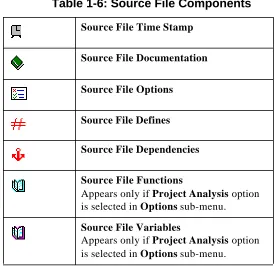
[image:44.612.152.424.412.610.2]If the file name is enclosed in quotes, it is a user include file and can be modified. Right-click on the File icon to display a menu include file commands. The include file commands are described in the following Table.
Table 1-8: Include file commands
Open Opens the file with the application in the Windows extension (File Types) Registry
Edit Opens the file in IDEA for editing
Load (read only)
Opens the file in read-only mode.
Open Opens the file for editing.
Touch Updates the file with the current system date and time and marks it for rebuilding.
Source File Functions
The Source File Functions component and icon let you view the functions defined in the source file. The
Function icon shows a function in the source file and lists all of the variables local to that function. Right-click on the Function icon to open the source file at the function.
Source File Variables
The Source File Variables component and icon let you view the variables that are local to the source file.
The Variable icon shows a variable declared with the source file.
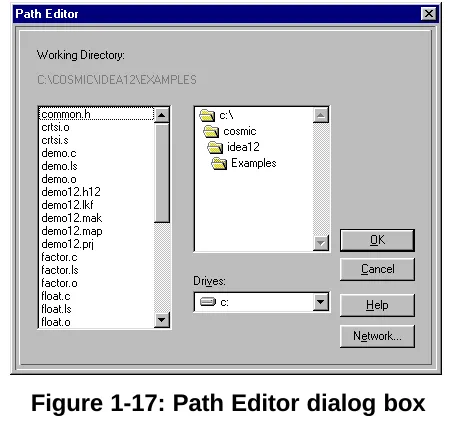
Specifying the project directory
The Project Directory component is used to set the working
directory for the project. This is typically where the source code files for the project are located.
Right-click on the Project Directory icon to open the Path Editor dialog box and set the path to the source files.
Functions and Variables appear in the Project window only if Project Analysis is selected from the Options menu.
Figure 1-17: Path Editor dialog box
The Folder icon shows folders in the project directory.
The File icon shows files in the project directory.
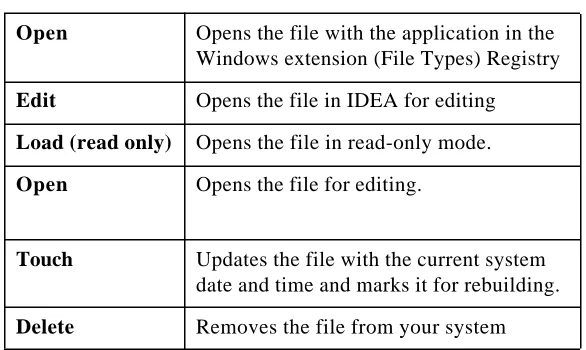
[image:46.612.175.400.162.377.2]Right-click on the File icon to display a menu with file commands. The file commands are described in the following Table.
Table 1-9: File commands
Open Opens the file with the application in the Windows extension (File Types) Registry
Edit Opens the file in IDEA for editing
Load (read only)
Opens the file in read-only mode.
Touch Updates the file with the current system date and time and marks it for rebuilding.
Delete Removes the file from your system
Specifying Project Defines
The Project Defines component lets you specify #define options for the project.
Right-click on the Project Defines icon to open the #defines dialog box and specify preprocessor symbols.
Figure 1-18: Project #defines dialog box
To add a symbol to the list, enter the symbol in the Item field and click on Add. To remove a symbol, select it and click on Remove. Symbols defined as project #defines can be imported into source file #defines. Refer to “Source File Defines” on page 1-42 for details. After you add project #defines, they appear as individual
sub-compo-nents in the Defines list, each one after a Define icon .
Specifying project include paths
The Project Include Paths component lets you specify include paths for the compiler (-i > option).
Right-click on the Project Include Paths icon to open the Include Path Editor dialog box and specify up to twenty include paths for the project.
Figure 1-19: Include Path Editor
You can specify paths in any desired order. The paths are searched from top to bottom by the compiler.
You can use the Drives and Directory fields to specify the include path. Click on Append to add the path to the bottom of the list in the Path field.
To position the new path before or after the selected path, select an include path in the Path field and click on Add Before or Add After.
Include path folders and files
The Include Path Folder icon shows folders for include
file paths in the project directory. The Folder icon shows folders in an include file path.
The File icon shows files in an include file path. Right-click on the File icon to display a menu with the following
commands:
Configure project tools
The Project Tools icon lets you set project default options for: • Compiler
• Assembler • Linker • Builder • Debugger
[image:50.612.142.435.299.474.2]The Builder component lets you configure build utilities for the
Table 1-10: Include file commands
Open Opens the file with the application in the Windows extension (File Types) Registry
Edit Opens the file in IDEA for editing
Load (read only) Opens the file in read-only mode.
Open Opens the file for editing.
Touch Updates the file with the current system date and time and marks it for rebuilding.
project, including:
Setting default compiler options
The Compiler component lets you set the default compiler options that are used to compile all C code (.c) files in a project.
Right click on the Compiler icon to open the Compiler Options dialog box. You can also double-click on the
Compiler icon to display the Compiler Options icon and then right-click on the Compiler Options icon to open the Compiler Options dialog box.
The Compiler Options dialog box has five tabs: • General options
• Optimizer options • Listings options • Miscellaneous options • User Flags
Choose a tab and select the desired options. Selected options are displayed in bold and unselected options are greyed out. To select an option, simply click on the option description. To deselect an option, click on the option again.
For a detailed description of compiler options, refer to Chapter 8, IDEA Command Reference in the IDEA User’s Guide.
The default compiler options can be overridden by setting compiler options for the individual source files. Refer to “Source File Options” on page 1-41 for details.
Setting default assembler options
The Assembler component lets you set the default assembler options that are used to assemble all assembly language (.s) files in a project.
Right click on the Assembler icon to open the Assembler Options dialog box. You can also double-click on the
Figure 1-21: Assembler Options
dialog box
The Assembler Options dialog box five tabs: • General options
• Optimizer options • Listings options • Miscellaneous options • User Flags
Choose a tab and select the desired options. Selected options are displayed in bold and unselected options are greyed out. To select an option, simply click on the option description. To deselect an option, click on the option again.
For a description of assembler options, refer to Chapter 8, IDEA Command Reference in the IDEA User’s Guide.
Setting default linker options
The Linker component lets you set the default clnk utility options that are used to link all files in a project. You can also specify a linker command file and edit the file.
Right click on the Linker icon to view a menu containing linker commands. The linker commands are described in the following Table.
You can also double-click on the Linker icon to display the
Linker Options icon and the Linker Command File
icon .
Setting the linker configuration
Select Options from the Project Linker menu (or right-click on the Linker Options icon) to open the Link Configuration dialog box.
The Link Configuration dialog box lets you specify: • Linker options
• Libraries path option
[image:55.612.189.463.284.413.2]• Reporting mode option • Memory banking option
Table 1-11: Linker commands
Options Opens the Link Configuration dialog box.
Edit Com-mand File
Opens the project link command file for editing.
Change Command File
Figure 1-22: Link Configuration dialog box
Specifying linker options
After you select any one of these files, you can click on the Find button to specify the file name and path.
Table 1-12:
Clnk
utility options
Output file (-o option): writes output to the specified file. This option is required and corre-sponds to the Project Target File.“Naming the project target file” on page 1-34.
Command file (.lkf)
The linker command file. This option is required and has no default value.
Map file (-m option): produces a text file with map information for the program being built.
[image:57.612.185.465.162.361.2]Specifying the libraries path
Click on the Libs Path button to open the Libraries Path Editor and set a path to the compiler library (-l > option).
Figure 1-23: Libraries Path Editor
You can specify a list of library paths in any order. The paths are searched from top to bottom. After you add paths, they appear in order next to the Libs Path button.
Editing the linker command file
Before you can edit a linker command file, you must first check the Command File check box in the Link Configuration dialog box and then specify a linker command file name and path.
[image:59.612.186.459.164.348.2]Select Edit Command File from the Project Linker menu (or right-click on the Linker Command File icon) to open the linker command file for editing.
Table 1-13: Other
Clnk
utility options
Verbose (-v option): be verbose.
Symbols Only
(-s option): create an output file contain-ing only an absolute symbol table, but still with an object file format.
Memory Banking
Figure 1-24: Linker command file
for demo12.prj
To edit the linker command file, you can make changes directly in the file using the options in the Edit menu. Type Alt+E to view the editing options. You can also right click to view a menu of editing options.
For complete details on linker command file editing options, refer to Chapter 8, IDEA Command Reference in the IDEA User’s Guide.
Changing the linker command file
Select Change Command File from the Project Linker menu to change the linker command file. The Select Linker Command File dialog box lets you specify a file name and path for the new linker command file.
Specifying project builder utilities
The Project Builder component lets you specify utilities for building the project.
Right click on the Project Builder icon to open the Builder Configuration dialog box. You can also double-click on the Project Builder icon to display the Builder Options
icon , and then right-click on the Builder Options icon to display the Builder Configuration dialog box.
Figure 1-25: Builder Configuration dialog box
Table 1-14: Builder utilities
Run Object Inspector
Runs the cobj utility to examine object modules. If you select Run Object Inspector and then click on the Options button, the Options dialog box appears. Refer to “Configuring the Object
Inspector utility” on page 1-63 for details.
Convert to S-Records
Runs the chex utility to translate object module format to hexadecimal format. If you select Convert to S-Records and then click on the Options button, the CHEX Configuration dialog box appears. Refer to “Configuring the Hex Converter utility” on page 1-65 for details.
Run Debug Info Examiner
Runs the cprd utility to print debugging information about functions and data objects. If you select Run Debug Info Examiner and then click on the Options button, the CPRD Configuration dialog box appears. Refer to “Configuring the Debug Info Examiner utility” on page 1-67 for details.
Run Absolute Lister
Configuring the Object Inspector utility
The cobj utility lets you inspect relocatable object files or executable output by the assembler or linker. The cobj utility can be used to check the size and configuration of relocatable object files or to output information from their symbol tables.
Right click on the Object Inspector icon and select Options to open the Options dialog box. You can also double-click on the Object Inspector icon to display the Options
icon and then right-click on it to display the Options dialog box.
Run IEEE 695 Converter
Runs the cv695 utility to generate IEEE695 format. If you select Run IEEE 695 Converter and then click on the Options button, the CLABS Configu-ration dialog box appears. Refer to “Configuring the IEEE695 Converter utility” on page 1-71 for details.
Run User Utility 1
Runs the specified user utility. You can specify a path and filename for any utility.
Run User Utility 2
[image:63.612.184.465.156.348.2]Runs the specified user utility. You can specify a path and filename for any utility.
Figure 1-26:
cobj
utility Options dialog box
Selected options are displayed in bold and unselected options are greyed out. To select an option simply click on the option description and it is added to the command line. To deselect an option click on the option again.
For complete details on the cobj utility options, refer to Chapter 8, IDEA Command Reference in the IDEA User’s Guide.
Configuring the Hex Converter utility
The chex utility translates executable images produced by the clnk utility to one of several hexadecimal interchange formats.
Right click on the Hex Converter icon and select Options to open the CHEX Configuration dialog box. You can also double-click on the Hex Converter icon to display the
Options icon and then right-click on it to display the CHEX Configuration dialog box.
Figure 1-27: CHEX Configuration dialog box
Table 1-15:
chex
utility options
Motorola S Records format
(-fm option) - produces S1 and S2 records as needed.
Motorola S2 Records format
(-f2 option) - produces S2 records only. This is the default.
Intel Hex format
(-fi option)
Absolute Start Address
(-a option) - the output address of the first byte.
Address Bias
(-b option) - subtract from any address before output.
Max Bytes per line
(-m option) - maximum data bytes per line. The default is 32 bytes per line.
Do not Output Header
(-h option)
Output Paged Addresses
(-p option)
Output by Increasing Addresses
(-s option)
Output to File
[image:66.612.149.428.162.602.2]Configuring the Debug Info Examiner utility
The cprd utility extracts and prints information about functions and data objects from an object module or executable image that has been compiled with the +debug option.
Right click on the Debug Info Examiner icon and select Options to open the CPRD Configuration dialog box. You can also double-click on the Debug Info Examiner icon to
display the Options icon and then right-click on it to display the CPRD Configuration dialog box.
Insert Header Sequence
(+h option)
Output named segments only
(-n option). Up to twenty different named segments can be specified.
To add a named segment to the Segments field, enter the named segment in the Item field and click on the Add button. To remove a named segment from the Segments field, select the segment and click on the Remove button.
[image:67.612.185.465.156.348.2]Figure 1-28: CPRD Configuration dialog box
The CPRD Configuration dialog box lets you build a list of files and functions for debugging purposes. Enter a file or function name in the Item field, and then click on Add to Files to add the item to the Files list or Add to Funcs to add the item to the Functions list.
If you check the Show File List check box, the Item field changes to a File List field, with a drop-down list of the files in the project directory. Select a file from the list and then click on the Add to Files button to add it to the Files list.
Each file in the Files list is processed with the -fl option, which prints debugging information about the file. By default, the cprd utility prints debugging information on all C source files. Each function in the Functions list is processed with the -fc option, which prints information only about the function. By default, the cprd utility prints debugging information on all functions in a file.
You can also specify a path and file name to receive the debugger output. This is equivalent to the cprd utility-o option. By default, the cprd utility writes debugging infor-mation to the terminal screen.
Configuring the Absolute Lister utility
The clabs utility processes relocatable C and Assembly listing files with the associated executable file to produce absolute listings with updated code and address values.
Right click on the Absolute Lister icon and select Options to open the CLABS Configuration dialog box. You can also double-click on the Absolute Lister icon to display the
Options icon and then right-click on it to display the CLABS Configuration dialog box.
The clabs utility options are described in the following Table.
Table 1-16:
clabs
utility options
Verbose (-v option) - the name of each module of the application is output to STDOUT.
Restrict to Project Directory
(-l option) - process files in the project directory only. The default is to process all files of the application.
Listing Extension
(-r option) - specify the input file extension. The default is “.ls”.
Absolute Listing Extension
Configuring the IEEE695 Converter utility
The cv695 utility converts a file produced by the linker into IEEE695 format.
Right click on the IEEE695 Converter icon and select Options to open the CV695 Configuration dialog box. You can also double-click on the IEEE695 Converter icon to
display the Options icon and then right-click on it to display the CV695 Configuration dialog box.
Figure 1-30: CV695 Configuration dialog box
Table 1-17:
cv695
utility options
Verbose (-v option) - the cv695utility displays information about its activity.
Reverse Bit-Field Numbering
(-rb option) - reverses bitfield from left to right.
Paging (+page# option) - this option is currently meaningful for the MC68HC12 only.
This option specifies the address format for bank-switched code. If you check the Paging check box, three options appear to the right:
Physical (+page1) - the application is banked and the cv695 utility outputs physical addresses. This is the default if Paging is checked.
Logical (+page2) - the application is banked and the cv695 utility outputs addresses in paged mode:
<page><offset_in_page>. This is equivalent to the old +paged flag. data paging (+dpage) - the application uses data paging.
Output to File
[image:72.612.149.428.161.594.2]Specifying a project debugger
Right-click on the Project Debugger icon to open a dialog box that allows you to specify a debugger for the project.
After you select a debugger, the path and filename appears after the Project Debugger icon.
Once you have specified a debugger, you can double click on the Debugger icon to run the ZAP debugger with the project target file opened. You can also run the debugger by clicking
on the Debugger tool in the Tool bar.
Specifying project documentation
The Project Documentation component shows all documents that are associated with the project.
Right click on the Documentation icon and select Add Doc to associate a documentation file with the project.
The Document icon lets you view, edit, or remove a document associated with the project. The appearance of the icon varies, depending on the type of document.
Right-click on the Document icon to view a menu containing documentation file commands. These commands are described in the following Table.
Table 1-18: Documentation file commands
Load (read only)
Opens the document in read-only mode.
Open Opens the document for editing.
Building a Project
After a project is configured, you need to build the application. There are a three different ways to do this:
1. Right click on the Project Name icon in the Project window and select Make or Build from the pop-up menu.
2. Choose Compile (single, open file), Make, or Build from the Project pull-down menu.
[image:74.612.137.433.214.541.2]3. Click on one of the following tools on the Tool bar:
Table 1-19: Tool bar tools for project building
Compile tool - compiles (.c file) or assembles (.s file) an open project source file. Options are specified in the
Compiler or AssemblerOptions dialog box.
Link tool - runs the linker (and no other utilities) using the options specified for the project in the Link Configuration dialog box. Project source files are not checked for up-to-date status.
For additional details on the project building tools, refer to Chapter 4, IDEA User interface in the IDEA User’s Guide.
For additional details on building an IDEA project, refer to Chapter 7, Building an IDEA Project in the IDEA User’s Guide.
[image:75.612.186.460.158.278.2]Build Project tool - performs a Make and then runs any utilities selected in the Builder Configuration dialog box. To have the Build rebuild all files regardless of their up-to-date status, right click on the project name, select Mark All, and then run the Builder.
Debugging a project
EVAL includes the Cosmic ZAP Simulator debugger. This allows you to debug your project on your PC.
You can open the ZAP Debugger by clicking on the Debugger
tool in the Tool bar.
Figure 1-31: ZAP Debugger with Project loaded
Before you can use the ZAP debugger, you must first specify its
location by right clicking on the Debugger tool in the Tool Browser (select Tools from the Main menu to open the Tool Browser). This opens a dialog box that allows you to specify the debugger for the project.
NOTE
Status Bar
Disassembly Window Source Window
Menu and Button Bar
Command Window
Monitor Window