Does habitual physical activity increase the sensitivity of
the appetite control system? A systematic review
BEAULIEU, Kristine, HOPKINS, Mark, BLUNDELL, John and FINLAYSON,
Graham
Available from Sheffield Hallam University Research Archive (SHURA) at:
http://shura.shu.ac.uk/11880/
This document is the author deposited version. You are advised to consult the
publisher's version if you wish to cite from it.
Published version
BEAULIEU, Kristine, HOPKINS, Mark, BLUNDELL, John and FINLAYSON, Graham
(2016). Does habitual physical activity increase the sensitivity of the appetite control
system? A systematic review. Sports Medicine, 46 (12), 1897-1919.
Copyright and re-use policy
See
http://shura.shu.ac.uk/information.html
Sheffield Hallam University Research Archive
1
Title: Does habitual physical activity increase the sensitivity of the appetite control system? A systematic review
Running heading: Physical activity level and appetite control
Kristine Beaulieu1*, Mark Hopkins1,2, John Blundell1 & Graham Finlayson1
1. School of Psychology, University of Leeds, Leeds, United Kingdom, LS2 9JT
2. Academy of Sport and Physical Activity, Sheffield Hallam University, Sheffield, United Kingdom, S10
2BP
*Corresponding author. Email: [email protected]; telephone: +44 (0) 113 3435753; fax: +44 (0) 113
3435749
Abstract
Background: It has been proposed that habitual physical activity (PA) improves appetite control; however the
evidence has never been systematically reviewed.
Objective: To examine whether appetite control (e.g. subjective appetite, appetite-related peptides, food intake)
differs according to levels of PA.
Data sources: Medline, Embase and SPORTDiscus were searched for articles published between 1996-2015
using keywords pertaining to PA, appetite, food intake and appetite-related peptides.
Study selection: Articles were included if they involved healthy non-smoking adults (18-64 years) participating
in cross-sectional studies examining appetite control in active and inactive individuals; or before and after
exercise training in previously inactive individuals.
Study appraisal and synthesis: Of 77 full-texts assessed, 28 studies (cross-sectional = 14; exercise-training = 14)
met the inclusion criteria.
Results: Appetite sensations and absolute energy intake did not differ consistently across studies. Active
individuals had a greater ability to compensate for high-energy preloads through reductions in energy intake
compared to inactive controls. When PA level was graded across cross-sectional studies (low, medium, high,
very high), a significant curvilinear effect on energy intake (z-scores) was observed.
Limitations: Methodological issues existed concerning the small number of studies, lack of objective
2
Conclusions: Habitually active individuals showed improved compensation to the energy density of foods, butno consistent differences in appetite or absolute energy intake, compared to inactive individuals. This review
supports a J-shaped relationship between PA level and energy intake. Further studies are required to confirm
these findings.
PROSPERO registration number: CRD42015019696
Key points:
Habitual physical activity and appetite control are not independent of each other; they are
inter-connected.
The relationship between physical activity and energy intake is J-shaped.
Objective assessment of all components of energy balance is necessary to improve understanding of
3
1 Introduction
The importance of physical activity in reducing morbidity and all-cause mortality [1] and in weight management
[2] has become apparent. There has been increasing interest in the relationship between physical activity and
appetite control as both play an integral part in energy balance (e.g. [3-7]). Regular physical activity and
exercise training are associated with several physiological adaptations such as improved insulin [8] and leptin
sensitivity [9, 10], blood pressure [11], blood lipids [12], substrate metabolism [13], and body composition [14],
some of which have been proposed as mechanisms involved in eating behaviour [15, 16]. Scientific studies have
tended to focus on the appetite responses to exercise rather than habitual physical activity levels per se. This
distinction is important to make, as physical activity encompasses occupational, household, transportation and
other activities in addition to structured exercise [17], and the physiological adaptations to exercise and physical
activity may differ. Few studies have specifically focused on the appetite control differences between physically
active and inactive individuals, but there is some evidence suggesting that habitual physical activity improves
appetite control by enhancing satiety signalling [18, 19].Two recent reviews have included secondary analyses
on whether the relationship between acute or long-term exercise and energy intake is influenced by physical
activity level [20, 21]. From their meta-analysis, Schubert et al. [21] found that absolute energy intake after
acute exercise was greater in active individuals compared to those less active, whereas Donnelly et al. [20]
concluded from their systematic review that increased physical activity or exercise, regardless of physical
activity level, had no consistent effect on acute or long-term energy intake. However, these reviews only
included energy and macronutrient intake as their main outcome measures. This is of importance as appetite
control involves the complex co-ordination of a range of homeostatic and non-homeostatic signals in the overall
expression of food intake [22]. Therefore, in addition to energy intake it is important to consider other
components such as appetite-related peptides, subjective appetite sensations, food choice, and hedonic reward.
It has been proposed that the regulation of the appetite control system and energy intake is improved with
increasing levels of physical activity [23]. This issue has yet to be systematically reviewed, and the potential
mechanisms behind any improvement in appetite control are unclear. The aim of this systematic review was to
examine whether physically active individuals have more sensitive control over appetite than their inactive
counterparts and if this confers them the ability to better match energy intake to energy expenditure, and identify
4
2 Methods
This systematic review follows the Preferred Reporting Items for Systematic Reviews and Meta-Analysis
(PRISMA) guidelines (Electronic Supplementary Material Appendix S1) and is registered in the PROSPERO
database (registration number CRD42015019696).
2.1 Search strategy
A search was conducted in the databases Ovid Medline, Ovid Embase and SPORTDiscus (EBSCOHost), which
included articles published between 1st January 1996 and 15th April 2015 using the strategy (physical activity
AND (appetite AND (food intake OR appetite-related peptides))). Previous systematic reviews were screened to
identify relevant subject headings and key words to include within each subject category. The specific key
words used for the search are listed in Table 1 and the full search strategy for one of the databases consulted can
be found in Electronic Supplementary Material Appendix S2. Limits were set to include articles published in
English and studies conducted in human adults aged 18-64 years. Reference lists from the resulting articles were
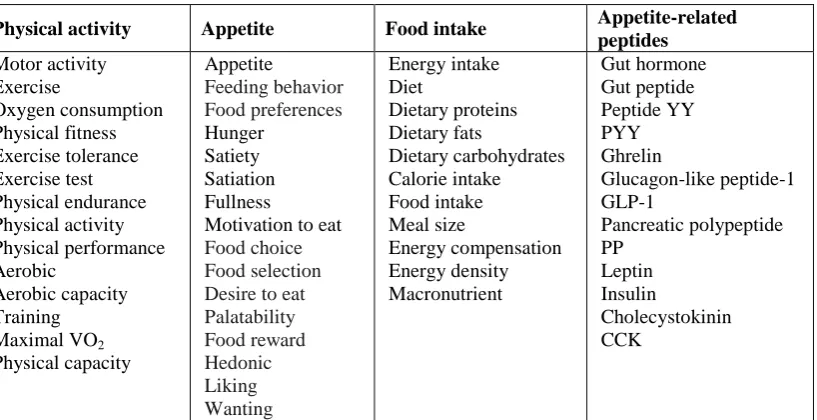
[image:5.595.76.485.448.658.2]also screened to identify any additional articles.
Table 1. Keywords included in database search strategy
Physical activity Appetite Food intake Appetite-related
peptides Motor activity Exercise Oxygen consumption Physical fitness Exercise tolerance Exercise test Physical endurance Physical activity Physical performance Aerobic Aerobic capacity Training Maximal VO2 Physical capacity Appetite Feeding behavior Food preferences Hunger Satiety Satiation Fullness
Motivation to eat Food choice Food selection Desire to eat Palatability Food reward Hedonic Liking Wanting Energy intake Diet Dietary proteins Dietary fats Dietary carbohydrates Calorie intake Food intake Meal size Energy compensation Energy density Macronutrient Gut hormone Gut peptide Peptide YY PYY Ghrelin Glucagon-like peptide-1 GLP-1 Pancreatic polypeptide PP Leptin Insulin Cholecystokinin CCK
VO2 Oxygen consumption, PYY peptide YY, GLP-1 glucagon-like peptide-1, PP pancreatic polypeptide, CCK
cholecystokinin
5
Articles were included if they involved healthy adults participating in cross-sectional studies and examined
appetite control in physically active and inactive individuals. Longitudinal studies assessing appetite control
before and after an exercise-training intervention in previously inactive individuals were also included if the
intervention was greater than four weeks (to allow sufficient time for adaptations from regular physical activity
to emerge; e.g. [11]) and did not include any concurrent dietary intervention (e.g. energy restriction,
supplementation). Articles were excluded if they involved animals, children, adolescents, athletes or older adults
(>65 years old) and participants who smoked. Abstracts and full-texts were assessed for eligibility
independently by two authors with uncertainty regarding eligibility discussed with an additional author.
2.3 Data extraction and synthesis
One author extracted the following information into a spreadsheet: authors, date of publication, sample size,
participant characteristics (age, sex, body mass index (BMI), % body fat, maximal aerobic capacity (VO2max),
physical activity details), criteria used to assess physical activity status (cross-sectional studies) or training
intervention (longitudinal studies), setting, outcome measures (energy intake, appetite ratings and
appetite-related peptides), and results. To determine any statistical relationship between habitual physical activity level
and energy intake, where data were available energy intake values were standardised (z-scores) and from the
definitions provided in the studies, physical activity levels were graded into low (<150 min/wk, <1000 kcal/wk
or physical activity level (PAL): 1.4-1.69), medium (150-419 min/wk, 1000-2500 kcal/wk or PAL: 1.7-1.99),
high (420-839 min/wk or 2500-3500 kcal/wk), or very high (>840 min/wk or >3500 kcal/wk). One-way analysis
of variance (ANOVA) was then used to test for a main effect of graded physical activity level on energy intake
score, followed by trend analyses for linear and non-linear functions. Other outcome measures are presented as a
qualitative synthesis.
2.4 Risk of bias
Risk of bias was assessed using the Cochrane Collaboration’s tool for assessing risk of bias for sequence
generation, allocation concealment, blinding of participants, personnel and outcome assessors, incomplete
outcome data, selective outcome reporting, and other sources of bias [24] (Electronic Supplementary Material
6
3 Results
Figure 1 illustrates the systematic review flow diagram. The database search yielded 2,078 articles, 1,640 of
which were eliminated based on titles and abstracts alone. The full text was retrieved from 77 articles and 28
satisfied the inclusion criteria.
Figure 1 here
Fig. 1 Systematic review flow diagram
3.1 Cross-sectional studies
7
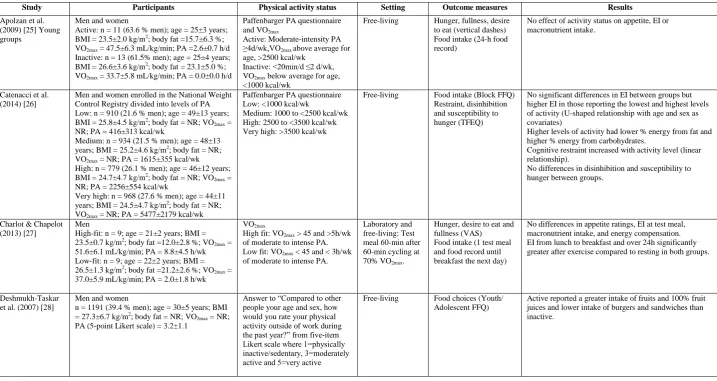
Table 2 Cross-sectional studies assessing appetite control in physically active and inactive individuals
Study Participants Physical activity status Setting Outcome measures Results
Apolzan et al. (2009) [25] Young groups
Men and women
Active: n = 11 (63.6 % men); age = 25±3 years; BMI = 23.5±2.0 kg/m2; body fat =15.7±6.3 %; VO2max = 47.5±6.3 mL/kg/min; PA =2.6±0.7 h/d Inactive: n = 13 (61.5% men); age = 25±4 years; BMI = 26.6±3.6 kg/m2; body fat = 23.1±5.0 %; VO2max = 33.7±5.8 mL/kg/min; PA = 0.0±0.0 h/d
Paffenbarger PA questionnaire and VO2max
Active: Moderate-intensity PA ≥4d/wk,VO2max above average for age, >2500 kcal/wk
Inactive: <20min/d ≤2 d/wk, VO2max below average for age, <1000 kcal/wk
Free-living Hunger, fullness, desire to eat (vertical dashes) Food intake (24-h food record)
No effect of activity status on appetite, EI or macronutrient intake.
Catenacci et al. (2014) [26]
Men and women enrolled in the National Weight Control Registry divided into levels of PA Low: n = 910 (21.6 % men); age = 49±13 years; BMI = 25.8±4.5 kg/m2; body fat = NR; VO2max = NR; PA = 416±313 kcal/wk
Medium: n = 934 (21.5 % men); age = 48±13 years; BMI = 25.2±4.6 kg/m2; body fat = NR; VO2max = NR; PA = 1615±355 kcal/wk High: n = 779 (26.1 % men); age = 46±12 years; BMI = 24.7±4.7 kg/m2; body fat = NR; VO2max = NR; PA = 2256±554 kcal/wk
Very high: n = 968 (27.6 % men); age = 44±11 years; BMI = 24.5±4.7 kg/m2; body fat = NR; VO2max = NR; PA = 5477±2179 kcal/wk
Paffenbarger PA questionnaire Low: <1000 kcal/wk
Medium: 1000 to <2500 kcal/wk High: 2500 to <3500 kcal/wk Very high: >3500 kcal/wk
Free-living Food intake (Block FFQ)
Restraint, disinhibition and susceptibility to hunger (TFEQ)
No significant differences in EI between groups but higher EI in those reporting the lowest and highest levels of activity (U-shaped relationship with age and sex as covariates)
Higher levels of activity had lower % energy from fat and higher % energy from carbohydrates.
Cognitive restraint increased with activity level (linear relationship).
No differences in disinhibition and susceptibility to hunger between groups.
Charlot & Chapelot (2013) [27]
Men
High-fit: n = 9; age = 21±2 years; BMI = 23.5±0.7 kg/m2; body fat =12.0±2.8 %; VO2max = 51.6±6.1 mL/kg/min; PA = 8.8±4.5 h/wk Low-fit: n = 9; age = 22±2 years; BMI = 26.5±1.3 kg/m2; body fat =21.2±2.6 %; VO2max = 37.0±5.9 mL/kg/min; PA = 2.0±1.8 h/wk
VO2max
High fit: VO2max > 45 and >5h/wk of moderate to intense PA. Low fit: VO2max < 45 and < 3h/wk of moderate to intense PA.
Laboratory and free-living: Test meal 60-min after 60-min cycling at 70% VO2max.
Hunger, desire to eat and fullness (VAS) Food intake (1 test meal and food record until breakfast the next day)
No differences in appetite ratings, EI at test meal, macronutrient intake, and energy compensation. EI from lunch to breakfast and over 24h significantly greater after exercise compared to resting in both groups.
Deshmukh-Taskar et al. (2007) [28]
Men and women
n = 1191 (39.4 % men); age = 30±5 years; BMI = 27.3±6.7 kg/m2; body fat = NR; VO2max = NR; PA (5-point Likert scale) = 3.2±1.1
Answer to “Compared to other people your age and sex, how would you rate your physical activity outside of work during the past year?” from five-item Likert scale where 1=physically inactive/sedentary, 3=moderately active and 5=very active
Free-living Food choices (Youth/
Adolescent FFQ)
8
Active: ≥4 (n=392)
Inactive: ≤3 (n=799) Georgiou et al.
(1996) [29]
Men
Exercisers: n = 89; age = 22±2 years; BMI = 24.8±4.1 kg/m2; body fat = NR; VO2max = NR; PA = NR
Nonexercisers: n = 51; age = 22±2 years; BMI = 25.7±5.2 kg/m2; body fat = NR; VO2max = NR; PA = NR
Women
Exercisers: n = 106; age = 21±2 years; BMI = 22.3±3.6 kg/m2; body fat = NR; VO2max = NR; PA = NR
Nonexercisers: n = 73; age = 22±2 years; BMI = 22.8±4.1 kg/m2; body fat = NR; VO2max = NR; PA = NR
Yes or no response to "Do you engage in regular, planned exercise activities in which you work up a sweat, increase your heart rate or breathe faster?"
Free-living Food choices (National Cancer Institute Health Habits and History Questionnaire FFQ) Health-related influences on food choice questionnaire Perceived change of fat intake
Female and male exercisers considered it more important to eat the most nutritious foods than nonexercisers. Female and male exercisers ate more nutrient-dense, low-fat foods than nonexercisers.
Female exercisers were more likely to rate 2% milk, macaroni and cheese, hamburger, and peanut butter as fattening compared to nonexercisers.
Female exercisers reported decreasing intake of high-fat foods (e.g. French fries, cheese and salad dressing) over the prior years.
Gregersen et al. (2011) [30]
Men
n = 80; age = 39±12 years; BMI = 25.2±2.7 kg/m2; body fat = NR; VO2max = NR; PA = NR Women
n = 98; age = 41±11 years; BMI = 24.4±3.0 kg/m2; body fat = NR; VO2max = NR; PA = NR
Self-reported PA level (Subgroup analysis)
High/moderate exercise (n =46): training hard ≥4 hr/wk Light/no exercise (n =129): light exercise <4 hr/wk
Laboratory: Standardized evening meal to 35% of individual daily energy requirement.
Hunger, fullness, satiety, PFC (VAS) pre and over 3h post-meal.
Palatability
Hard/moderate exercisers had lower mean ratings of post-prandial satiety and higher mean ratings of post-meal hunger and PFC than light/non-exercisers. (Differences became non-significant when age and sex added as covariates.)
No differences in palatability between groups.
Harrington et al. (2013) [31]
Non-obese men
n = 40; age = 27±4 years; BMI = 23.5±2.5 kg/m2; body fat = NR; VO2max = NR; PA = NR Non-obese women
n = 42; age = 27±5 years; BMI = 22.4±2.0 kg/m2; body fat = NR; VO2max = NR; PA = NR
Activity-related energy expenditure derived from the residual value of the regression between TDEE from doubly-labeled water and 24-h resting energy expenditure. Activity-related energy expenditure divided into low, middle and high tertiles.
Laboratory Food intake (test meal) Hunger, fullness, desire to eat and PFC (VAS) pre and post-test meal. SQ
Males in low tertile significantly higher fasting desire to eat, PFC and lower fullness than high tertile.
No differences in fasting appetite between groups in women.
No differences in appetite ratings after the test meal between groups in both men and women.
Males in middle tertile had a significantly lower EI than high tertile and tended to have lower EI than low tertile. Males in high tertile had a significantly lower SQ for each appetite rating compared to middle tertile.
Jago et al. (2005) [32]
Men and women
n = 1191 (39.3 % men); age = 30±5 years; BMI = 27.3±6.7 kg/m2; body fat = NR; VO2max = NR; PA (5-point Likert scale) = 3.2±1.1
Answer to “Compared to other people your age and sex, how would you rate your physical activity outside of work during the past year?” from five-item Likert scale where 1=physically inactive/sedentary, 3=moderately active and 5=very active
Group 1: n=74; Group 2: n=181; Group 3: n=544; Group 4: n=180,
Free-living Food intake (Youth/
Adolescent FFQ) Groups 3, 4, and 5 reported greater intake of dairy products than group 1. Groups 3, 4 and 5 consumed fewer servings of fried foods than group 2.
Group 5 had a greater EI than group 3 but no differences were seen with the other groups.
9
Group 5: n=212
Jokisch et al. (2012) [33]
Men
Active: n = 10; age = 21±2 years; BMI = 23.9±1.5 kg/m2; body fat = 12.6±2.8 %; VO2max = NR; PA = 438±152 min/wk
Inactive: n = 10; age = 21±2 years; BMI = 23.0±1.9 kg/m2; body fat = 15.0±2.3 %; VO2max = NR; PA = 32±43 min/wk
Seven-day PA recall x 2 Active: ≥ 150min/wk moderate- to vigorous-intensity PA Inactive: ≤ 60min/wk
Laboratory: Test meal 60-min after 45-min cycling at 65-75% HRmax or rest.
Hunger and liking (VAS) Food intake (1 test meal and food record for remainder of the day)
Inactive had greater EI at ad libitum meal after rest than exercise.
Both active and inactive had greater EI during remainder of the day after exercise compared to rest. Tendency for inactive to have greater EI than active.
No significant differences in macronutrient intake at test meal but active consumed greater % energy from protein vs. inactive during remainder of day.
Difference in energy compensation between groups (positive in active and negative in inactive) at test meal, but no differences in energy compensation for remainder of the day.
Long et al. (2002) [19]
Men
High exercisers: n = 7; age = 22±3 years; BMI = 22.5±1.5 kg/m2; body fat = NR; VO2max = NR; PA = NR
Moderate exercisers: n = 7; age = 27±7 years; BMI = 24.1±3.6 kg/m2; body fat = NR; VO2max = NR; PA = NR
Nonexercisers: n = 9; age = 22±2 years; BMI = 24.1±3.6 kg/m2; body fat = NR; VO2max = NR; PA = NR
Seven-day PA recall x 2 High exercisers: ≥4 exercise sessions/wk
Moderate exercisers: 2-3 exercise sessions/wk
Nonexercisers: ≤1 exercise session/wk
Exercise session: ≥40 min moderate to high intensity PA
Laboratory: LE preload and HE preload followed by test meal.
Hunger and satiety (VAS)
Food intake (1 test meal)
EI in exercisers (groups combined) significantly less after HE vs. LE preload.
EI after HE preload significantly lower in exercisers vs. nonexercisers.
Energy compensation more accurate in active vs. inactive. Hunger before preload significantly higher in
nonexercisers under both HE and LE preloads but no other differences in appetite ratings.
Lund et al. (2013) [34]
Men
Trained: n = 10; age = 26±3 years; BMI = 22±3 kg/m2; body fat = 12±3 %; VO2max = 67±6 mL/kg/min; PA = NR
Untrained: n = 10; age = 25±3 years; BMI = 22±3 kg/m2; body fat = 21±3 %; VO2max = 42±6 mL/kg/min; PA = NR
VO2max
Trained: Aerobic endurance exercise >3d/wk over several years and VO2max > 60 (Runners, cyclists or triathletes)
Untrained: No exercise during last 6 months and VO2max < 50
Laboratory: Liquid meal followed by test meal 3 h later
Hunger, satiety, fullness and PFC (VAS) Meal size (test meal) GLP-1, insulin, acylated ghrelin, PYY, PP
GLP-1 and acylated ghrelin higher at baseline in trained. GLP-1 higher and insulin lower following liquid meal in trained.
No group differences in PYY and PP at baseline and in response to liquid meal.
No group differences in appetite ratings.
Tendency for greater meal size (grams) in trained vs. untrained, significant after removal of outlier in untrained group.
Rocha et al. (2013) [35]
Men
Active: n = 15; age = 23±4 years; BMI = 22.6±2.0 kg/m2; body fat = 14.3±3.4 %; VO2max = 44.6±5.0 mL/kg/min; PA level (TDEE/BMR) = 1.80±0.19
Inactive: n = 15; age = 24±3 years; BMI = 25.1±2.4 kg/m2; body fat = 22.2±3.8 %; VO2max = 35.5±5.2 mL/kg/min; PA level (TDEE/BMR) = 1.54±0.19
Modified Godin leisure-time exercise questionnaire PA monitor
Active: Regular exercisers and >150 min/wk of moderate-intensity PA and PA level 1.70-1.99
Inactive: Did not engage in regular exercise and <150 min/wk of moderate-intensity PA and PA level 1.4-1.69
Laboratory and free-living: Test meal following 60-min cycling at 50% VO2max or rest.
Hunger (VAS) Food intake (1 test meal and food record for remainder of the day and subsequent 3 days)
No effects on hunger and EI at test meal.
Active had greater EI during exercise day than rest day. Inactive increased EI on 3rd day after exercise compared to rest.
10
Rocha et al. (2015) [36]
Women taking oral contraceptives Active: n = 10; age = 23±4 years; BMI = 21.9±1.3 kg/m2; body fat = 22.5±3.7 %; VO2max = 36.8±3.1 mL/kg/min; PA level (TDEE/BMR) = 1.79±0.13
Inactive: n = 10; age = 22±3 years; BMI = 21.6±2.0 kg/m2; body fat = 26.7±3.6 %; VO2max = 29.9±4.1 mL/kg/min; PA level (TDEE/BMR) = 1.56±0.15
Modified Godin leisure-time exercise questionnaire PA monitor
Active: Regular exercisers and >150 min/wk of moderate-intensity PA and PA level 1.70-1.99
Inactive: Not regular exercisers and <150 min/wk of moderate-intensity PA and PA level 1.4-1.69
Laboratory and free-living: Test meal following 60-min cycling at 50% VO2max or rest.
Hunger (VAS) Food intake (1 test meal and food record for remainder of the day and subsequent 3 days)
No group differences in hunger, EI at test meal or macronutrient intake.
Inactive had greater EI over the four days than active. Inactive had lower daily EI the day following exercise compared to rest.
No energy compensation observed.
Van Walleghen et al. (2007) [37] Young groups
Men and women
Active: n = 15 (45.4 % men); age = 23±4 years; BMI = 23.1±2.7 kg/m2; body fat = 18.2±8.5 %; VO2max = 55.6±10.5 mL/kg/min; PA = 575±406 min/wk
Inactive: n = 14 (50 % men); age = 26±4 years; BMI = 23.5±3.0 kg/m2; body fat = 27.2±5.6 %; VO2max = 37.9±7.1 mL/kg/min; PA = 16±37 min/wk
Self-reported time spent doing moderate to vigorous PA Active: ≥150min/wk moderate and/or vigorous activity for ≥ 2 yr Inactive: NR
Laboratory and free-living: Preload or no preload followed by test meal.
Hunger and fullness (VAS)
Food intake (1 test meal and food record for remainder of the day) Fasting insulin and insulin sensitivity
Active had greater habitual energy intake, lower % energy from fat and greater % energy from carbohydrate than inactive.
No group differences in appetite or EI at test meal. Active had greater EI than inactive during the remainder of the day in no preload condition.
No group differences for energy compensation at test meal, but compensation over the entire day was
significantly more accurate in active vs. inactive subjects.
BMI body mass index, BMR basal metabolic rate, EI energy intake, FFQ food frequency questionnaire GLP-1 glucagon-like peptide-1, HE high-energy, HRmax maximal heart
rate. LE low-energy, NR not reported, PA physical activity, PFC prospective food consumption, PP pancreatic polypeptide, PYY peptide YY, SQ satiety quotient, TFEQ
11
3.1.1 Study characteristics: Physical activity definitionsThe median (range) sample size of the included studies was 15 (7-968) for the active group and 14
(9-910) for the inactive group. Men and women were included in eight studies, of which the median
percentage of men was 42.2 (21.5-63.6) % in the active group and 50 (21.6-61.6) % in the inactive
group [25, 26, 28-32, 37]. Five studies included only men [19, 27, 33-35] and one study included only
women [36].
Physical activity status was determined by self-report (physical activity questionnaire, physical
activity level question or physical activity recall) in 11 studies [19, 26, 28-30, 32, 33, 37], a VO2max test
in three studies [25, 27, 34], or from total daily energy expenditure (TDEE) and resting energy
expenditure or basal metabolic rate (BMR) in three studies [31, 35, 36]. Only three studies used a
combination of self-reported and objectively measured physical activity status [25, 35, 36].
The active groups were defined as participating in moderate to vigorous physical activity for at
least: 150 min/wk [33, 35-37], 4 h/wk [30], 5 h/wk with a VO2max greater than 45mL/kg/min [27], 3
d/wk with a VO2max greater than 60mL/kg/min [34], 4 d/wk and >2500kcal/wk with a VO2max above
average for age [25], or 1000kcal/wk [26]. A TDEE/BMR value between 1.70-1.99 was utilised in two
studies [35, 36]. Moderate exercisers participated in 2 to 3 sessions/wk of at least 40 min of moderate
to high intensity physical activity [19] or expended between 1000-2500 kcal/wk [26]. High exercisers
participated in 4 or more structured exercise sessions/wk of at least 40 minutes of moderate to high
intensity physical activity [19] or expended 2500-3500 kcal/wk [26], whereas very high exercisers
expended greater than 3500 kcal/wk [26].
The inactive groups were defined as no exercise over the previous 6 months and VO2max less
than 50 mL/kg/min [34] or less than: 1 session/wk of moderate- to high-intensity physical activity [19],
20 min/d and 2 d/wk [25], 60 min/wk [33], 1000 kcal/wk [26], 150 min/wk of moderate-intensity
physical activity [35, 36], 3 h/wk of moderate- to high-intensity physical activity with a VO2max less
than 45 mL/kg/min [27], or 4 h/wk [30]. Two studies used a TDEE/BMR value between 1.4-1.69 [35,
36].
Based on the physical activity definitions above, for the purposes of statistical treatment, we
distinguished physical activity levels as low (<150 min/wk, <1000 kcal/wk or PAL: 1.4-1.69), medium
(150-419 min/wk, 1000-2500 kcal/wk or PAL: 1.7-1.99), high (420-839 min/wk or 2500-3500
12
3.1.2 Study characteristics: Appetite-related measuresFive studies evaluated appetite measures in a laboratory [19, 30, 31, 33, 34], five studies in free-living
conditions [25, 26, 28, 29, 32], and four studies combined laboratory and free-living measures [27,
35-37]. Four studies included exercise (45-60 min cycling at 50-75 % VO2max or HRmax) during the
laboratory session [27, 33, 35, 36]. Ten studies included fasting and/or daily (area under the curve)
subjective appetite ratings, all of which included hunger [19, 25, 27, 30, 31, 33-37]. Other appetite
ratings assessed were fullness [25, 27, 30, 31, 33, 34, 37], prospective food consumption (PFC) [30, 31,
34], desire to eat [25, 27, 31], satiety [19, 30, 34], liking [33] and palatability [30]. One study reported
restraint, disinhibition and susceptibility to hunger [26]. Eleven studies assessed energy intake, either
via a food frequency questionnaire (FFQ) [26, 32], food record [25], laboratory-based test meals [19,
31, 34], or a combination of laboratory-based test meals and food records [27, 33, 35-37]. Six studies
reported energy compensation following either a preload [19, 37] or a single bout of exercise [27, 33,
35, 36]. Eight studies reported macronutrient intake [25-27, 32, 33, 35-37]. Three studies assessed food
choices via FFQ [28, 29, 32]. Two studies included the assessment of appetite-related peptides [34, 37].
3.1.3 Participant characteristics
The median (range) age was 23 (21-48) years for the active groups and 22 (21-49) years for the
inactive groups.
In the 10 studies that reported BMI of the active and inactive groups separately, the median
(range) was 23.5 (21.9-25.2) kg/m2 for the active group and 24.1 (21.6-26.6) kg/m2 for the inactive
group [19, 25-27, 29, 33-37]. In three studies, the inactive group had a significantly greater BMI than
the active group [25, 27, 35]. In those that reported BMI of the groups combined, the median (range)
was 24.8 (22.4-27.3) kg/m2 [28, 30-32].
In the seven studies that reported percent body fat, the median (range) was 14.3 (12.0-22.5) %
for the active group and 22.2 (15.0-27.2) % for the inactive group [25, 27, 33-37]. In all studies, the
inactive group had a significantly greater percent body fat than the active group.
In the six studies that reported VO2max, the median (range) was 49.6 (36.8-67.0) mL/kg/min for
the active group and 36.3 (29.9-42.0) mL/kg/min for the inactive group [25, 27, 34-37]. In all studies,
13
3.1.4 Study results: Appetite ratingsOf the 10 studies that measured appetite ratings, three found differences between the physically active
and inactive groups. Harrington et al. [31] reported greater fasting appetite and lower satiety quotient
(SQ; [pre-meal appetite rating-post meal appetite rating]/energy intake) for hunger, fullness, desire to
eat and prospective food consumption (PFC) in men in the high activity tertile compared to the
moderate activity tertile, whereas Long et al. [19] reported greater fasting appetite in the inactive
group. Gregersen et al. [30] found greater post-prandial appetite in the active group, however
differences became non-significant when age and sex were added as covariates.
3.1.5 Study results: Energy and macronutrient intake
Ten of eleven studies found differences in energy intake between active and inactive individuals. Two
studies found greater energy intake (habitual energy intake [37] or with a test meal [34]) in the active
compared to the inactive group, whereas one study observed greater energy intake in inactive women
over four days than active women [36]. Furthermore, two studies observed a non-linear relationship in
energy intake, whereby energy intake was highest in the groups with the lowest and highest levels of
physical activity [26, 31], while Jago et al. [32] only observed a greater energy intake in the very active
group compared to the moderately active group. In studies assessing energy intake following a preload,
Long et al. [19] found that energy intake at an ad libitum test meal following a high-energy preload
was significantly lower than following the low-energy preload in regular exercisers. The same study
showed that compared to nonexercisers, energy intake following the high-energy preload was
significantly lower in exercisers. Moreover, Van Walleghen et al. [37] found that the active group
consumed more throughout the day following the no preload condition than the inactive group, leading
to significantly more accurate short-term energy compensation. Of note, however, there were no
differences in energy compensation between groups at the test meal after the preload [37]. In studies
measuring energy intake after exercise, two of three studies in men observed energy compensation in
the active group, where energy intake following an exercise session was greater compared to rest at test
meal [33] or throughout the day (but not at the test meal in this study) [35]. One of these studies
observed negative energy compensation in the inactive group, where energy intake was lower
14
Of the above studies that observed differences between groups, only four were based on objectively
measured (test meal) energy intake [19, 31, 33, 34].
As for macronutrient intake, compared to the inactive group, two studies found that the active
group consumed a greater percent energy from carbohydrates [26, 37], three found lower percent
energy from fat [26, 32, 37], while one study found a greater percent energy from protein [33]. In terms
of food choices, active individuals reported a greater intake of nutrient-dense, low-fat foods [29], fruits
and 100% fruit juices [28], and dairy products [32], and a lower intake of burgers and sandwiches [28]
and fried foods [32] than inactive.
3.1.6 Study results: Standardized energy intake
To further examine the relationship between energy intake and physical activity level, the available
energy intake data from all cross-sectional studies [25-27, 31-37] were extracted and transformed into
standardized scores then plotted according to our physical activity levels (low, medium, high, very
high) as described in section 3.1.1. In the studies that included a preload or an exercise bout [27, 33,
35, 36], energy intake was taken from the control condition. Of these ten studies, eight were based on
self-reported daily energy intake [25-27, 32, 33, 35-37] while two were based on energy intake at a
test meal [31, 34]. The pattern of means revealed a J-shaped curve for energy intake as habitual
physical activity level increased (Figure 2). One-way ANOVA confirmed a main effect of graded
physical activity level on energy intake score [F(3,21)=3.57, p=0.03]. Post hoc trend analyses revealed
significant effects for linear [F=5.79, p=0.03] and curvilinear (quadratic) [F=8.10, p=0.01] functions.
Figure 2 here
Fig. 2 Standardised energy intake by physical activity level from the 10 cross-sectional studies
reporting energy intake (n=25 data points). Trend analysis confirmed significant linear (p<0.05) and
quadratic (p<0.01) relationship between graded physical activity level and energy intake scores. Black
15
3.1.7 Study results: Appetite-related peptidesVan Walleghen et al. [37] found greater insulin sensitivity in the active group. Lund et al. [34] found
that in active individuals, glucagon-like peptide-1 (GLP-1) and acylated ghrelin were higher at baseline
(insulin tended to be lower), and following a liquid meal, GLP-1 was higher and insulin was lower in
active. No group differences were found for peptide YY (PYY) and pancreatic polypeptide.
3.2 Exercise-training interventions
16
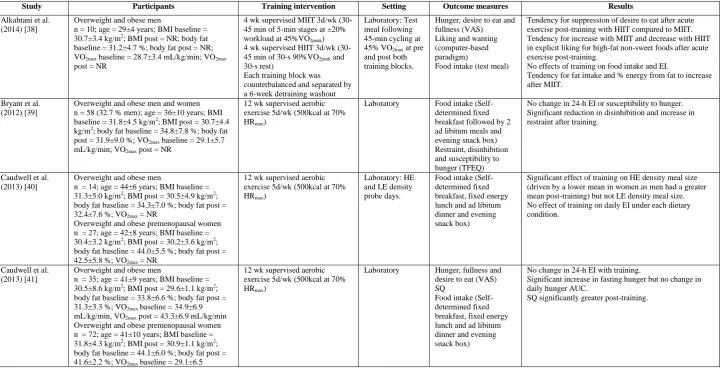
Table 3 Studies investigating the effect of exercise training on appetite control in previously inactive individuals
Study Participants Training intervention Setting Outcome measures Results
Alkahtani et al. (2014) [38]
Overweight and obese men
n = 10; age = 29±4 years; BMI baseline = 30.7±3.4 kg/m2; BMI post = NR; body fat baseline = 31.2±4.7 %; body fat post = NR; VO2max baseline = 28.7±3.4 mL/kg/min; VO2max post = NR
4 wk supervised MIIT 3d/wk (30-45 min of 5-min stages at ±20% workload at 45%VO2peak) 4 wk supervised HIIT 3d/wk (30-45 min of 30-s 90%VO2peak and 30-s rest)
Each training block was counterbalanced and separated by a 6-week detraining washout
Laboratory: Test meal following 45-min cycling at 45% VO2max at pre and post both training blocks.
Hunger, desire to eat and fullness (VAS) Liking and wanting (computer-based paradigm)
Food intake (test meal)
Tendency for suppression of desire to eat after acute exercise post-training with HIIT compared to MIIT. Tendency for increase with MIIT and decrease with HIIT in explicit liking for high-fat non-sweet foods after acute exercise post-training.
No effects of training on food intake and EI.
Tendency for fat intake and % energy from fat to increase after MIIT.
Bryant et al. (2012) [39]
Overweight and obese men and women n = 58 (32.7 % men); age = 36±10 years; BMI baseline = 31.8±4.5 kg/m2; BMI post = 30.7±4.4 kg/m2; body fat baseline = 34.8±7.8 %; body fat post = 31.9±9.0 %; VO2max baseline = 29.1±5.7 mL/kg/min; VO2max post = NR
12 wk supervised aerobic exercise 5d/wk (500kcal at 70% HRmax)
Laboratory Food intake
(Self-determined fixed breakfast followed by 2 ad libitum meals and evening snack box) Restraint, disinhibition and susceptibility to hunger (TFEQ)
No change in 24-h EI or susceptibility to hunger. Significant reduction in disinhibition and increase in restraint after training.
Caudwell et al. (2013) [40]
Overweight and obese men
n = 14; age = 44±6 years; BMI baseline = 31.3±5.0 kg/m2; BMI post = 30.5±4.9 kg/m2; body fat baseline = 34.3±7.0 %; body fat post = 32.4±7.6 %; VO2max = NR
Overweight and obese premenopausal women n = 27; age = 42±8 years; BMI baseline = 30.4±3.2 kg/m2; BMI post = 30.2±3.6 kg/m2; body fat baseline = 44.0±5.5 %; body fat post = 42.5±5.8 %; VO2max = NR
12 wk supervised aerobic exercise 5d/wk (500kcal at 70% HRmax)
Laboratory: HE and LE density probe days.
Food intake (Self-determined fixed breakfast, fixed energy lunch and ad libitum dinner and evening snack box)
Significant effect of training on HE density meal size (driven by a lower mean in women as men had a greater mean post-training) but not LE density meal size. No effect of training on daily EI under each dietary condition.
Caudwell et al. (2013) [41]
Overweight and obese men
n = 35; age = 41±9 years; BMI baseline = 30.5±8.6 kg/m2; BMI post = 29.6±1.1 kg/m2; body fat baseline = 33.8±6.6 %; body fat post = 31.3±3.3 %; VO2max baseline = 34.9±6.9 mL/kg/min, VO2max post = 43.3±6.9 mL/kg/min Overweight and obese premenopausal women n = 72; age = 41±10 years; BMI baseline = 31.8±4.3 kg/m2; BMI post = 30.9±1.1 kg/m2; body fat baseline = 44.1±6.0 %; body fat post = 41.6±2.2 %; VO2max baseline = 29.1±6.5
12 wk supervised aerobic exercise 5d/wk (500kcal at 70% HRmax)
Laboratory Hunger, fullness and
desire to eat (VAS) SQ
Food intake (Self-determined fixed breakfast, fixed energy lunch and ad libitum dinner and evening snack box)
No change in 24-h EI with training.
Significant increase in fasting hunger but no change in daily hunger AUC.
17
mL/kg/min; VO2max post = 35.1±5.5 mL/kg/min
Cornier et al. (2012) [42]
Overweight and obese men and women n = 12 (41.6 % men); age = 38±10 years; BMI baseline = 33.3±4.3 kg/m2; BMI post = NR; body fat baseline = 36.5±1.9 %; body fat post = 34.4±2.0 %; VO2max = NR
6 months supervised treadmill walking 5d/wk (building up to 500kcal/d at 75% VO2max)
Laboratory and free-living: Test meal breakfast (30% estimated daily energy requirements) Leptin Restraint and disinhibition (TFEQ) Power of Food Scale Craving and Mood Questionnaire
Food Craving Inventory Hunger, satiety and PFC (VAS)
Food intake (3-day food record)
Significant reduction in fasting leptin post-training. No change in dietary restraint or disinhibition, food cravings, Power of Food Scale, food desire and appeal, or post-prandial appetite ratings.
Self-reported EI lower after training compared to baseline but no change in macronutrient intake.
Guelfi et al. (2013) [43] Exercise groups
Overweight and obese men (age = 49±7 years) Aerobic training: n = 12; BMI baseline = 31.7±3.5 kg/m2; BMI post = 31.1±3.3 kg/m2; body fat = NR; VO2max baseline = 2.25±0.51 L/min @ 80% HRmax; VO2max post = 2.82±0.60 L/min @ 80% HRmax
Resistance training: n = 13; BMI baseline = 30.3±3.5 kg/m2; BMI post = 30.3±3.7 kg/m2; body fat = NR; VO2max baseline = 1.94±0.39 L/min @ 80% HRmax; VO2max post = 2.17±0.54 L/min @ 80% HRmax
12 wk supervised (3d/wk) aerobic exercise (40-60 min at 70-80% HRmax) or resistance exercise (weight training matched for duration and intensity; 3-4 sets 8-10 repetitions of 9 exercises at 75-85% 1RM)
Laboratory: 2-h, 75-g OGTT
Hunger and fullness (VAS)
Active ghrelin, leptin, insulin, insulin sensitivity, PP and PYY
Significant increase in fasting and postprandial fullness following aerobic training only.
No change in fasting or postprandial hunger with training. Fasting and postprandial leptin were significantly lower after training.
Postprandial insulin was significantly lower after aerobic training only.
No change in fasting insulin, and fasting and postprandial AG, PP and PYY post-training.
Improvement in insulin sensitivity in both groups post-training.
Jakicic et al. (2011) [44] Exercise groups
Overweight women
Moderate-dose: n = 76; age = 44±8 years; BMI baseline = 27.2±1.8 kg/m2; BMI post = 26.9±2.1 kg/m2; body fat baseline = 33.5±4.1 %; body fat post = 33.3±4.8 %; VO2max = NR
High-dose: n = 88; age = 46±8 years; BMI baseline = 27.0±1.6 kg/m2; BMI post = 26.7±2.4 kg/m2; body fat baseline = 33.0±4.1 %; body fat post = 32.3±5.3 %; VO2max = NR
18 months unsupervised moderate-dose (150min/wk), high-dose (300min/wk) ~5d/wk bouts ≥10min moderate to vigorous intensity (55-85% HRmax)
Free-living Food intake (FFQ)
Eating Behaviour Inventory
No group by time interaction on EI and macronutrient intake.
Eating behaviour score improved post-intervention but no differences between groups.
King et al. (2008) [45]
Overweight and obese men and women Compensators: n = 18 (23.5 % men); age = 38±9 years; BMI baseline = 30.7±2.9 kg/m2; BMI post = NR; body fat baseline = 32.7±8.0 %; body fat post = NR; VO2max baseline = 28.8±5.7 mL/kg/min; VO2max post = NR
Noncompensators: n = 17 (33.3 % men); age = 40±13 years; BMI baseline = 33.1±4.7 kg/m2; BMI post = NR; body fat baseline = 37.2±7.9 %; body fat post = NR; VO2max baseline = 28.4±5.8 mL/kg/min; VO2max post = NR
12 wk supervised aerobic exercise 5d/wk (500kcal at 70% HRmax)
Laboratory Hunger, fullness, PFC
and desire to eat (VAS) Food intake (Self-determined fixed breakfast followed by 2 ad libitum meals and an evening snack box)
No significant changes in 24-h EI in pooled data with training, however compensators increased EI and % energy from fat and non-compensators decreased EI from baseline to post-intervention.
18
King et al. (2009) [18]
Overweight and obese men and women divided into responders (n =32) and non-responders (n =26) to exercise-induced weight loss n = 58 (32.7 % men); age = 40±10 years; BMI baseline = 31.8±4.5 kg/m2; BMI post = NR; body fat = NR; VO2max baseline = 29.1±5.7
mL/kg/min; VO2max post = NR
12 wk supervised aerobic exercise 5d/wk (500kcal at 70% HRmax)
Laboratory: Self-determined fixed breakfast
Hunger, fullness, PFC and desire to eat (VAS) SQ
Nonresponders and responders had significantly greater fasting hunger but also had a greater SQ post-training Only nonresponders increased daily motivation to eat (greater hunger, desire to eat and lower fullness) post-training.
Martins et al. (2007) [46]
Men and women
n = 25 (44 % men); age = 30±12 years; BMI baseline = 22.7±2.3 kg/m2; BMI post = 22.8±2.2 kg/m2; body fat baseline = 23.6±7.8 %; body fat post = 23.0±7.5 %; VO2max baseline = 31.1±4.8 mL/kg/min; VO2max post = 34.3±7.4 mL/kg/min
6 wk unsupervised aerobic exercise ≥4d/wk, 30-45min (continuously or bouts ≥10min each) at 65-75% HRmax
Laboratory and free-living: LE preload and HE preload
Hunger, fullness, palatability (VAS) Food intake (1 test meal and food record until breakfast next morning) Fasting insulin and insulin sensitivity
Test meal size and cumulative 24-h EI significantly lower following HE preload vs. LE preload post-training. No improvement in energy compensation at test meal but tendency for improved compensation over 24h. Greater % energy from protein at test meal after training. No change in fasting insulin and insulin sensitivity. No change in appetite ratings.
Martins et al. (2010) [47]
Overweight and obese men and women n =15 (53.3 % men); age = 37±8 years; BMI baseline = 31.3±2.3 kg/m2; BMI post = 30.1±2.3 kg/m2; body fat baseline = 35.3±5.6 %; body fat post = 33.5±5.9 %; VO2max baseline = 32.9±6.6 mL/kg/min; VO2max post = 37.7±5.9 mL/kg/min
12 wk supervised aerobic exercise 5d/wk (500kcal at 75% HRmax)
Laboratory: Standardized breakfast
Hunger, fullness, PFC and desire to eat (VAS) AG, TG, insulin, insulin sensitivity, GLP-1, PYY over 3h post-breakfast.
Significant reduction in fasting and postprandial insulin post-training.
Improvement in insulin sensitivity post-training. Increase in fasting AG after training but no change in postprandial AG.
No significant training effect on TG, GLP-1 and PYY, but tendency for greater GLP-1 AUC in the late postprandial period after training.
Significant increase in fasting hunger, desire to eat and PFC, and decrease in fullness post-training.
Greater postprandial hunger and desire to eat post-training.
Martins et al. (2013) [48]
Overweight and obese men and women n =15 (53.3 % men); age = 37±8 years; BMI baseline = 31.3±2.3 kg/m2; BMI post = 30.1±2.3 kg/m2; body fat baseline = 35.3±5.6 %; body fat post = 33.5±5.9 %; VO2max baseline = 32.9±6.6 mL/kg/min; VO2max post = 37.7±5.9 mL/kg/min
12 wk supervised aerobic exercise 5d/wk (500kcal at 75% HRmax)
Laboratory and free-living: 1) Standardized breakfast 2) LE preload 3) HE preload
Hunger, fullness, PFC and desire to eat (VAS) Food intake (1 test meal after preload and food record for remainder of the day)
CCK and leptin over 3h post-breakfast
Significant reduction in fasting and postprandial leptin post-training but no change in CCK.
No change in test meal EI, but cumulative EI after HE preload significantly lower than LE preload post-training, whereas it was greater than LE at baseline.
Greater accuracy in energy compensation post-training. No change in macronutrient intake.
No effect of training on appetite ratings after the preloads. Rosenkilde et al.
(2013) [49] Exercise groups
Overweight men
Moderate-dose group: n = 18; age = 30±7 years; BMI baseline = 28.6±1.8 kg/m2; BMI post = 27.5±2.0 kg/m2; body fat = NR; VO2max baseline = 34.6±24.1 mL/kg/min; VO2max post = 42.3±4.5 mL/kg/min
High-dose group: n = 18; age = 28±5 years; BMI baseline = 27.6±1.4 kg/m2; BMI post = 26.9±1.2 kg/m2; body fat = NR; VO2max baseline = 36.2±5.3 mL/kg/min; VO2max post = 43.1±6.6
12 wk unsupervised daily endurance exercise expending 300kcal/day (moderate-dose) or 600kcal/day (high-dose) at >50%VO2max
Laboratory: 1) Standardized breakfast 2) Exercise test (1h ~60% VO2max)
Hunger, satiety, fullness, PFC, palatability and liking (VAS) Food intake (lunch test meal after breakfast) Restraint, disinhibition and susceptibility to hunger (TFEQ) Insulin, PYY3-36, ghrelin post-breakfast
Fasting and postprandial AUC for insulin significantly lower after both exercise interventions.
No training effect on PYY3-36 or ghrelin.
Fasting and postprandrial fullness increased in the high-dose group post-intervention.
19
mL/kg/min
Shaw et al. (2010) [50] Exercise group
Men
n = 13; age = 28±5 years; BMI = NR; body fat baseline = 26.8±1.5 %; body fat post = 23.3±6.3 %; VO2max = NR
8 wk supervised resistance exercise 3d/wk (3 sets 15 repetitions of 9 exercises)
Free-living Food intake (3-day food record)
No change in EI and macronutrient intake with training.
AG acylated ghrelin, AUC area under the curve, BMI body mass index, CCK cholecystokinin, EI energy intake, FFQ food frequency questionnaire, HE high-energy, HIIT
high-intensity interval training, HRmax maximal heart rate, LE low-energy, MIIT moderate-intensity interval training, NR not reported, OGTT oral glucose tolerance test, PFC
prospective food consumption, PP pancreatic polypeptide, PYY peptide YY, PYY3-36peptide YY (3-36), RM repetition maximum, SQ satiety quotient, TFEQ Three Factor
20
3.2.1 Study characteristics: Exercise interventionThe median (range) duration of the interventions was 12 (4-72) weeks of exercise 5 (3-7) d/wk.
Exercise duration was prescribed in minutes or energy expenditure (kcal), at intensities in %VO2max or
% heart rate maximum (HRmax). The median exercise prescription was 43.8 (30-60) min or 500
(300-600) kcal per session at 68.5 (45-90) % VO2max or 70 (70-75) % HRmax. Eleven training interventions
involved aerobic exercise [18, 39-43, 45-49], two interventions involved resistance exercise [43, 50]
and one intervention compared moderate intensity interval exercise and high intensity interval exercise
in a crossover design [38]. One study did not specify the exercise modality [44]. In 11 of the 14
interventions the exercise was supervised [18, 39-43, 45, 47, 48]. Nine studies collected
appetite-related measures in a laboratory [18, 38-41, 43, 45, 47, 49], two studies in free-living conditions [44,
50], and three studies in a combination of laboratory and free-living conditions [42, 46, 48].
3.2.2 Study characteristics: Appetite-related measures
Ten studies included fasting and/or daily (area under the curve) appetite ratings, all of which included
hunger [18, 38, 40, 42, 43, 45-49]. Fullness [18, 38, 41, 43, 45-49], PFC [18, 42, 45, 47-49], desire to
eat [18, 38, 41, 45, 47, 48], satiety [42, 49], liking and palatability [46, 49] were also assessed. Three
studies measured restraint, disinhibition and susceptibility to hunger [39, 42, 49], one study included
the Power of Food Scale, Craving and Mood Questionnaire and Food Craving Inventory [42], one
study included the Eating Behaviour Inventory [44] and one study assessed liking and wanting for
foods varying in fat and sweetness [38]. Eleven studies assessed energy intake, either via a FFQ [44],
food record [42, 50], test meals [38-41, 45, 49], or a combination of test meals and food records [46,
48]. Two studies measured energy intake following high- and low-energy preloads [46, 48] and one at
high- and low-energy density meals [40]. Seven studies reported macronutrient intake [38, 42, 44-46,
48, 50]. Six studies assessed appetite-related peptides in the fasting state [42, 43, 46-49] and three in
response to food ingestion [43, 47, 48].
3.2.3 Participant characteristics
The median (range) age was 38 (28-49) years.The median (range) sample size of the included studies
21
men was 33.7 (23.5-53.3) % [18, 39-42, 45-48]. Four studies only included men [38, 43, 49, 50] and
one study only included women [44].
Nine studies reported BMI before and after the intervention [39-41, 43, 44, 46-49], the median
(range) was 30.5 (22.7-31.8) kg/m2 at baseline and 30.1 (22.8-31.1) kg/m2 post-intervention. Seven of
these reported a significantly lower BMI after the exercise intervention [39, 41, 43, 44, 47-49]. In the
four studies that only reported baseline BMI [18, 38, 42, 45], the median (range) was 31.8 (30.7-33.3)
kg/m2.
Eight studies reported percent body fat before and after the intervention, the median (range) was
34.3 (23.6-44.1) % at baseline and 32.4 (23.0-42.5) % post-intervention [39-41, 44, 46-48, 50]. Seven
of these reported a significantly lower percent body fat after the intervention [39-41, 44, 47, 48, 50]. In
the three studies that only reported baseline percent body fat, the median (range) was 34.6 (31.2-37.2)
% [38, 42, 45].
In the five studies that reported VO2max before and after the intervention, the median (range) was
32.9 (29.1-36.2) mL/kg/min at baseline and 37.7 (34.3-43.3) mL/kg/min post-intervention [41, 46-49].
In all studies, the increase in VO2max with training was significant. In the four studies that only reported
baseline VO2max, the median (range) was 28.8 (28.4-29.1) mL/kg/min [18, 38, 39, 45].
3.2.4 Study results: Appetite ratings
Exercise training led to differences in appetite ratings in five of 10 studies. Three studies found an
increase in fasting hunger [18, 41, 47], desire to eat and PFC [47], and a decrease in fullness [47].
However, two studies found that fasting fullness increased following aerobic [43] and high-dose
aerobic (600kcal/d) [49] exercise training. King et al. [18] reported a greater daily hunger, desire to eat
and lower fullness post-training in a subsample of non-responders to exercise-induced weight loss (i.e.
individuals with changes in body composition below that expected based on the total exercise-induced
energy expenditure). In response to a standardized breakfast, Martins et al. [47] found an increase in
hunger and desire to eat following exercise training, whereas Guelfi et al. [43] found an increase in
fullness after an oral glucose tolerance test following aerobic training.
The two studies that included SQ ([pre-meal hunger – post-meal hunger]/energy intake) found
increases post-training [18, 41]. Only one of three studies found a reduction in disinhibition and an
22
3.2.5 Study results: Energy and macronutrient intakeFive of eleven studies found differences in energy intake after the exercise-training interventions. Daily
energy intake was lower post-training in one study [42], while it increased in a subsample of
compensators in another study [45]. As for high-energy test meal challenges, Caudwell et al. [40]
showed a reduction in meal size containing high energy density foods, and two studies demonstrated
that energy intake was lower throughout the day after a high-energy preload compared to a low-energy
preload [46, 48].
Two studies showed an increase in percent energy from fat in subsample of compensators
(individuals whose weight loss after exercise-training was less than predicted based on the total
exercise-induced energy expenditure) [45] or after moderate-intensity interval training [38]. Training
led to an increase in percent energy from protein in another study [46].
3.2.6 Study results: Appetite-related peptides
Of the studies that assessed fasting peptides, five found differences following exercise training, where
leptin [42, 43, 48] and insulin decreased [47, 49], and ghrelin increased [47]. Insulin sensitivity
improved after training in two of three studies [43, 47]. Of note, the study that found no improvement
in insulin sensitivity was half the duration of the two others (6 vs. 12 weeks) [46]. All three studies that
assessed the peptide response to food ingestion found training effects, where postprandial leptin [43,
48] and insulin decreased [43, 47] after aerobic training while there was a tendency for GLP-1 in the
late postprandial period to increase with training [47].
4 Discussion
4.1 Appetite control in active and inactive individuals
This systematic review investigated differences in appetite ratings, food intake and appetite-related
peptides between active and inactive (or previously inactive) individuals in order to determine whether
habitual physical activity improves appetite control. In terms of fasting, postprandial or daily appetite
ratings, studies reported mixed results such that no clear differences could be distinguished between
physically active and inactive individuals. It has been suggested that combining appetite sensations
with objectively measured energy intake to calculate parameters such as the SQ can provide a better
23
two exercise-training studies [18, 41] assessed SQ with conflicting results, however the former
measured SQ during an ad libitum meal while in the latter studies SQ was measured during a
standardized meal. These differences, along with differences in the protocols in the other studies, may
account for the contradictory results in appetite ratings.
Several studies focused on the measurement of energy intake, but no consistent differences were
again found between active and inactive individuals. However, these simple comparisons precluded the
possibility that physical inactivity may lead to the dysregulation of appetite and subsequent
overconsumption, meaning that differences between active and inactive individuals may not always be
apparent. Indeed we have recently argued that the relationship between physical activity and energy
intake may follow a curvilinear function [23]. After transforming absolute energy intake into
standardized scores and distinguishing levels of physical activity from the definitions of the ‘active’
groups used in the cross-sectional studies, we were able to test this hypothesis. The results revealed a
significant quadratic effect illustrated by a J-shaped curve across physical activity levels (see Figure 2).
A similar J-shaped relationship has recently been suggested by Shook et al. [51], who compared
estimated energy intake, using an equation based on changes in body composition, across quintiles of
physical activity in a large heterogeneous sample of young adults. Their analysis provides further
support to our synthesis of the literature which demonstrates that the relationship between physical
activity level and energy intake is non-linear as postulated by Mayer et al. almost 60 years ago [52]. In
Bengali jute mill workers whose daily occupations ranged from ‘sedentary’ to ‘very heavy’ work, daily
energy expenditure and daily energy intake were closely matched at higher levels of daily physical
activity, but at low levels of daily physical activity this coupling was lost, such that daily energy intake
exceeded expenditure in those performing ‘sedentary’ or ‘light’ work [52]. This relationship may
explain why differences in energy intake may not be obvious between active and inactive individuals
as they stand at similar levels on the energy intake curve. As our findings are based on standardized
scores from results of studies using various methodologies and protocols [25-27, 31-37] and Shook and
colleagues’ inferred from changes in body composition [51], confirmation of this J-shaped relationship
is required with objective measures of energy intake in studies designed to assess intake across
well-defined physical activity levels.
Of interest to this review are the studies that used preload challenges or macronutrient
24
food intake or in meals that vary in composition. Three studies demonstrated that physically active
individuals have a better ability to make adjustments in energy intake following a high-energy preload
[19, 46, 48], suggesting an increased sensitivity to previous energy intake (e.g. greater satiety). Another
preload study also found more accurate energy compensation in active individuals, where the no
preload condition led to an increase in energy intake in active but not inactive individuals [37]. In line
with these studies, one study found that exercise training led to a reduction in meal size at a
high-energy dense meal but not at a low-high-energy dense meal [40]. This also supports the proposition of
increased sensitivity to the energy density of foods, but this time during a meal (e.g. greater satiation).
Interestingly, in this study it appeared that women may have been more susceptible to the effect than
men. Therefore, further studies in males and females are required to confirm this finding and the
potential interaction between physical activity and energy density on the sensitivity of appetite control.
Nonetheless, these data support a J-shaped relationship between physical activity and energy intake,
and suggest a better ability to regulate energy intake with increasing levels of physical activity.
Despite the effects observed following a preload, there was no consistent effect of physical
activity level on energy compensation immediately after an exercise bout or over several hours or days
after exercise [27, 33, 35, 36, 38]. These results do not support a recent meta-analysis that found that
absolute energy intake after acute exercise was greater in active individuals compared to those less
active [21]. However, this analysis only reported absolute energy intake and not energy compensation.
In fact, Charlot & Chapelot [27] report in their study on lean/fit and fat/unfit men that energy
compensation after exercise was highly variable and found no clear differences between groups. This
raises the concern of the reliability of the measure of energy compensation (discussed in section 4.3).
Nevertheless, in the short-term, it appears that in physically active individuals the regulation of energy
intake may be more sensitive to previous food intake rather than exercise.
4.2 Differences in the proposed mechanisms of appetite control
Eating behaviour is influenced by several proposed mechanisms, one of which is appetite-related
peptides. Acute exercise and exercise training also affect these peptides [53, 54]. The studies that
measured the peptide response to food intake found lower postprandial insulin [34, 43, 47, 49] and
greater postprandial GLP-1 [34] (and tendency [47]) in active individuals. An emphasis on insulin will
25
Interestingly, the same subjects that showed a preload effect in the study by Martins et al. [48] also
showed an improvement in insulin sensitivity [47]. Additionally, the aerobic training group in the study
by Guelfi et al. [43] significantly lowered postprandial insulin and improved insulin sensitivity with
concomitant changes in postprandial fullness. However, the resistance-training group in the same study
had a tendency for lower postprandial insulin (P = 0.066) and also improved insulin sensitivity after
training without an effect on postprandial appetite ratings, while another study that showed a preload
effect after six weeks of training did not find a significant improvement in insulin sensitivity [46].
Despite the relationship between insulin and appetite control not being consistent in the above studies,
a meta-analysis from Flint et al. [55] proposed that insulin resistance could lead to disrupted satiety
signalling. This meta-analysis showed that postprandial insulin was associated with satiety in
individuals with a healthy weight but not in overweight individuals; however it did not take into
account physical activity status of the participants nor their body composition (fat mass and fat-free
mass).
Measuring body composition, rather than just BMI, has become important in understanding the
mechanisms affecting eating behaviour as fat-free mass (but not fat mass) was found to be associated
with daily energy intake and meal size in overweight and obese individuals [56]. In addition to appetite
signals from adipose tissue and gut hormones, Blundell et al. [56] have proposed a role for fat-free
mass and resting metabolic rate as drivers of food intake. Differences in body composition were
apparent in the cross-sectional studies, as six reported lower body fat percentage in active individuals
[25, 33-37] despite only two reporting a lower BMI [25, 35]. Three of the former studies reported
enhanced appetite control in terms of more accurate energy compensation [33, 35, 37]. No
cross-sectional studies compared lean and overweight active individuals, thus a question arises as whether
‘fat but fit’ individuals would have enhanced appetite control. Four training studies conducted in
overweight participants reported improvements in appetite control post-intervention (but also showed
significant reductions in fat mass) [40, 41, 43, 48]. Overall, these studies indicate that differences in
body composition and insulin sensitivity may be factors promoting more sensitive appetite control in
active individuals. Furthermore, a recent study found faster gastric emptying in active compared to
inactive males [57], proposing another mechanism by which appetite control (i.e. satiety signalling)
could be better regulated in physically active individuals. More studies are required to elucidate the