Analysis of the composition of latent fingermarks by
spectroscopic imaging techniques.
FERGUSON, Leesa Susanne.
Available from Sheffield Hallam University Research Archive (SHURA) at:
http://shura.shu.ac.uk/19645/
This document is the author deposited version. You are advised to consult the publisher's version if you wish to cite from it.
Published version
FERGUSON, Leesa Susanne. (2013). Analysis of the composition of latent fingermarks by spectroscopic imaging techniques. Doctoral, Sheffield Hallam University (United Kingdom)..
Copyright and re-use policy
See http://shura.shu.ac.uk/information.html
Learning and Information Services Adsetts Centre, City Campus
Sheffield S1 1WD
1 0 2 0 4 0 8 5 3 7
Sheffield Hallam University Learning and Information Services
Adsetts Centre, City Campu Sheffield S1 1WD
ProQuest Number: 10694526
All rights reserved INFORMATION TO ALL USERS
The quality of this reproduction is dependent upon the quality of the copy submitted. In the unlikely event that the author did not send a com plete manuscript and there are missing pages, these will be noted. Also, if material had to be removed,
a note will indicate the deletion.
uest
ProQuest 10694526
Published by ProQuest LLC(2017). Copyright of the Dissertation is held by the Author.
All rights reserved.
This work is protected against unauthorized copying under Title 17, United States Code Microform Edition © ProQuest LLC.
ProQuest LLC.
789 East Eisenhower Parkway P.O. Box 1346
Analysis of the Composition of Latent
Fingermarks by Spectroscopic Imaging
Techniques
Leesa Susanne Ferguson
A thesis submitted in partial fulfilment of the requirements of
Sheffield Hallam University for the degree of Doctor of Philosophy
Dedication
To my beloved daughter,
Abstract
Despite the success of DNA fingerprinting, fingermarks remain an efficient
means of ascertaining the identity of an individual at many crime scenes. There
are numerous enhancement techniques used to develop fingermarks on a
range of deposition surfaces. Despite this, there is a need for further intelligence
to be gained in situations where fingermarks retrieved at crime scenes do not
yield identification.
The majority of the work presented in this thesis utilises MALDI mass
spectrometry in profiling and imaging mode to investigate latent fingermarks,
with SERS and ATR-FTIR used as complementary techniques.
One of the major issues of using analytical techniques to investigate latent
fingermarks is their inadequate application to real crime scene scenarios.
Presented within this thesis is a new method of matrix application that makes
MALDI-MSI forensically applicable and enables the distribution of various
endogenous lipids and exogenous compounds within fingermarks to be
visualised.
The work is extended to include detection of various antimicrobial peptides and
small proteins in the fingermarks of a cohort of 80 donors using MALDI mass
spectrometry profiling followed by multivariate statistical analysis in an attempt
to differentiate donors based on their sex.
Chemical imaging of latent fingermarks by SERS and ATR-FTIR is also
demonstrated, which could potentially lead to a three step multi-informative
Declaration
I declare that no part of this thesis has been submitted in support of any other
degree or qualification at this university or any other institute of learning.
All the work presented in this thesis was undertaken by myself, Leesa Susanne
Ferguson, with the exception of the statistical analysis presented in chapter 3,
which was carried out by Dr Florian Wulfert and the scanning electron
microscopy work presented in chapter 2, which was done by Dr Stuart Creasey,
Materials and Engineering Research Institute (MERI), Sheffield Hallam
University.
The ATR-FTIR work presented in chapter 4 was done in collaboration with Dr
Contents
DEDICATION... 1
ABSTRACT... 2
DECLARATION...3
CONTENTS... 4
LIST OF FIGURES...11
LIST OF TABLES...17
ABBREVIATIONS...18
LIPID SPECIES TENTATIVELY IDENTIFIED IN UNGROOMED FINGERMARKS BY HIGH MASS ACCURACY...23
OTHER TENTATIVELY IDENTIFIED SPECIES DETECTED WITHIN UNGROOMED FINGERMARKS... 24
PEPTIDE AND PROTEIN SPECIES TENTATIVELY IDENTIFIED IN FINGERMARKS...25
ACKNOWLEDGEMENTS... 26
1 GENERAL INTRODUCTION...27
1.1 Fin g e r m a r k s...28
1 .1 .1 Historyof Fin g e r m a r k s...29
1 .1 .2 Fin g e r m a r k Ty p e s...30
1.1 .3 La te n t Fin g e r m a r k Co m p o s it io n... 32
1 .1 .4 Co n v e n t io n a l Fin g e r m a r k En h a n c e m e n t Te c h n iq u e s...36
1.1.4.2 Physical Enhancement... 38
1.1.4.2.1 Powdering... 39
1.1.4.2.2 Vacuum Metal Deposition... 40
1.1.4.2.3 Small Particle Reagent... 41
1.1.4.3 Physical-chemical Methods... 42
1.1.4.3.1 Cyanoacrylate Fuming...43
1.1.4.3.2 Iodine Fuming... 44
1.1.4.4 Chemical Enhancement... 45
1.1.4.4.1 Ninhydrin...45
1.1.4.4.2 1, 8-Diazafluoren-9-one...47
1.1.4.4.3 1, 2-lndanedione...48
1.1.5 An a ly tic a l Te c h n iq u e sfo rt h e Analysiso f La t e n t Fin g e r m a r k s... 48
1.1.5.1 Exogenous Compounds Present in Fingermarks...49
1.1.5.2 Endogenous Compounds Present in Fingermarks...51
1.2 Mass Spectrom etry In str u m enta tio n...55
1.2.1 Io n is a t io n So u r c e s...55
1.2.1.1 Matrix Assisted Laser Desorption Ionisation Mass Spectrometry (MALDI-MS)...56
1.2.2 Mass An a l y s e r s...59
1.2.2.1 Quadrupole...59
1.2.2.2 Time of Flight...60
1.2.2.3 Tandem Instruments...65
1.2.3 Io n Mo b il ity Se p a r a t io n...67
1.2.3.1 Travelling Wave Ion Mobility Separation (TWIMS)...68
1.3 MALDI Mass Spectrom etry Imaging(MALDI-MSI)... 71
1.3.1 Ma tr ic e s fo rMALDI-MSI...74
1.3.2 Mic r o sc o pea n d M ic r o p r o b e MALDI-MSI...76
1.4.1 Ra m a n Sp ec tr o sc o p ya n d Su r fa c e En h a n c e d Ra m a n Sp e c tr o s c o p y(SERS)...78
1.4.1.1 Surface Enhanced Raman Scattering...79
1.4.2 Ra m a n/S E R S In s t r u m e n t a t io n...80
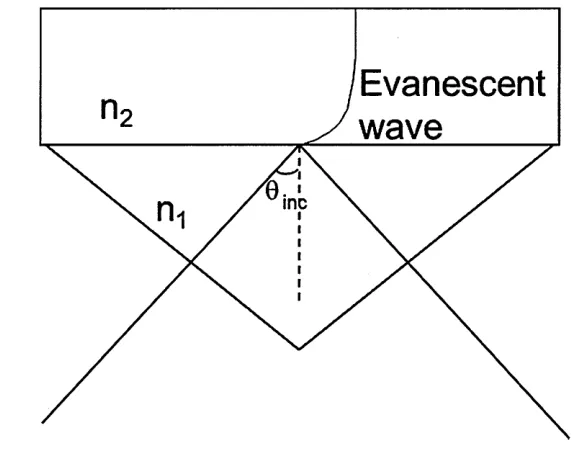
1.4.3 At t e n u a t e d To t a l Re flec tan c e - Fo u r ie r Tr a n s f o r m In f r a r e d Sp e c tr o s c o p y(ATR-FTIR).. 83
1.5 Fingerm arks Lip id o m ic s... ... 88
1.6 Fingerm arks Pr o t e o m ic s...90
1.7 Aims of S tu d y ...92
1.8 Re fe r e n c e s...94
2 THE "DRY-WET" METHOD OF MALDI MATRIX APPLICATION...120
2.1 Intro ductio n... 121
2.2 Ma ter ia ls... 128
2.3 Me t h o d s...128
2.3.1 In s t r u m e n t a t io n...128
2.3.2 Fin g e r m a r k Pr e p a r a t io n... 130
2.3.3 The Dry- Wet Ma tr ix Ap p l ic a t io n Me t h o d...131
2.3.4 Co m p a r is o n o f Gr o o m e d a n d Un g r o o m e d Fin g e r m a r k s Pr e pa r e d by t h e Dry- Wet Me t h o d...131
2.3.5 Co m p a r is o n o f Un g r o o m e d Fin g e r m a r k s Pre pa r e d byt h e Dry- W eta n d So l v e n t-Free Ma t r ix Ap p l ic a t io n Me t h o d s...131
2.3.6 Re p r o d u c ib il it y St u d y...132
2.3.7 In v e s t ig a t io n s in t o Ma t r ix Dis t r ib u t io n a n d Crystal Size in Re l a t io n t o Rid g e Pa t t e r n Qu a l it y...132
2.3.8 Co m p a r is o n o ft h e Dry- Wet Me t h o d w it ht h e Co n v e n t io n a l Sp r a y-Co a t in g Ma t r ix Ap p l ic a t io n Me t h o d...133
2.3.9 Hig h Mass Ac c u r a c y Me a s u r e m e n t s...133
2.3.11 T an d em M as s S p e c tr o m e tr y ...134
2.3.12 A p p lic a tio n o f th e D r y -W e t M e th o d t o U n g ro o m e d F in g e rm a rk s D eposited o n V a rio u s Substrates... 135
2.4 Results and Dis cu s sio n... 136
2.4.1 A p p lic a tio n o f th e D r y -W e t M e th o d t o G ro o m e d a n d U n g ro o m e d F in g e rm a rk s ...136
2.4.2 C o m p aris o n o f U n g ro o m e d F in g e rm a rk s P re p a red by th e D r y -W e t a n d S o lv e n t-F re e M a t r ix A p p lic a tio n M e th o d s ... 139
2.4.3 R e p ro d u c ib ility S tu d y ...144
2.4.4 The E ffe c t o f M a t r ix C ry s ta l Size a n d D is trib u tio n o n th e Q u a lity o f th e Ridge P a tte r n O b s e rv e d ...146
2.4.5 C o m p aris o n o f th e D r y -W e t a n d S p ra y -C o a tin g M a t r ix A p p lic a tio n M e th o d s f o r th e A n alysis o f th e L a te n t F in g e rm a rk s O b ta in e d fr o m T h re e D o n o r s ...149
2.4.6 H igh M ass A c c u ra c y M e a s u re m e n ts ...151
2.4.7 H igh R e s o lu tio n MALDI-MS Im a g in g ....154
2.4.8 T an dem M ass S p e c tr o m e tr y ...156
2.4.9 F oren sic A p p lic a b ility o f th e D r y -W e t M e th o d ...162
2.4.10 F in g e rm a rk s L ifte d fr o m D iffe r e n t D epo sitio n S u rfa c e s ...164
2.5 Co n c lu s io n s... 169
2.6 Referen ces...170
3 PEPTIDE CHAPTER... 177
3.1 Intro ductio n... 178
3.1.1 D e te c tio n o f Peptides a n d P ro te in s in L a te n t F in g e rm a rk s ...178
3.1.2 D is c rim in a tio n S tu d ie s ...179
3.1.3 P a r tia l Least S q u a re s D is c rim in a te A n alysis (PLSDA)...181
3.2 Ma ter ia ls... 182
3.3.1 In s t r u m e n t a t io n a n d In s t r u m e n t a l Se t t in g s... 183
3.3.2 Fin g e r m a r k Pr e p a r a t io n... 183
3.3.3 Op t im is a t io n o fMALDI Ma t r ixa n d Co m p o s it io n ... 184
3.3.4 Op t im is a t io n o ft h e Io n Ab u n d a n c ea n d In te n s it yf r o m Gr o o m e d Fin g e r m a r k s... 184
3.3.5 Sex Dis c r im in a t io n St u d ie s...184
3.3.5.1 Pilot Sex Discrimination Study... 185
3.3.5.2 Large Sex Discrimination Study...185
3.3.6 St a t is t ic a l An a l y s is...185
3.3.6.1 Pilot Sex Discrimination Study...185
3.3.6.2 Large Sex Discrimination Study... 186
3.3.7 MALDI-MS IM AGING OF PEPTIDES AND SMALL PROTEINS... 187
3.3.7.1 Application of Matrix via Automated Spraying... 188
3.3.7.2 Application of Matrix via Manual Spraying... 188
3.3.7.3 Application of Matrix via Acoustic Ejection Technology... 189
3.3.7.4 Application of Matrix via Dry-Wet Method... 189
3.4 Resultsand Dis c u s sio n... 189
3.4.1 Pil o t Sex Dis c r im in a t io n St u d y... 199
3.4.2 La r g e Sex Dis c r im in a t io n St u d y... 203
3.4.3 Im a g in g Pe ptid e sa n d Pr o t e in sw it h in Fin g e r m a r k s... 208
3.5 Co n c l u s io n...231
3.6 Refe re n c e s...232
4 ANALYSIS OF FINGERMARKS BY SERS & ATR-FTIR...238
4.1 Intro ductio n...239
4.1.1 Ra m a n Sp ec tr o sc o p ya n dATR-FTIR Analysiso f La t e n t Fin g e r m a r k s...240
4.2 Ma ter ia ls...244
4.3.1 In s t r u m e n t sa n d In s t r u m e n t a l Pa r a m e t e r s...244
4.3.1.1 Raman Instrumentation...244
4.3.1.2 ATR-FTIR Instrumentation... 245
4.3.1.3 MALDI-MSI Instrumentation...245
4.3.2 Pr e p a r a t io n o f Fin g e r m a r k s...245
4.3.2.1 Groomed Fingermarks...245
4.3.2.2 Condom Lubricant Contaminated Fingermarks...246
4.3.3 Analysiso f La t e n t Fin g e r m a r k s by Su r fa c e En h a n c e d Ra m a n Sp e c t r o s c o p y(SERS)... 246
4.3.3.1 Deposition of Gold Colloid of Different Concentrations and Particle Size...246
4.3.3.2 Pre-Concentrating the 100 nm Colloid...246
4.3.3.3 Order of Deposition of 150 nm Colloid...247
4.3.3.4 Use of Salt Aggregates with lOOnm Colloid...247
4.3.3.5 Raman Images...247
4.3.4 Analysiso f Fin g e r m a r k sby At t e n u a t e d To t a l Reflectance Fo u r ie r Tr a n s f o r m In f r a r e d Sp ec tr o sc o p y(ATR-FTIR)... 247
4.3.4.1 Analysis of Groomed Fingermarks...247
4.3.4.2 Analysis of Condom Lubricant Contaminated Fingermarks... 248
4.3.5 An a lysis o f Gr o o m e d a n d Co n d o m Lu b r ic a n t Co n t a m in a t e d Fin g e r m a r k s by MALDI-MSI...248
4.4 RESULTS AND DISCUSSION... 248
4.4.1 Su r fa c e En h a n c e Ra m a n Sp ec tr o sc o p y(SERS)... 248
4.4.1.1 Effect of Gold Colloid Concentration and Particle size... 248
4.4.1.2 Use of Salt Aggregates with 100 nm Colloid... 253
4.4.1.3 Order of Deposition of 150 nm Colloid... 255
4.4.1.4 SERS Imaging...256
4.4.2.1 Analysis of Groomed Fingermarks by ATR-FTIR...259
4.4.2.2 Analysis of Groomed Fingermarks by MALDI-MSI...262
4.4.2.3 Analysis of Condom Lubricant Contaminated Fingermarks by ATR-FTIR prior to MALDI-MSI Analysis...265
4.4.2.4 Analysis of Condom Lubricant Contaminated Fingermarks by MALDI-MSI following ATR FTIR Analysis...268
4.5 Co n c lu s io n... 270
4.6 Refe r e n ce s...272
5 FINAL CONCLUSIONS...278
5.1 Co n c lu s io n s...279
5.2 Refe re n c e s...283
6 PUBLICATIONS, POSTER PRESENTATIONS AND ORAL PRESENTATIONS... 286
6.1 Pu b lic a tio n s...287
6.2 Poster Pr es en tatio ns...289
List of Figures
Figure 1-1: The 3 main classification groups of fingermarks; loops, whorls and arches and their subgroups...31 Figure 1-2: A fingermark showing some of the possible local ridge characteristics (minutiae) that enable fingermarks to be distinguished from one another...32 Figure 1-3: The eccrine, sebaceous and apocrine glands...34 Figure 1-4: A fingermark enhancement technique workflow for fingermarks deposited on an untreated metal surface... 36 Figure 1-5: Jablonski diagram showing the promotion of a fluorescent molecule from the ground state to a higher energy vibrational state... 38 Figure 1-6: Latent fingermarks developed on a glass slide by dusting with rhodamine 6-G-incorporated nanoparticles in (a) white light illumination and (b) UV illumination... 40 Figure 1-7: A 3 day old grab impression developed on nylon by Vacuum Metal Deposition (VMD)...41 Figure 1-8: A latent fingermark deposited on a glass slide and immersed in water for 96 hours before development by cyano blue Small Particle Reagent (SPR)...42
Figure 1-9: The polymerisation mechanism for ethyl cyanoacrylate (ECA) 44
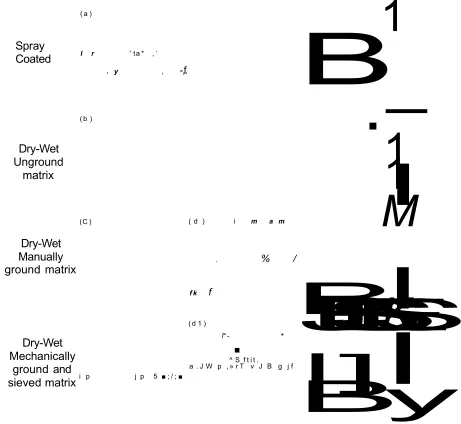
Figure 1-17: A schematic of a time of flight mass spectrometer operating in (a) linear mode, and (b) reflectron mode, showing the flight path of the ions through the field-free drift tube... 64 Figure 1-18: Schematic of the Applied Biosystems/MDS Q-Star Pulsar-i mass spectrometer, showing the layout of the QqTOF mass analyser together with the MALDI ionisation source...66 Figure 1-19: A stacked ring ion guide... 69 Figure 1-20: A Schematic of the Synapt HDMS system, fitted with a MALDI source...70 Figure 1-21: Schematic showing the steps involved in MALDI-MS profiling and imaging experiments... 73 Figure 1-22: A simplified diagram depicting the changes in energy levels in Rayleigh, Stokes and anti-Stokes scattering... 79 Figure 1-23: Schematic showing the principal components of a RamanStation 400 Series spectrometer...82 Figure 1-24: Schematic of an Echelle spectrograph... 83 Figure 1-25: Schematic of an interferometer... 86 Figure 1-26: Schematic of the evanescent wave extending from the ATR crystal into the sample...88 Figure 2-1: A Chemical Inkjet Printer (ChIP) which enables contactless microspotting of matrix onto samples...122 Figure 2-2: A Portrait 630 multi-reagent spotter, which uses acoustic droplet ejection technology to dispense matrix onto samples...123 Figure 2-3: SunCollect auto-spraying system, which deposits matrix as a fine mist onto samples...124 Figure 2-4: The apparatus required for matrix sublimation...126 Figure 2-5: A histogram (a) and the corresponding mass spectra (b) showing
the relative intensity of ions at specific m/z values obtained from groomed (in
blue in panel a) and ungroomed fingermarks (in red in panel a) prepared by the dry-wet method... 138 Figure 2-6: Distribution images of various lipid species within an ungroomed fingermark prepared by the dry-wet method...140 Figure 2-7: A histogram (a) and corresponding mass spectra (b) showing the
average intensity at three m/z values obtained from two ungroomed
Figure 2-8: MALDI-MS Images showing the distribution of three tentatively
identified fatty acids (palmitoleic acid at m/z 255.2, oleic acid at m/z 283.3 and
eicosenoic acid at m/z 311.3) within ungroomed fingermarks prepared by the
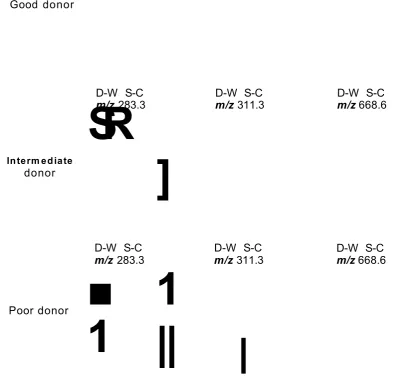
dry-wet method (left), or the solvent free matrix application method (right).... 143 Figure 2-9: MALDI-MSI reproducibility study...145 Figure 2-10: The Fingerprint sampler, which has been shown to improve reproducibility in fingermark deposition...146 Figure 2-11: SEM and MALDI-MS images of fingermarks prepared by the spray coating matrix application method (a-a2), and the dry-wet method (b-b2), (c-c2) and (d-d2)...148 Figure 2-12: MALDI-MSI analysis of fingermarks prepared with either the dry-wet (D-W) or the spray coating (S-C) matrix application method... 150 Figure 2-13: High resolution images of ungroomed fingermarks prepared by the dry-wet matrix application method...155 Figure 2-14: High resolution images of ungroomed fingermarks prepared by the dry-wet matrix application method...156
Figure 2-15: MS/MS spectra of eicosenoic acid (m/z 311.3) obtained from (a)
eicosenoic acid standard and (b) directly from a fingermark prepared by the dry-wet method...158
Figure 2-16: MS/MS spectra of oleic acid (m/z 283.3) obtained from (a) an oleic
acid standard and (b) directly from a fingermark prepared by the dry-wet method. (Ferguson et al., 2013)... 161 Figure 2-17: The distribution images of the MS/MS fragment ions after CID of
the species at m/z 283.3 corresponding to oleic acid... 162
Figure 3-4: MALDI TOF MS spectra of eccrine, groomed and ungroomed fingermarks... 198 Figure 3-5: Classification results and validation using an independent test set. 200 Figure 3-6: Regression vector for the PLSDA model using 6 latent variables.201 Figure 3-7: SEM images at x700 and x3000 magnification showing the co crystal formation of two different matrices: 5 mg/mL a-CHCA in 70:30
ACN/0.5% TFA and 5 mg/mL a-CHCA in 25:25:50 ACN/ethanol/0.5% TFA
deposited onto an ungroomed fingermark by the direct droplet method 203
Figure 3-17: Mass spectra obtained from groomed fingermarks after application of 10 mg/mL a-CHCA/aniline in a 50:50 ACN/0.5% TFA by: acoustic ejection technology (a) and the direct droplet method (b)... 226 Figure 3-18: Mass spectra obtained from groomed fingermarks. Spectrum (a) shows a fingermark that was dusted with a-CHCA and sprayed with 70:30 ACN/0.5 TFA. Spectrum (b) shows a fingermark after application of 5 mg/mL a-CHCA 70:30 ACN/0.5% TFA by the direct droplet method... 228 Figure 3-19: Mass spectra obtained from groomed fingermarks. Spectrum (a) shows a fingermark that was dusted with a-CHCA/SA and sprayed with 70:30 ACN/0.5 TFA. Spectrum (b) shows a fingermark after application of 5 mg/mL a-CHCA 70:30 ACN/0.5% TFA by the direct droplet method...230 Figure 4-1: SERS spectra obtained after application of a single drop (1pL) of three gold colloids of different particle size and concentration (a) 50 nm dilute colloid, (b) 100 nm dilute colloid, and (c) 150 nm Raman specification colloid to a groomed fingermark deposited on a MALDI spotless insert (Ferguson et al., 2010a and 2010b)... 250 Figure 4-2: SERS spectra of a groomed fingermark deposited on a MALDI spotless insert after application of multiple layers of a 100 nm dilute gold colloid.
... 252 Figure 4-3: Spectra of (a) a groomed fingermark with a 1:1 mixture of 100 nm dilute colloid and 0.1 M Na2S04, (b) 100 nm colloid and 0.1 M Na2S04 only, and (c) 100 nm colloid and a fingermark only (Ferguson et al., 2010a and 2010b)... 254 Figure 4-4: SERS spectra after deposition of (a) 150 nm gold colloid below a groomed fingermark and (b) above a groomed fingermark (Ferguson et al., 2010a and 2010b)...255 Figure 4-5: Fingermark images obtained by integrating the peak area between 1010 and 990 cm'1 and the corresponding SERS spectra on three different deposition surfaces: MALDI stainless steel insert, aluminium plate and Klarite™.
... 258 Figure 4-6: ATR-FTIR image and spectra showing the ATR-FTIR image of a groomed fingermark recovered from an aluminium can with a BVDA gelatine lift.
Figure 4-8: MALDI-MS images of oleic acid at m/z 283.3, eicosadienoic acid at m/z 309.3, eicosenoic acid at m/z 311.3 and amino-octadecanoic acid at m/z 668.6... 264 Figure 4-9: ATR-FTIR imaging analysis of a Condomi Max Love lubricant contaminated fingermark recovered from a ceramic tile with a BVDA gelatine lift.
List of Tables
Abbreviations
ACN Acetonitrile
AD Atopic dermatitis
ATR Attenuated total reflectance
ATR-FTIR Attenuated total reflectance Fourier transform infrared
CCD Charge coupled device
CE Cholesterol ester
a-CHCA a-cyano-4-hydroxycinnamic acid
Cl Chemical ionisation
CID Collision induced dissociation
DAN 1 ,5-Diaminonapthalene
DART Direct analysis in real time
DC Direct current
DCD Dermcidin
DESI Desorption electrospray ionisation
DESI-MS Desorption electrospray ionisation mass spectrometry
DFO 1, 8-Diazafluoren-9-one
DG Diacylglycerides
DHB 2, 5-dihydroxybenzoic acid
dp Penetration depth
ECA Ethyl cyanoacrylate
El Electron ionisation
ESI Electrospray ionisation
FETs Fingermark enhancement techniques
FT-ICR Fourier transform ion cyclotron resonance
FT Fourier transform
FTIR Fourier transform infrared
FWHM Full width at half maximum
GC-MS Gas chromatography mass spectrometry
HDMS High definition mass spectrometry
HV Accelerating voltage
IgG Immunoglobulin G
IL Ionic liquid
InGaAs Indium gallium arsenide
IMS Ion mobility spectrometry
IR Infrared
KBr Potassium bromide
KNO3 Potassium nitrate
K2SO4 Potassium sulfate
LAESI Laser ablation electrospray ionisation
LDI Laser desorption/ionisation
LDI-TOF-MS Laser desorption/ionisation time of flight mass spectrometry
LOD Limit of detection
MALDI Matrix assisted laser desorption/ionisation
MALDI-MS Matrix assisted laser desorption/ionisation mass
MALDI-MSI Matrix assisted laser desorption/ionisation mass spectrometry imaging
MALDI MSP Matrix assisted laser desorption/ionisation mass
spectrometry profiling
MgSC>4 Magnesium sulfate
MS Mass spectrometry
MALDI-TOF Matrix assisted laser desorption/ionisation - time of flight
MALDI-TOF-MS Matrix assisted laser desorption/ionisation - time of flight -
mass spectrometry imaging
M0S2 Molybdenium disulphide
MSI Mass spectrometry imaging
MS/MS Tandem mass spectrometry
MSP Mass spectrometry profiling
m/z Mass to charge
N2 laser Nitrogen laser
NaCI Sodium chloride
Na2SC>4 Sodium sulphate
Nd:YAG Neodymium-doped yttrium aluminium garnet
NIR Near infrared
oaTOF Orthogonal acceleration time of flight
PAFFT Peak alignment by fast Fourier transform
PAGE Polyacrylamide gel electrophoresis
PDMS Polydimethylsiloxane
PEG Polyethylene glycol
ppm parts per million
PVDF Polyvinylidene fluoride
Q Quadrupole
QQQ Triple quadrupole
QTOF Quadrupole time of flight
QTrap Quadrupole ion trap
RF Radio frequency
Rl Refractive index
RP-HPLC Reverse phase high performance liquid chromatography
SA Sinapinic acid
SALDI-TOF-MS Surface assisted laser desorption time of flight mass
spectrometry
SELDI-MS Surface enhanced laser desorption/ionisation-mass
spectrometry
SEM Scanning electron microscopy
SERS Surface enhanced Raman spectroscopy
SIM Selected ion monitoring
SIMS Secondary ion mass spectrometry
Si02 Silicon dioxide
SMALDI-MS Scanning microprobe matrix assisted laser
desorption/ionisation mass spectrometry
SOCOs Scene of Crime Officers
SPR Small particle reagent
SRIG Stacked ring ion guide
TG Triglyycerides
TLC Thin layer chromatography
TOF Time of Flight
TOF-MS Time of flight-mass spectrometry
TWIMS Travelling wave ion mobility spectrometry
UK United Kingdom
UV Ultra violet
VIP Variable importance in projection
VMD Vacuum metal deposition
VP Variable pressure
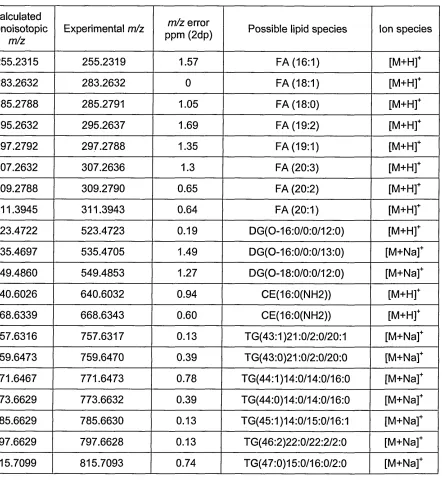
Lipid Species Tentatively Identified in Ungroomed Fingermarks by
High Mass Accuracy
Calculated monoisotopic m/z Experimental m/z m/zerror ppm (2dp)
Possible lipid species speciesIon
255.2315 255.2319 1.57 FA (16:1) - palmitoleic acid [M+H]+
283.2632 283.2632 0 FA (18:1) - oleic acid [M+H]+
285.2788 285.2791 1.05 FA (18:0) - stearic acid [M+H]+
295.2632 295.2637 1.69 FA (19:2) - nonadecadienoic acid [M+H]+
297.2792 297.2788 1.35 FA (19:1) - nonadecenoic acid [M+Hf
307.2632 307.2636 1.30 FA (20:3) - eicosatrienoic acid [M+Hf
309.2788 309.2790 0.65 FA (20:2) - eicosadienoic acid [M+H]+
311.3945 311.3943 0.64 FA (20:1)-eicosenoic acid [M+Hf
523.4722 523.4723 0.19 DG(0-16:0/0:0/12:0) [M+Hf
535.4697 535.4705 1.49 DG(0-16:0/0:0/13:0) [M+Naf
549.4860 549.4853 1.27 DG(0-18:0/0:0/12:0) [M+Naf
640.6026 640.6032 0.94 CE(16:0(NH2)) [M+Hf
668.6339 668.6343 0.60 CE(16:0(NH2)) [M+Hf
757.6316 757.6317 0.13 TG(43:1)21:0/2:0/20:1 [M+Naf
759.6473 759.6470 0.39 TG(43:0)21:0/2:0/20:0 [M+Naf
771.6467 771.6473 0.78 TG(44:1)14:0/14:0/16:0 [M+Naf
773.6629 773.6632 0.39 TG(44:0)14:0/14:0/16:0 [M+Naf
785.6629 785.6630 0.13 TG(45:1)14:0/15:0/16:1 [M+Naf
797.6629 797.6628 0.13 TG(46:2)22:0/22:2/2:0 [M+Naf
815.7099 815.7093 0.74 TG(47:0)15:0/16:0/2:0 [M+Naf
Other Tentatively Identified Species Detected Within Ungroomed
Fingermarks
Experimental m/z Possible species Ion species
201.2 Dodecanoic acid [M+H]+
229.2 Tetradecanoic acid [M+H]+
230.2 13-aminotridecanoic acid [M+H]+
237.2 Dehydrated palmitoleic acid [M-H20+H]+
243.2 Pentadecanoic acid [M+H]+
257.2 Palmitic acid [M+H]+
299.2 Nonadecanoic acid [M +Hf
304.2 Alkyl (Ci2)-Dimethylbenzylammonium [M+Hf
369.4 Dehydrated cholesterol [M-H20 + H f
431.2 Vitamin E [M+H]+
550.6 Dimethyldioctadecylammonium [M+Hf
583.6 DG [M+Na]+
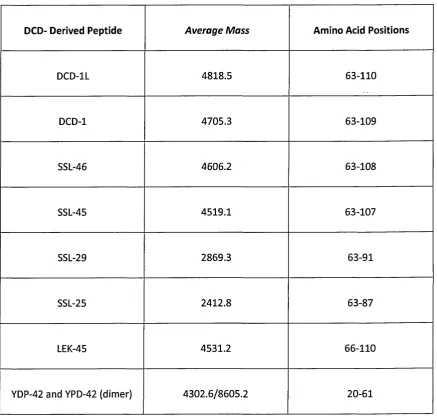
Peptide and Protein Species Tentatively Identified in Fingermarks
Peptide/Protein Protonated
Theoretical Mass Amino Acid Positions
DCD-1L 4819.5 63-110
DCD-1 4706.3 63-109
SSL-46 4607.2 63-108
SSL-45 4520.1 63-107
SSL-29 2870.3 63-91
SSL-25 2413.8 63-87
LEK-45 4532.2 66-110
YDP-42 and YPD-42
(dimer) 4303.6/8606.2 20-61
Psoriasin 11,377.2 2-120, serine acylated, 1
disulphide bridge
Acknowledgements
First and foremost, I would like to express my sincere thanks and gratitude to
my supervisors, Dr Simona Francese and Dr Rosalind Wolstenholme for the
help, support and encouragement they’ve provided during the course of my
PhD.
I would also like express my gratitude to Dr Florian Wulfert, Dr Stuart Creasey,
Dr Kerstin Mader, Dr Chris Sammon, Professor Malcolm Clench and Dr Vikki
Carolan for their input, expertise and advice over the last 4 years.
I would like to thank all of my colleagues at Sheffield Plallam University, for their
support and friendship throughout my PhD. I especially want to thank Dr Kate
Phillips, for all of her help formatting this thesis and for her friendship. I also
wish to offer a very special thank you to Dr Laura Cole, Robert Bradshaw, Eva,
llles-Toth, Dr Philippa Hart, Dr Jillian Newton, Patrick Harrison, Bryn Flinders,
Chris Mitchell and Richard Battle for their friendship and support.
To my dear friends, Denise, Rachel, Barbara, Dawn and Neil, thank you for your
patience, encouragement and belief.
A very special thank you to my parents, Ian and Susan and my beloved sister
Julie, for all the help, support and encouragement they've provided throughout
my life. Thanks for walking the dogs, dad.
To my dogs, Mocha, Morph and Jasper, thank you for your loyalty, friendship,
love and making me laugh.
Last, but definitely not least, I wish to thank my beloved daughter Sienna. I
really couldn't have done it without you. Thank you for being everything I could
1.1 Fingermarks
Fingermarks result from the transfer of material from the surface of the skin to a
surface following contact. They differ from fingerprints, which are control prints
where the donor is known and an imprint is obtained using either ink or a direct
scan. The friction ridge pattern of fingermarks is unique to every individual and
remains unchanged throughout life unless scarred, thereby enabling a means of
personal identification (Lambourne, 1977; Reed, 1981).
Fingermarks can be divided into three distinct groups: patent fingermarks,
plastic fingermarks and latent fingermarks. Patent fingermarks are visible to the
naked eye as they contrast well with the substrate onto which they are
deposited. They are formed by the transfer of opaque materials such as blood,
make-up or paint onto a surface. Plastic fingermarks are formed when a
negative ridge impression is created in a soft substrate such as putty or candle
wax. Latent fingermarks are invisible to the naked eye and are the most
frequent type of fingermark found at crime scenes. They are predominantly
composed of transparent endogenous species and require enhancement by
one of the established fingermark enhancement techniques (FETs) to enable
visualisation (Bowman, 2005).
In the United Kingdom (UK), fingermarks recovered from crime scenes can be
submitted and compared to fingerprints stored on the National Fingerprint
Database "IdentT'. As of April 2010, the database held 1.9 million unidentified
marks on record and 8.3 million individuals' ten-prints. Historically, in the UK, 16
ridge characteristics (minutiae) were required for a full identification. Since 2001
however, there is no minimum quantitative standard and the responsibility of
ascertaining identification lies with the fingerprint expert, whose opinion must be
1.1.1 History of Fingermarks
The use of fingermarks as a means of identification for criminal purposes dates
back to the mid nineteenth century when Sir William Herschel began to acquire
the imprint of the right hand of Indian citizens as a way of preventing the forgery
of signatures. Indeed, Herschel was the first person to document that an
individual’s ridge pattern on their hands and feet did not change from birth
(Lambourne, 1977; Reed, 1981).
Sir Francis Galton published the first comprehensive work specifically about
fingerprints in 1892. The book discussed a classification system based on three
distinct ridge patterns (arches, loops and whorls) stating, for the first time, that
no two individuals possessed the same ridge pattern, thus offering a possible
means of identification (Lambourne, 1977; Saferstein, 2011).
In 1897, Edward R. Henry, Inspector General for the lower India provinces,
formulated a workable classification system, based on that of Galton, which
came into general use throughout India. Subsequently, in the UK, a committee
was established under the chairmanship of Lord Belper to decide whether the
system of identification based on body measurements and fingerprints that was
in place at the time should be superseded by the Henry classification system.
The committee subsequently concluded that immediate steps should be taken
to introduce the Henry system of identification in the UK. The system was
implemented by Scotland Yard in 1901 and is still employed today in the
majority of English speaking countries (Lambourne, 1977; Reed, 1981;
Saferstein, 2011).
The first criminal case in the UK, leading to a conviction based on fingermark
evidence occurred in 1902. Henry Jackson was convicted after his thumb print
on fingermark evidence occurred three years later; a thumb print was found at
the murder scene of a married couple, leading to the death penalty for two
brothers Alfred and Albert Stratton (Lambourne, 1977; Reed, 1981).
These early successes led to fingermark evidence becoming established as the
dominant means employed to link a suspect to a crime scene, and today it still
remains one of the primary methods of ascertaining an individual’s identity.
1.1.2 Fingermark Types
The complex pattern of ridges that make up fingermarks can be divided into
three main classes dictated by the general ridge flow; loops, whorls and arches.
These patterns are formed by the combination of ridge systems that are
interconnected around key focal points called core(s) and delta(s) (Fraser and
Williams, 2009). Approximately 60% of the population have loops, 35% whorls
and 5% arches. Loops can be subdivided into radial or ulna loops, depending
on whether the loop flows and opens towards the radial or ulna bone in the
forearm. Whorls can be classified as plain whorl, central pocket loop, double
pocket loop or accidental, arches can be either plain or tented (Saferstein,
2011). The general ridge flow of fingermarks is also known as Galton level 1
details. Figure 1.1 shows the three main classes of fingermark ridge patterns
Radial Loop Ulna Loop Plain Arch Tented Arch
(lefthand) (left hand)
Plain Central Pocket Double Loop Accidental
Whorl 'Whorl 'Whorl Whorl
Figure 1-1: The 3 main classification groups of fingermarks; loops, whorls and arches and their subgroups.
Approximately 60% of the population have loops, 35% whorls and 5% arches. Image
adapted from Federal Bureau of Investigation (1957).
In addition, fingermark patterns can be distinguished further by local
characteristics of the ridge pattern called minutiae (ridge endings, short
independent ridges, bifurcations, lakes, islands and spurs), also known as
Galton level 2 details (Fraser and Williams, 2009). Figure 1.2 shows a
fingerprint containing some of the possible minutiae.
Addition characteristics of fingermarks known as Galton level 3 details include
features of the fingermark ridges such as the width of the ridge, the shape of the
edge of the ridge and the number and location of pores present within the ridge
Lake
Ridge
ending Short independent
ridge Bifurcation
Figure 1-2: A fingermark showing some of the possibie local ridge characteristics (minutiae) that enable fingermarks to be distinguished from one another.
Image obtained from Jackson and Jackson (2011).
1.1.3 Latent Fingermark Composition
Latent fingermarks are the most common type found at crime scenes. They are
composed of a mixture of species originating from three sources: (1) the
epidermis, (2) the sweat glands within the dermis and (3) semi-exogenous and
exogenous contaminants (Girod et al., 2012). The epidermis is responsible for
the presence of some proteins in fingermark residue resulting from the
desquamation process required for skin renewal (Drapel et al., 2009; Girod et
al., 2012), as well as the presence of innate antimicrobial proteins such as
psoriasin (Schroder and Harder, 2006). Within the dermis are the three major
sweat glands, the eccrine, sebaceous and apocrine glands that are responsible
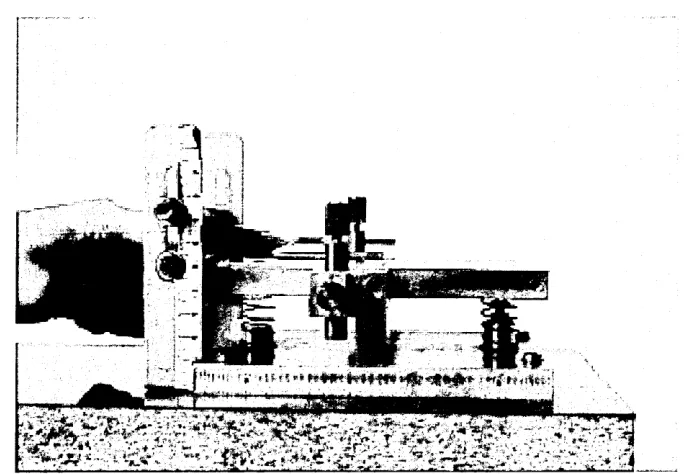
[image:36.615.132.455.20.301.2]Between two and four million eccrine sweat glands are distributed throughout
the body, with the highest density on the palms of the hands, palmar surfaces,
and the soles of the feet, plantar surfaces. Sebaceous glands are absent on the
palmar and plantar surfaces, but are present on all other skin surfaces (highest
density on the face and scalp). Apocrine glands are located predominantly in
the genital and axillary regions. Fingermark residue consists primarily of
secretions from the eccrine and sebaceous glands. Even though only eccrine
glands are present on the palms of the hands, the fingers become contaminated
with sebaceous secretions due to regular contact with other parts of the body
such as the hair and face, (Ramotowski, 2001). Eccrine sweat is predominantly
composed of water, but also contains numerous organic and inorganic
constituents, such as amino acids, proteins and salts (Ramotowski, 2001).
Sebaceous sweat consists of mainly organic compounds such as fatty acids,
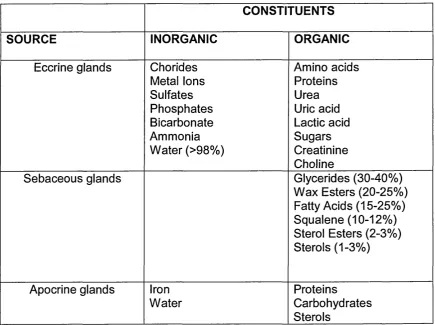
triglycerides, wax esters and sterols (Knowles, 1978). Figure 1.3 shows the
three major sweat glands and table 1.1 shows the chemical constituents
originating from each of the three glands.
In addition to the endogenous species originating from the epidermis and sweat
glands, latent fingermarks may also comprise semi-exogenous compounds
such as caffeine, which have been ingested and are subsequently secreted
intact or together with their metabolites in sweat. Exogenous contaminants such
as toiletries, cleaning products, make-up and even illegal substances such as
explosives or drugs of abuse may also be present in latent fingermarks, which
Eccrine / \G ia n d
1 - ' y
^ > v v ’
fc & t
S e b a c e o u s G la n d
A r rector Pi I Muscle
A p o c rin e G la n d
v/
fl 7Figure 1-3: The eccrine, sebaceous and apocrine glands.
Eccrine, sebaceous and apocrine glands are responsible for the secretion of sweat through the epidermal pores onto the skin surface. Image obtained from Ramotowski
A summary of the chemical composition of sweat originating from the eccrine,
sebaceous and apocrine glands is presented in table 1.1.
CONSTITUENTS
SOURCE INORGANIC ORGANIC
Eccrine glands Chorides
Metal Ions Sulfates Phosphates Bicarbonate Ammonia Water (>98%) Amino acids Proteins Urea Uric acid Lactic acid Sugars Creatinine Choline
Sebaceous glands Glycerides (30-40%)
Wax Esters (20-25%) Fatty Acids (15-25%) Squalene (10-12%) Sterol Esters (2-3%) Sterols (1-3%)
Apocrine glands Iron
Water CarbohydratesProteins
Sterols
Table 1-1: A summary of the chemical constituents present in the sweat originating from the three major sweat glands.
Table adapted from Ramotowski (2001) and Knowles (1978).
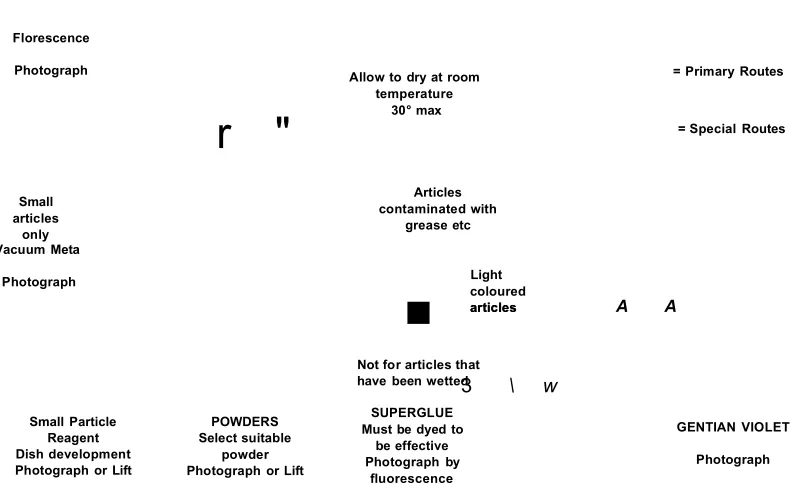
At present, there are numerous FET that are recommended by the Home Office
to visualise latent fingermarks at crime scenes. The Home Office collates the
information in the “Manual of Fingerprint Development Techniques” (Bowman,
2005). The manual provides guidance and informs Scene of Crime Officers of
the appropriate fingermark enhancement techniques to use in any situation and
the sequential workflows that should be adhered to, in order to obtain optimum
results. An example of a suggested workflow is shown in figure 1.4 for
[image:39.613.74.510.81.406.2]METAL (Untreated) Florescence
r "
Photograph Small articles only Vacuum Meta Photograph Visual Examination PhotographAllow to dry at room temperature
30° max
= Primary Routes
= Special Routes
Articles contaminated with grease etc Light coloured
■
articles Not for articles that have been wettedarticles A A
3 \ w
Small Particle
Reagent Select suitablePOWDERS
SUPERGLUE Must be dyed to
be effective Photograph by
fluorescence
GENTIAN VIOLET Dish development
Photograph or Lift Photograph or Liftpowder Photograph
Figure 1-4: A fingermark enhancement technique workflow for fingermarks deposited on an untreated metal surface.
Image adapted from Bowman (2005).
1.1.4 Conventional Fingermark Enhancement Techniques
The main objective of fingermark enhancement is simply to obtain the best
optical contrast possible between the fingermark ridge pattern and the
underlying deposition surface without destroying any of the available ridge detail
(Becue et al., 2010). The choice of enhancement method employed to visualise
latent fingermarks is primarily dependent on the nature of the deposition surface
and the chemical composition of the mark. The majority of fingermark
enhancing methods currently employed involve either a physical interaction or a
chemical reaction between the selected development reagent and an
[image:40.614.93.493.75.324.2]The techniques employed for the visualisation of latent fingermarks can be
divided into four main categories; (1) optical methods, (2) physical methods,
(3) physical-chemical methods, and (4) chemical methods (Zhang et al., 2007;
Choi et al., 2008). A general limitation of these techniques is that, as
fingermarks age, their composition changes. Environmental factors such as
temperature, humidity and light greatly contribute to the degradation of
endogenous species thus affecting the enhancement and recovery of the
fingermark, as many of the constituents to which the development reagent
interacts are no longer present (Bowman, 2005).
1.1.4.1 Optical Examination Methods
Optical examination using lasers, high intensity light sources and appropriate
viewing filters is often the first enhancement technique implemented at a crime
scene as it is non-destructive. When exposed to optical examination,
endogenous constituents such as lipids and exogenous contaminants present in
latent fingermarks exhibit fluorescence (Menzel and Duff, 1979). Fluorescence
occurs when the electrons of molecules in the ground state absorb light of an
appropriate wavelength and are promoted to one of the higher energy
vibrational levels of the 1st excited electronic state. The excess vibrational
energy is lost until the molecules are in the lowest energy vibrational state. The
electrons finally return to the ground state, with the emission of a photon of light
— Highest energy vibration state — Lowest energy vibration state
T] co
3
o o3 o o
— hv
Ground state
Figure 1-5: Jablonski diagram showing the promotion of an electron in a fluorescent molecule from the ground state to a higher energy vibrational state. Electrons in fluorescent molecules are promoted from the ground state to a higher energy vibrational state by absorbing energy of an appropriate wavelength. The electrons subsequently drop to a lower energy level and emit a photon of light at a longer wavelength than that of the photon originally absorbed by the molecule. Image adapted from Bleay et al. (2012).
In addition to the fluorescence displayed by some endogenous compounds and
exogenous contaminants of latent fingermarks, some of the chemical
treatments applied to fingermarks such as 1, 8 - Diazafluoren-9-one (DFO) also
exhibit fluorescence when exposed to appropriate light sources and viewing
filters (Bowman, 2005).
1.1.4.2 Physical Enhancement
Physical methods of enhancement do not require chemical reactions and
involve the application of fine particles that have a physical affinity for the
fingermark residue, enabling their visualisation by creating a contrast against
enhancement include powdering, vacuum metal deposition (VMD) and small
particle reagent (SPR).
1.1.4.2.1 Powdering
Powdering is by far the most commonly employed method for developing latent
fingermarks because of its ease of use, speed and low cost, especially in situ at
a crime scene. If successful, powdering yields instantly visible fingermarks,
which can subsequently be recovered with an appropriate lifting tape, mounted
on a suitable surface to be photographed and then taken back to the laboratory
for further processing where required (Bowman, 2005). The procedure relies on
the mechanical adherence of the dusted powder to the aqueous and fatty
components deposited by the skin ridges. Therefore, extreme care is necessary
when dusting, as contact between the brush and the mark has an unavoidable
destructive effect (Lee and Gaensslen, 2001).
There are numerous powder formulations available that are deposition surface
specific (Sodhi and Kaur 2001; Liu etal., 2009), and include conventional (black,
white or coloured), aluminium, magnetic and fluorescent powders (Bowman,
2005). Recently proposed advances include the use of gold and silver
nanoparticles to enhance fingermarks on non-porous surfaces, with improved
development and contrast over conventional black powders (Choi et a/., 2007;
Choi et al., 2008) and silica nanoparticles with hydrophobic coatings
incorporating a variety of fluorescent dyes for fresh and aged fingermarks
(Theaker et al., 2008). Figure 1.6 shows photographs of latent fingermarks
developed on glass slides with rhodamine 6G incorporated nanoparticles, in (a)
Figure 1-6: Latent fingermarks developed on a glass slide by dusting with rhodamine 6G incorporated nanoparticles in (a) white light illumination and (b) UV illumination.
Image obtained from Theaker et al., (2008).
Despite the availability of some recent methodologies, powdering is often not
suitable to develop older fingermarks. The endogenous constituents present
within fingermark residues degrade over time, therefore, the constituents to
which the powders adhere may be no longer present. Furthermore if powdering
is used first, it may inhibit the effectiveness of subsequent development
techniques (Bowman, 2005).
1.1.4.2.2 Vacuum Metal Deposition
Vacuum metal deposition (VMD) was first described in 1968 for the
development of latent fingermarks on paper surfaces (Theys et al., 1968). The
technique was subsequently used for visualising latent marks on low density
polyethylene (polythene) (Kent et al., 1976). VMD is particularly effective for old
fingermarks, as well as ones that have been exposed to water. The
the necessary equipment, and the experience required to obtain fingermarks of
sufficient quality (Jones etal., 2001; Bowman, 2005).
VMD employs vacuum coating technology; a fine invisible coating of gold is
deposited onto the items being examined, which is followed by sufficient zinc to
enable a visible grey deposit to appear (Jones et al., 2001; Jones et al., 2012).
Zinc will only deposit on a non-metallic substrate providing the surface is
maintained at a low temperature, or on a nucleating layer of another metal that
has been deposited first. Although initially used for detecting latent marks on
smooth non-porous surfaces such as glass and plastics, VMD has recently
been employed to visualise fingermarks and grab impressions on fabrics as
demonstrated in figure 1.7 (Fraser et al., 2011).
' r M m if J j ’ I
] f f
4
f |
Figure 1-7: A 3 day old grab impression developed on nylon by Vacuum Metal Deposition (VMD).
Image obtained from Fraser et al., (2011).
1.1.4.2.3 Small Particle Reagent
Small particle reagent (SPR) consists of fine molybdenum disulphide (M0S2)
[image:45.614.172.406.342.553.2]fatty constituents of latent fingermarks, resulting in a grey deposit. SPR can be
applied to fingermarks on non-porous surfaces as either a spray or via dish
development (Polimeni et al., 2004; Cuce et al., 2004; Bowman, 2005). One of
the main advantages of SPR is its suitability to be applied to wetted surfaces,
although developed marks are easily damaged and should be lifted or
photographed immediately (Bowman, 2005). Recent advancements include the
development of white SPR and black SPR (Cuce et al., 2004), as well as
fluorescent variants, which further extend the applicability of the technique
(Jasuja et al., 2008). Figure 1.8 shows a fingermark developed on a glass slide
by cyano blue SPR after immersion in water for 96 hours.
Figure 1-8: A latent fingermark deposited on a glass slide and immersed in water for 96 hours before development by cyano blue Small Particle Reagent (SPR).
Image obtained from Jasuja et al. (2008).
1.1.4.3 Physical-chemical Methods
Physical-chemical methods of enhancement involve the initial physical
subsequently induces a chemical reaction. Some of the physical-chemical
methods employed today include cyanoacrylate fuming and iodine fuming.
1.1.4.3.1 Cyanoacrylate Fuming
Cyanoacrylate (superglue) fuming involves exposing fingermarks to
ethylcyanoacrylate (ECA) vapours in an enclosed heated chamber. It is ideally
suited to fingermarks deposited on a variety of non-porous surfaces such as
metals, plastics, vinyl and rubber (Bowman, 2005; Wargacki et al., 2007). The
cyanoacrylate monomer present in the ECA vapour polymerises to give the
white polycyanoacrylate deposits on the fingermark ridges, with limited polymer
depositing on the substrate (Lewis et al., 2001; Wargacki et al., 2007). The
polymerisation mechanism for ECA is shown in figure 1.9, although the exact
mechanism by which the polymer develops on fingermark residue remains
unclear (Bleay et al., 2012). Even though there are various chemical
constituents present in latent marks that are capable of initiating polymerisation,
it has been suggested that the primary initiator may be water (Paine et al.,
2011). Recent publications have concluded that a relative humidity of 80%
provides optimum results, when combined with rapid heating of cyanoacrylate
(Kent et al., 1990; Paine et al., 2011). Furthermore, staining with a fluorescent
dye such as Basic Yellow 40, followed by fluorescent examination maximises
Initiation
CN CN
OH* + CH2 = C * OH — CH2 — C*
COOC2H5 COOC2H5
Ethyl cyanoacrylate
Polymerisation
CN CN CN CN
OH— CH2— C* + CH2 = C ---► OH CH2— C— CH2— C*
COOC2H5 COOC2H5 COOC2H5 COOC2H5
Figure 1-9: The polymerisation mechanism for ethyl cyanoacrylate (ECA).
Figure obtained from Bleay et al. (2012).
1.1.4.3.2 Iodine Fuming
Although iodine fuming is one of the oldest fingermark development techniques,
it is rarely used today. Enhancement occurs when iodine crystals undergo
sublimation and iodine vapour is absorbed by the unsaturated lipid constituents
of latent fingermarks resulting in a yellow/brown image (Bowman, 2005). Iodine
fuming can be applied to fingermarks deposited on both porous and non-porous
substrates and the technique does not preclude the use of subsequent
visualisation techniques. On the majority of surfaces, fingermarks developed by
iodine fuming must be photographed immediately as they fade quickly unless
fixed with a-naphthoflavone, giving a dark blue image (Bowman, 2005).
Recently, iodine fuming was used to permanently develop both fresh and aged
eccrine and sebaceous fingermarks without background colouration, on some
types of thermal papers without any pre- or post-treatment of the substrate
(Jasuja and Singh, 2009). Figure 1.10 shows the fingermarks of two donors
Figure 1-10: Fingermarks from two donors deposited on glossy paper and developed using iodine fuming.
Image adapted from Bleay et al., (2012).
1.1.4.4 Chemical Enhancement
The last 25 years have seen great progress being made in fingermark detection
and development, particularly in the area of chemical enhancement for
fingermarks on a variety of substrates.
Chemical enhancement methods such as ninhydrin, DFO and 1, 2 indanedione
are primarily used on porous surfaces such as paper. These methods depend
upon the detection of amino acids present in fingermark residue. This is due to
the fact that amino acids have a strong affinity for paper fibres and therefore do
not readily migrate through such matrices (Jelly et al., 2009; Becue et al., 2010).
The usual protocol involves either dipping or spraying the item with a solution of
the amino acid reagent followed by heating. The resulting fingermark can then
be photographed to enable subsequent examination (Jelly et al., 2009).
1.1.4.4.1 Ninhydrin
Ninhydrin (2, 2-dihydroxy-1, 3-indanedione) was the first chemical enhancer to
(Oden and Von Hofsten, 1954). Siegfried Ruhemann initially synthesised
ninhydrin and determined its ability to react with amino acids in 1910, after he
observed a colour change when the reagent got on his skin. The subsequent
purple colour change is now commonly known as “Ruhemann’s purple”, (Almog
et al., 2000; Jelly et al., 2009; Becue et al., 2010). Figure 1.11 shows the generally accepted reaction mechanism between ninhydrin and amino acids to
form Ruhemann’s purple. Ninhydrin is still widely used as a fingermark
enhancer on porous surfaces, but one limitation is the poor contrast when
visualising marks developed on dark substrates. This problem has been
overcome by employing post-ninhydrin treatments incorporating metal salts. A
fluorescent coordination complex is formed in the reaction between
Ruhemann’s purple and the metal salts, and the colour observed depends on
the metal salt employed in the reaction (Becue et al., 2010).
OH OH
+ amino acid
- 2HjO, C02
^ NH
R + ninhydrin
> = N —
O
Ruhemann's puipie
Figure 1-11: The generally accepted reaction mechanism between ninhydrin and amino acids to form Ruhemann’s purple.
1.1.4.4.2 1, 8-Diazafluoren-9-one
1, 8-Diazafluoren-9-one (DFO), is a ninhydrin analogue which is another amino
acid reagent that has been utilised for visualising fingermarks on porous
surfaces, (Wilkinson, 2000; Jelly et al., 2009; Becue et al., 2010). The use of
DFO as a fingermark enhancing reagent was first reported in 1990 by Grigg and
Mongkolaussavaratana. The paper discussed the reaction of DFO with a-amino
acids, resulting in a red-coloured product that was highly fluorescent (Grigg and
Mongkolaussavaratana, 1990), which offers an advantage over ninhydrin, as
fluorescent results are achievable in one step rather than two. Figure 1.12
shows the proposed reaction mechanism between DFO and amino acids.
Figure 1-12: The proposed reaction mechanism between 1, 8, - Diazafluoren-9-one (DFO) and amino acids.
Figure obtained from Bleay et al. (2012).
Amino acid
1.1.4.4.3 1, 2-lndanedione
1, 2-lndanedione is another fingermark reagent that effectively enhances
fingermarks on porous substrates, resulting in pink fingermarks that are strongly
luminescent at room temperature. Furthermore, luminescence can be
substantially improved by the addition of zinc chloride to the working solution
prior to treating the substrate (Wallace-Kunkel et al., 2007). For this reason,
together with the faster enhancement time, 1, 2-lndanedione is replacing DFO
as the method of choice for fingermarks recovered from porous surfaces by
many forensic laboratories (Becue et al., 2010). Figure 1.13 shows fingermarks
developed on paper by 1, 2 - Indanedione and visualised in reflected and
fluorescent light.
Figure 1-13: Fingermarks developed on paper by 1, 2- Indanedione and imaged under (a) reflected light, and (b) fluorescent light
Image obtained from Bleay et al. (2012).
1.1.5 Analytical Techniques for the Analysis of Latent Fingermarks
Although there are numerous enhancement methods available, the need for
more efficient methods for the detection of latent fingermarks remains. A
number of analytical techniques have been used to aid fingermark ridge pattern
detection, whilst simultaneously providing information regarding the chemical
techniques are potentially useful in three ways: (1) to provide a more detailed
understanding of what constituents are present within aged fingermarks and
hence which method of enhancement would achieve the best result; (2) to
provide useful information such as the presence of exogenous compounds or
biomarkers, which may give some indications of the donor’s lifestyle or health
conditions respectively; (3) to provide an image of the fingermark for suspect
identification. These analytical techniques include: Raman spectroscopy (Day et
al, 2004a and 2004b; Went and West, 2008 and 2009), Attenuated Total
Reflectance - Fourier Transform Infrared (ATR-FTIR) Spectroscopy (Ricci et al,
2007a and 2007b), antibody-magnetic particle conjugates (Hazarika et al.,
2009; Boddis and Russell 2011), Gas Chromatography - Mass Spectrometry
(GC-MS) (Archer et al, 2005; Croxton et al, 2006; Croxton et al, 2010), Laser
Desorption/Ionisation Time-of-Flight Mass Spectrometry (LDI-TOF-MS)
(Emerson et al, 2011), Surface Assisted Laser Desorption Ionisation - Time-of-
Flight - Mass Spectrometry (SALDI-TOF-MS) (Rowell et al, 2009; Benton e ta l,
2010), Desorption Electrospray Ionisation - Mass Spectrometry Imaging (DESI-
MSI) (Ifa e ta l, 2008), Secondary Ion - Mass Spectrometry (SIMS) (Bright e ta l,
2012) and Matrix Assisted Laser Desorption Ionisation - Mass Spectrometry
Imaging (MALDI-MSI) (Wolstenholme et al, 2009).
1.1.5.1 Exogenous Compounds Present in Fingermarks
The majority of investigations into the presence of exogenous species have
focussed on drugs and their metabolites. Raman spectroscopy for example has
been used by various research groups to analyse the presence of drugs of
abuse within latent fingermarks. Day et al. (2004a) reported its use to detect five
drugs of abuse and five compounds, known to be common cutting agents,
(non-sebum enriched) and groomed (sebum loaded) fingermarks. The spectra
obtained from the "spiked" ungroomed fingermarks matched the corresponding
reference spectra, with no interferences from endogenous components,
therefore, enabling each of the ten compounds to be easily identified. The
Raman spectra of the “spiked” groomed (sebum-rich) fingermarks were of a
poorer quality, with higher background fluorescence due to the presence of
sebum. The same authors also reported the possibility of using Raman to detect
the same exogenous compounds within sweat rich fingermarks after
development by cyanoacrylate fuming (Day et al., 2004b). The authors stated
that although all ten compounds could be distinguished by their Raman spectra,
the background fluorescence was greater than in the reference spectra due to
the presence of the cyanoacrylate polymer and the intensities of the Raman
bands were poorer. Raman spectroscopy incorporating a confocal microscope
has also been employed to detect drugs of abuse and over the counter
analgesics in fingermarks, after dusting with powders and lifting with adhesive
tape or hinge lifters. Further analysis of the lifted fingermarks was carried out
without removing them from their evidence bags, with all the dopants identified
from their Raman spectra (West and Went 2008; West and Went 2009). More
recently, Surface Enhanced Raman Spectroscopy (SERS) has been used to
image the distribution of acetaminophen in a “spiked groomed fingermark after
deposition on a highly reflective slide (Connatser et al., 2010).
SALDI-TOF-MS has also been used to detect illicit drugs and their metabolites
in fingermarks after dusting with a silica powder and lifting. The technique
enabled mass spectra to be acquired showing the presence of codeine, cocaine,
diacetylmorphine, morphine, papaverine and noscapine within fingermarks, the
et al., 2009). SALDI-TOF-MS also enables images of analyte distribution to be obtained within fingermarks. However, at present, due to the very low spatial
resolution of the technology, the images of the ridge pattern are of insufficient
quality for identification purposes (Rowell etal., 2009; Benton etal., 2010).
One technique that is capable of producing high resolution images showing
clear ridge detail, as well as the distribution of drugs and drug metabolites within
latent fingermarks incorporates fluorescently tagged antibody-magnetic particle
conjugates (Hazarika etal., 2009; Boddis and Russell 2011; Boddis and Russell
2012). One of the benefits of the technique is the possibility to simultaneously
detect the presence of the drug as well as enabling the identity of an individual
to be ascertained, simply by application of the conjugated magnetic powder.
The antibody bound to the magnetic particles can be altered in order to detect
different illicit substances or their metabolites, based on the antigens present.
Thus the main disadvantage of the technique is that it is only feasible if prior
knowledge of the drugs involved is known.
Despite the advances made by the analytical techniques described above, the
analytes of interest were exogenous species, in particular drugs of abuse rather
than endogenous compounds. Although some of the techniques enable
fingermark images to be reconstructed, as well as providing potential forensic
evidence, valuable information will only be gained in the minority of cases
where these contaminants are actually present.
1.1.5.2 Endogenous Compounds Present in Fingermarks
Besides the detection of exogenous compounds, the endogenous chemical
analytical methods, some of them allowing images of endogenous constituents
to be obtained.
GC-MS has previously been employed to detect fatty acids and amino acids
within latent fingermarks (Archer etal., 2005; Croxton etal., 2006; Croxton etal.,
2010). Changes in the lipid composition have also been demonstrated by
Archer and colleagues (Archer et al., 2005) using GC-MS, who reported
substantial differences in the quantities of various fatty acids present in the
fingermarks obtained from five male donors, as well as differences over time,
thus supporting previous findings achieved by thin layer chromatography (TLC)
(Dikshitulu et al., 1986). Although both GC-MS and TLC are not imaging
techniques, the authors have stated the potential of the methodologies to
determine the age of a fingermark located at a crime scene from its chemical
composition, providing corresponding fingermarks can be obtained from a
suspect for comparison. However, as both GC-MS and TLC are destructive
techniques, they are unlikely to ever be applied on real crime scene samples.
A further analytical development has been the use of ATR-FTIR spectroscopic
imaging to obtain both chemical information and distribution images of
endogenous lipids and amino acids within latent fingermarks from various
donors (