A comparison of Lucene search queries evolved as text
classifiers
HIRSCH, Laurence <http://orcid.org/0000-0002-3589-9816> and
BRUNSDON, Teresa <http://orcid.org/0000-0001-5866-4326>
Available from Sheffield Hallam University Research Archive (SHURA) at:
http://shura.shu.ac.uk/22330/
This document is the author deposited version. You are advised to consult the
publisher's version if you wish to cite from it.
Published version
HIRSCH, Laurence and BRUNSDON, Teresa (2018). A comparison of Lucene
search queries evolved as text classifiers. Applied Artificial Intelligence, 32 (7-8),
768-784.
Copyright and re-use policy
See http://shura.shu.ac.uk/information.html
A comparison of Lucene search queries
evolved as text classifiers.
Laurence Hirsch and Teresa Brunsdon
Sheffield Hallam University
Abstract
In this article, we use a genetic algorithm to evolve seven different types of Lucene search query with
the objective of generating accurate and readable text classifiers. We compare the effectiveness of
each of the different types of query using three commonly used text datasets. We vary the number
of words available for classification and compare results for 4, 8 and 16 words per category. The
generated queries can also be viewed as labels for the categories and there is a benefit to a human
analyst in being able to read and tune the classifier. The evolved queries also provide an explanation
of the classification process. We consider the consistency of the classifiers and compare their
performance on categories of different complexities. Finally, various approaches to the analysis of
the results are briefly explored.
Introduction and background
Automatic text classification is the activity of assigning predefined category labels to natural
language texts based on information found in a training set of labelled documents. With the
explosive growth in online text, the task has become critical to many information management
tasks.
In the 1980s, a common approach to text classification involved humans in the construction of a
classifier, which could be used to define a particular text category. Such an expert system would
typically consist of a set of manually defined logical rules, one per category, of type
A DNF (“disjunctive normal form”) formula is a disjunction of conjunctive clauses. The document is
classified under a category if it satisfies the formula i.e. if it satisfies at least one of the conjunctive
clauses. An oft quoted example of this approach is the CONSTRUE system (Hayes et al. 1990), built
by the Carnegie Group for the Reuters news agency. A sample rule of the type used in CONSTRUE to
classify documents in the “wheat” category of the Reuters dataset is given below.
if((wheat & farm) or (wheat & commodity) or
(bushels & export) or (wheat & tonnes) or
(wheat & winter & ¬ soft))
then WHEAT
else ¬ WHEAT
Such a method, sometimes referred to as “knowledge engineering”, provides accurate rules and has
the additional benefit of being human understandable - that is, the definition of the category is
meaningful to a human, producing additional uses of the rule including category verification.
However, the disadvantage is that constructing the required rules requires significant human input
from both those with knowledge of the domain and of rule construction (Apt´e et al. 1994). Since
the 1990s, the machine learning approach to text categorisation has become dominant, requiring
only a set of pre-classified training documents and an automated classifier. A wide variety of
statistical classification systems have been developed, for example: Naive Bayes, k-nearest
neighbour, support vector machines (SVMs) and neural networks (Baharudin et al. 2010).
Probabilistic classifiers based on numerical models often require hundreds or thousands of features
and are not open to human interpretation or maintenance.
Human understandable classifiers
It has been recognised that classifiers that are comprehensible have certain advantages:
1. The classifier may be validated by a human.
2. The classifier may be fine-tuned by a human.
mining.
Accuracy and interpretability of classifiers are recognised as often being conflicting goals. As an
example, Oracle Corporation offer various options for classification in their Oracle Text1 product.
Two supervised classifiers are provided using user supplied training documents. The first uses SVM
technology and produces opaque classifiers with high accuracy. The second uses a decision tree to
produce classification rules which are transparent, understandable and modifiable by a human but
are recognised as having lower accuracy. This example clearly indicates that readability and
modifiability have value to commercial classification products and, where such features are required
as part of the classifier, some loss in accuracy is regarded as an acceptable trade-off for a more
comprehensible model. This has led to significant effort being given to developing human
interpretable classifiers, using techniques such as using automatic query generation
(Polychronopoulos et al. 2014).
Genetic Methods in Text Classification
Genetic Methods such as Genetic Programming (GP) and Genetic Algorithms (GA) are stochastic
search methods inspired by biological evolution. Genetic methods have been employed at various
stages of the text classification process (Espejo et al. 2010) - for example, in calculating useful term
weights (Escalante et al. 2015; Uysal and Gunal 2014; Baharudin et al. 2010). Luo (Luo and
Zincir-Heywood 2006) describes a system where recurrent linear GP is used to classify documents that are
encoded as word sequences. Genetic methods have also been used to induce rules or queries useful
for classifying online text (Smith and Smith 1997; Hirsch et al. 2007; Pietramala et al. 2008). In this
case, the evolution requires a fitness test based on some measure of classification accuracy. A
similar approach has been applied in an unsupervised context (Hirsch and Di Nuovo, 2017).
Proposed system
We propose a system to produce readable classifiers in the form of compact Apache Lucene search
queries containing a small number of words. A search query is generated for each of the categories
of the dataset such that each query is a binary classifier for that particular category. Thus, to classify
a document as belonging to a category we need simply to determine if the document is returned by
the search query. We evaluate the effectiveness of various evolved queries on 3 different text
datasets (see below) using a maximum of 4, 8 and 16 words per category. Fitness is accrued for
individuals producing classification queries which retrieve positive examples of the category but do
not retrieve negative examples from the training data. We use the ECJ
(http://cs.gmu.edu/~eclab/projects/ecj/) Java library for evolutionary computation in all the
experiments reported here.
Apache Lucene
Systems using methods based on Darwinian evolution are generally computationally intensive. In
our case, each individual in the population will produce a search query for each category of the
dataset and the fitness is evaluated by applying the search query to a potentially large set of text
documents. With a population of a reasonable size (for example, 1024 individuals) evolving over 100
or more generations it is critical that such queries can be executed in a timely and efficient manner.
For this reason, we decided to use Apache Lucene which is an open source high-performance,
full-featured text search engine. We use Lucene to build inverted indexes on the text datasets and to
execute the queries produced by the GA.
Pre-processing
Before we start the evolution of classification queries a number of pre-processing steps are made.
1. All the text is placed in lower case.
2. A small stop set is used to remove common words with little semantic weight.
Lucene fields) according to its category and its test or training status.
F1 Fitness
As mentioned above, each query is actually a binary classifier. That is, it will classify any document
as either in a given category or outside that category. The following measures are therefore useful:
Recall (r) = the number of relevant documents returned
the number of relevant documents (1)
precision (p) = the number of relevant documents returned
the number of documents returned
(2)
The F1 measure is also commonly used for determining classification effectiveness and has the
advantage of giving equal weight to precision and recall. F1 is given by:
𝐹1 = 2𝑝𝑟
𝑝 +𝑟 (3)
F1 also gives a natural fitness measure for an evolving classifier where documents in the training set
are the fitness cases. A similar approach is also taken in the Olex-GA (Pietramala et al. 2008) and
GPTC systems (Hirsch 2010). The micro-average is a global calculation of F1 regardless of category
and the macro-average is the average of F1 scores for all the categories.
F1 Word List
The total number of unique words in a document collection can be quite large. If each word were
given as a potential feature for a GA system, the size of the search space would become prohibitive.
We therefore use the following procedure to reduce the number of dimensions. For each category
of the dataset, an ordered list of potentially useful words is constructed which we call the
‘F1WordList’. Each word found in the relevant category of the training data is scored according to its
effectiveness as a single-term classifier for that category. So, for example, if we find the word “oil”
in the training data for a particular category, we construct a query based on the single word which
will retrieve all documents containing the word “oil”. We give the word a value (F1 score) as
from the training data. We can then create an F1WordList of length n for each category by simply
ordering the words according to their corresponding F1 values and selecting the top n words. In our
system, 300 words are available for classification purposes. A negative list, useful for queries
containing a NOT operator, is created by reversing the two sets such that a high scoring word will
retrieve few documents from the current category but a large number of documents from other
categories.
GA Parameters
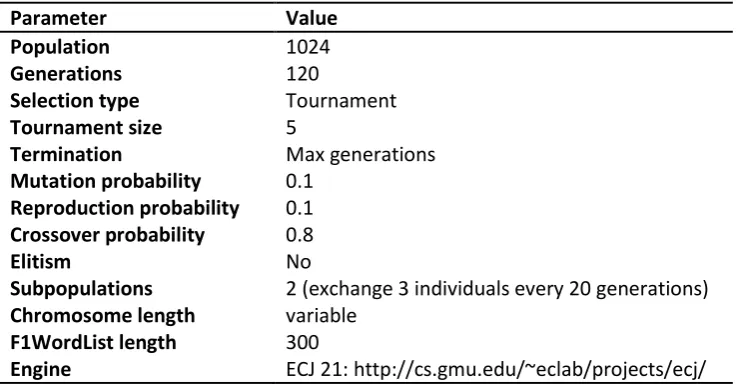
We used a fixed set of GA parameters in all our experiments and these are summarised in Table 1.
Subpopulations (island model) are used as a method of increasing diversity in the GA population.
Only limited communication (immigration/emigration) is allowed between subpopulations. In our
[image:7.595.67.439.406.601.2]case, we exchanged 3 individuals between the two subpopulations every 20 generations.
Table 1: GA Parameters
Parameter Value
Population 1024
Generations 120
Selection type Tournament
Tournament size 5
Termination Max generations
Mutation probability 0.1
Reproduction probability 0.1
Crossover probability 0.8
Elitism No
Subpopulations 2 (exchange 3 individuals every 20 generations)
Chromosome length variable
F1WordList length 300
Engine ECJ 21: http://cs.gmu.edu/~eclab/projects/ecj/
Experiments
In all the experiments reported here, the GA system only had access to the training data. The
evolution for each dataset was repeated 3 times. The final result was determined by applying the
best queries evolved to the test data. There were a number of objectives for the experiments:
2. To automatically produce compact and human understandable classifiers in search query
format using a small number of features.
3. To evaluate the classification effectiveness of a variety of Lucene query types.
Datasets
Three commonly used text datasets were used.
Reuters-21578 (R10)
Reuters-21578 news collection contains 21,578 news articles in 135 categories collected from the
Reuters newswire in 1987. In our experiments, we use the “ModApt´e split” - a partition of the
collection into a training set and a test set that has been widely adopted by text categorisation
experimenters. We use the top 10 (R10) most populous categories which is comprised of 9980 news
stories. The R10 is one of the most widely used text datasets in text classification research. An in
depth discussion of the Reuters dataset is given in (Debole and Sebastiani 2005).
WebKB
WebKB collected 8,282 web pages from computer science departments of several universities in
1997 by the Carnegie Mellon University Text Learning Group. Each page belongs to only one of
seven categories, though three are discarded following previous research. 4199 documents with
four categories remain: “Student”, “Faculty”, “Course” and “Project”. A test/train split is also defined
(Craven et al. 1998).
20 Newsgroup (20NG)
The 20 Newsgroups collection, set up by (Lang 1995) consists of 20,000 documents that are
messages posted to Usenet newsgroups, and the categories are the newsgroups themselves. We
use the training/test split from the website http://qwone.com/~jason/20Newsgroups/ . Some of
the newsgroups are very closely related to each other (e.g. comp.sys.ibm.pc.hardware /
The data in this set are considered particularly noisy and as might be expected they include
complications such as duplicate entries and cross postings.
Performance
Queries must be evolved for each category of the document set and each individual in the evolving
population must fire a Lucene query to obtain its fitness. All experiments were run on an Intel i5
3330 processor running at 3.00GHz with 8GB of memory. Such a system generated the classification
queries for the R10 dataset listed in Table 4 in just over 3 minutes. Considering the number of
queries and documents in the set, we would suggest that this result is a testament to the efficiency
of ECJ and Lucene. The result of all the training work is a set of search queries. To test the R10
classifier requires the execution of 10 search queries and the result will be delivered in a time frame
below human perception. The fact that search queries will scale up to large text databases, including
the web, is well known.
Query Types
A GA was used to evolve 7 different types of query for classification purposes. A full description of
the indexing system and query syntax is given at the official Lucene site (http://lucene.apache.org/ )
together with the Java source code and other useful information concerning Lucene. To help explain
the GA, let us assume that we are evolving a classifier for the R10 “crude” category. The first 8
words of the F1WordList are shown in Table 2. We explain the types of queries and how they are
combined. After each heading, we give the resulting query acronym in brackets.
Table 2: R10 Crude category F1WordList
OR (OR)
When the OR operator is applied to two or more words it is simply required that one of the words
occurs in a document for that document to be returned. Our results show that highly effective
classifiers can be evolved using OR queries which clearly achieve one of primary goals - namely to be
easily interpreted by a human. As mentioned above, as a pre-processing step for each category we
construct an F1WordList of 300 words which are likely to be useful for classifier query construction.
A 4 word query could be constructed from a randomly generated GA such as:
6 1 4 0
We create a Lucene Boolean query and add the term "barrels" from the list (in Lucene syntax using
BooleanClause.Occur.SHOULD ) and then repeat the process for the words "crude", "petroleum" and
"oil" as determined by Table 2. The query will then return documents which contain any of the 4
selected words and we can calculate the F1 fitness as determined by the number of relevant and
irrelevant documents returned.
AND (ANDOR)
Where words are joined by the AND operator in Lucene (BooleanClause.Occur.MUST), all the
words in the query are required to exist in a document for it be returned. It is unusual to evolve
classifiers that return more than a few documents for 3 or more words connected with AND in any
of the datasets we use. However, if we apply the OR operator on a number of two word AND
queries (a conjunction of disjunctions) then we can evolve effective classifiers, and this is the
approach taken here. For example, the following 4 word ANDOR query which was evolved on the
trade category of the R10 achieves an F1 score of 0.699 on the test set:
(+exports +trade) (+trade +u.s)
In Lucene syntax, “+” indicates that the word MUST occur for the document to be returned but since
there is an implicit OR between the two brackets, the query will return a document if it contains the
NOT (ORNOT together with SFNOT)
NOT on its own is not a useful operator but may improve classification effectiveness when combined
with others. We test NOT combined with a multi-word OR query and NOT combined with SpanFirst
(see below). The following example query gives an F1 of 0.683 for the category talk.politics.mideast
of the 20NG:
-code turkish israeli israel
where a minus sign in Lucene query syntax indicates that the word MUST NOT occur if the document
is to be returned. The query will return any document containing any of the words "turkish, israeli,
israel" but NOT containing the word “code”.
SpanFirst (SF)
A SpanFirst query restricts a query to search in the first part of a document, which is defined as some
number of words from the start. This appears to be useful since the most important information in a
document is often at the start of the text (Hirsch 2010). For example, to find all documents where
"barrel" is within the first 100 words we could use the Lucene query:
new SpanFirstQuery(new SpanTermQuery(new Term(“contents”, “barrel”)),100);
In this paper, we simplify the format and write the above as: (barrel 100). A more complex query
might be: (barrel 100) (oil 20) which would retrieve documents where the word “barrel” occurred
within the first 100 words of a document OR the word “oil” occurred within the first 20 words.
Using the F1WordList from Table 1, such a query could be defined using the following GA:
6 100 1 20
SpanNear (SN)
We use Lucene SpanNear to evolve queries that will match words occurring within 10 words of each
other. For example, the following query evolved on the R10 corn category (scoring F1 0.843 on the
test set) indicates that one of the word pairs in brackets must occur within 10 words of each other in
(corn usda 10) (tonnes maize 10) (u.s corn 10) (wheat corn 10)
The advantage of this query type is that it might capture multi-word units useful for classification
purposes.
MinimumNumberShouldMatch (MinShld)
A Lucene Query can be constrained to match at least a certain number of clauses. In our
experiment, we employ a specialised query which takes a given set of words and will only return a
document if at least two of the specified words occur in the document. For example, the following
query evolved to classify the comp.graphics documents of the 20NG, scoring F1: 0.422:
(polygon graphics image lines)~2
A document must contain at least two of the words listed in brackets before it is returned.
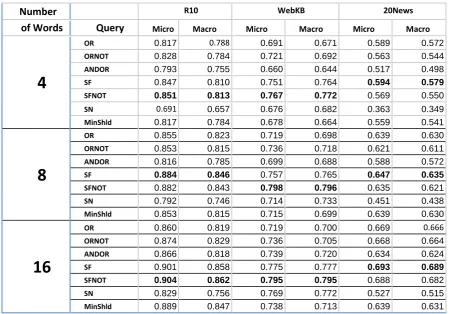
[image:12.595.68.525.424.738.2]Results
Table 3: Results Summary
Number R10 WebKB 20News
of Words Query Micro Macro Micro Macro Micro Macro
4
OR 0.817 0.788 0.691 0.671 0.589 0.572
ORNOT 0.828 0.784 0.721 0.692 0.563 0.544
ANDOR 0.793 0.755 0.660 0.644 0.517 0.498
SF 0.847 0.810 0.751 0.764 0.594 0.579
SFNOT 0.851 0.813 0.767 0.772 0.569 0.550
SN 0.691 0.657 0.676 0.682 0.363 0.349
MinShld 0.817 0.784 0.678 0.664 0.559 0.541
8
OR 0.855 0.823 0.719 0.698 0.639 0.630
ORNOT 0.853 0.815 0.736 0.718 0.621 0.611
ANDOR 0.816 0.785 0.699 0.688 0.588 0.572
SF 0.884 0.846 0.757 0.765 0.647 0.635
SFNOT 0.882 0.843 0.798 0.796 0.635 0.621
SN 0.792 0.746 0.714 0.733 0.451 0.438
MinShld 0.853 0.815 0.715 0.699 0.639 0.630
16
OR 0.860 0.819 0.719 0.700 0.669 0.666
ORNOT 0.874 0.829 0.736 0.705 0.668 0.664
ANDOR 0.866 0.818 0.739 0.720 0.634 0.624
SF 0.901 0.858 0.775 0.777 0.693 0.689
SFNOT 0.904 0.862 0.795 0.795 0.688 0.682
SN 0.829 0.756 0.769 0.772 0.527 0.515
MinShld 0.889 0.847 0.738 0.713 0.639 0.631
queries using each of 4, 8 and 16 words, with the best results displayed in bold. Some conclusions
can be drawn:
1. SF (SpanFirst) queries produce the most accurate classification queries for all datasets and query
sizes.
2. NOT can improve classification accuracy in some cases but the effect is generally quite marginal.
3. SN (SpanNear) (which is a special type of AND) is generally the worst performing classifier.
4. Simple OR queries are more effective classifiers than a combination of two word AND queries.
5. MinShld (MinimumShouldMatch) is an interesting variant on OR and AND and performs slightly
better than AND.
The results above were found by averaging the F1 scores (micro and macro) for each query type,
number of words and data source combination. This averaging is over the three repetitions and over
all categories in each of the data sources. However, this loses much of the information in the
results. For example, how consistent are the queries? Are there some categories that are “hard” to
correctly identify and for which a particular query type is successful? Such sentiments have been
pointed out before (van Rijsbergen 1979) and (Goutte and Gaussier 2005).
A classical statistical ANOVA of the results has been successfully carried out in other studies, for
example, (Lennon et al. 2013) and (Phachongkitphiphat and Vateekul 2014). The former fit
models to Precision, Recall and F1 by first employing the arcsine square root transformation. A
similar attempt was made here, employing a variety of transformations, and even the Beta
Regression approach of (Cribari-Neto and Zeileis 2010). However, the resulting analyses required
all the higher interaction terms, making any interpretation difficult, and the residuals had a highly
leptokurtic distribution questioning the validity. This was mainly due to some extreme residuals
coupled with others at or near zero.
Such non-normality of experimental results in the context of information retrieval and classifiers is
well established (e.g. (van Rijsbergen, 1979 chapter 7, and (Demšar 2006) ).  (Demšar 2006)
assumption that all classifications are independent and that the underlying distribution of the metric
is symmetric. Given that the results here come from just three data sources, the first of these is
unlikely. Also, since there are only three replicates, the second is not possible to ascertain. (van
Rijsbergen 1979) suggests that the use of a non-parametric test may be performed to provide a
conservative result. Consequently, the results were analysed using SAS statistical software and
non-parametric Cochran-Mantel-Haenszel tests were performed using the rank option in PROC FREQ,
making these tests equivalent to the Friemann test, but controlled over relevant sub-groups. Two
tests were performed on the F1 measures, one comparing the 7 Query types while controlling for
the number of words and category within each data source, and the second on the number of words
while controlling for the Query Types and categories. These gave statistically significant results
beyond even the 0.01% significance level. Hence, this suggests that, even being conservative, the
differences between Query types and between number of words are genuine.
The failure of the statistical modelling approach means that to understand the true pattern of the
F1, recall and precision results, we must drill into the data in other ways, achieved here by plotting
the data at various levels of granularity.
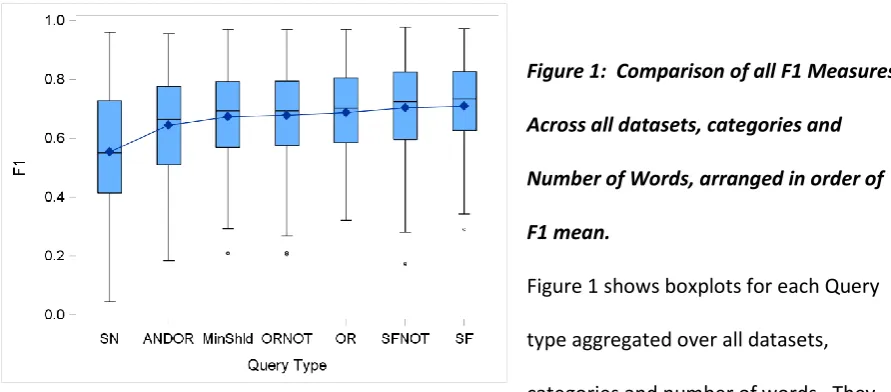
Initially, the classifiers are compared by plotting boxplots for each Query type using all instances in
[image:14.595.73.519.527.723.2]the data so that each box has values from all three datasets, all categories and all number of words.
Figure 1: Comparison of all F1 Measures
Across all datasets, categories and
Number of Words, arranged in order of
F1 mean.
Figure 1 shows boxplots for each Query
type aggregated over all datasets,
categories and number of words. They
in the table above. However, it should be noted that all the boxes overlap, so alternative ranking of
queries may be reasonable for some combinations of category and number of words. The range
and interquartile range for each query are quite large compared to the bounds on F1 (0 F1 1),
showing quite varied success of the classifiers. SpanNear10 is the most dispersed having the
longest whiskers (largest range) and a longer box (largest interquartile range).
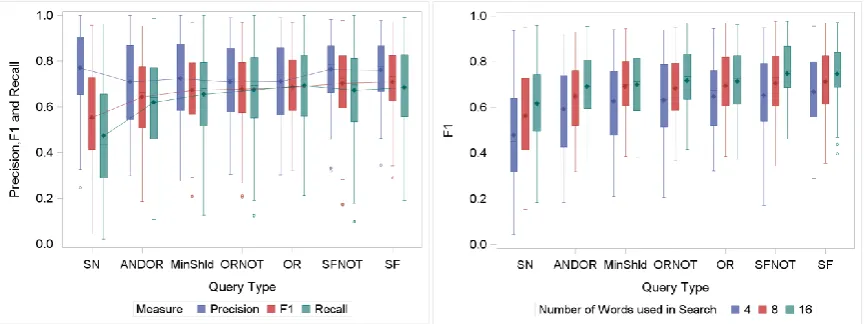
The precision and recall are included in the left plot of Figure 2. From this plot, it can be seen that
while SpanNear10 has the lowest F1 on average, it also appears to have the best precision, although
the other query types do not lag far behind. This is off-set by its very poor recall. All the other query
types have less of a disparity between recall and precision. We may presume that this indicates that
two word units may be good indicators of category membership when they are found but do not
occur with sufficient frequency across all documents to achieve high accuracy when measured by F1.
The optimum recall for the other queries is OR slightly ahead of SpanFirst. This might also be
[image:15.595.76.509.422.584.2]expected, since the requirement of SpanFirst is more exacting than OR.
Figure 2: Comparison of F1, Recall and Precision across all datasets, categories and number of
words (left) together with comparison of all F1 Measures across all datasets and categories by
number of words (right). Both arranged in order of F1 mean.
The results for the different number of words as well as query type plots are shown in the right of
Figure 2. In general, F1 increases with the number of words but not dramatically, nor by the same
MinShould. Dispersion also tends to be lower with more words, again with MinShould being the
notable exception. This may be a result of the way the query works, in that extra words can be
added without necessarily making a substantial change to the set of documents returned. This
reduction in the dispersion of the F1 measures is more notable using 8 rather than 4 words; 16
makes relatively less difference. Thus, the goal of making queries more interpretable by using fewer
[image:16.595.76.488.233.686.2]words can be achieved with little reduction in effectiveness.
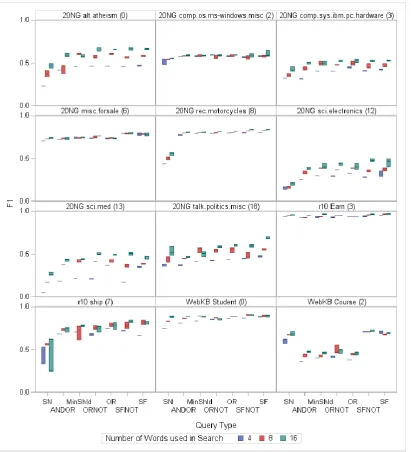
Figure 3: Box-plots of F1 for each Category, Number of words and Query type for a selection of
categories and Sources. Note that as this is based on only three data points, the top of the box will
Figure 3 shows a selection of the individual boxplots at the most granular level, for each category,
number of words and query type separately. Categories 1,3 and 9 in the R10 dataset (only category
3 is shown) have high F1 values across the board, showing that these categories are “easier” to
classify. Such “easy” categories also tend to be more consistent (all three runs gave similar results so
that the boxes are small). Further examples are 6 and 8 in 20 NG, and 0 in WebKB. Low F1 measures
such as for categories 12,13 and 19 in the 20NG source (19 not shown) illustrate “hard” categories
that are also more dispersed. SpanNear10 (SN) usually is the lowest F1 measures and ANDOR often
has the second lowest. For “easy” categories, this usually no longer holds with ANDOR performing
equally well and sometimes also SpanNear10 (e.g. category 3 in R10).
There are examples and counterexamples where the number of words makes quite a difference in
mean F1 (13 vs 2 in 20NG for example). More words also tend to make the results more varied,
although there are exceptions such as 0,3 and 18 20NG (8 more varied than 16). Two categories give
unique results: category 2 in WebKB shows SpanNear10 outperforming all but the two SpanFirst
Queries with all other queries performing badly. Category 7 in R10 shows greater dispersion,
particularly for SpanNear10. A detailed study of the relationship between the categories and the
results for different query types could prove a fruitful area of research, by, for example, identifying
in which circumstances two word units may be useful for classification.
Readability
Creating compact classifiers that are human readable is one of the main objectives of this work. We
give some examples of evolved classifiers in Table 4 and Table 5. Although unexpected terms
sometimes appear, the queries generated are quite readable and, critically, offer an explanation of
how the classifier works. Note that in the case of SpanFirst, we have ordered the query terms by the
a word must appear for the document to be returned. So for example "oil" may occur in many
documents outside the crude category but is unlikely to occur within the first 27 words of a
document not in that category (Table 4). We also note that the query evolved for the wheat
category (F1 of 0.893) outperforms the human constructed rule discussed in the introduction (F1 of
[image:18.595.69.546.256.434.2]0.84) and is arguably more readable, using only three words.
Table 4: R10 SpanFirst with 8 words
Category F1 Query
Acq 0.835 (acquired 48)(offer 124)(merger 146)(sell 147)(stake 186)(acquire 188)(sells 237)(acquisition 240)
Corn 0.876 (soybean 36)(corn 231)(cordoba 241)(maize 248)(belt 291)
Crude 0.829 (oil 27)(refinery 49)(crude 52)(gasoline 87)(petroleos 87)(opec 159)(barrels 258)(barrel 284)
Earn 0.967 (split 41)(profit 44)(net 46)(earnings 47)(loss 86)(vs 115)(results 227)(dividend 289)
Grain 0.97 (corn 97)(cereals 108)(rice 132)(wheat 141)(crop 179)(barley 200)(grain 206)(maize 280)
Interest 0.747 (leaves 4)(deposit 21)(discount 22)(room 24)(rate 29)(rates 31)(repurchase 78)(money 84)
Money-fx 0.798 (yen 15)(dollar 45)(money 58)(currency 71)(cooperate 90)(currencies 171)(fed 191)(monetary 201)
ship 0.793 (port 58)(strike 62)(shipping 75)(tankers 96)(vessels 187)(freights 234)(ships 287)(vessel 297)
trade 0.746 (payments 6)(account 22)(trade 29)(sanctions 36)(retaliation 139)(textiles 221)(protectionism 253)(tariffs 295)
wheat 0.893 (commodity 4)(temperatures 53)(wheat 204)
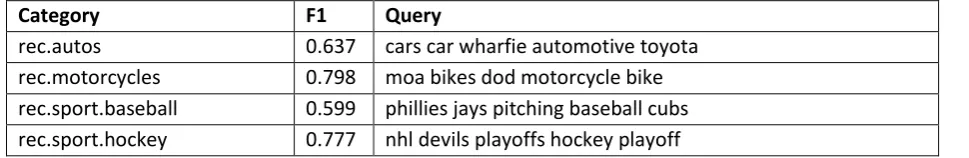
Table 5: 20NG OR with 4 words (showing only the rec category)
Category F1 Query
rec.autos 0.637 cars car wharfie automotive toyota rec.motorcycles 0.798 moa bikes dod motorcycle bike rec.sport.baseball 0.599 phillies jays pitching baseball cubs rec.sport.hockey 0.777 nhl devils playoffs hockey playoff
Future work
The current system produces binary classifiers that simply indicate whether a document is contained
within a particular category. Indexing systems such as Lucene incorporate complex and highly
efficient scoring systems so that the set of documents matching a query are ranked according to
some measure of closeness to the query. We believe that this could be incorporated into the fitness
test in order to enhance classification accuracy. We are also working on developing an unsupervised
[image:18.595.63.548.485.564.2]documents. In addition, we believe that there is a need to drill into results as this can show the
consistency of classifiers and aid in our understanding of when and why one works over another. It
is hoped to revisit the statistical modelling approach of the experiments conducted here to find a
more suitable way to quantify this.
Conclusion
We have evolved a number of classifiers using queries of 16 or fewer words for each category of the
dataset. The queries produced are readable and compact. Surprising levels of classification accuracy
can be achieved using only 4 words and a simple OR based query, whereas AND type queries are less
accurate. There are obvious advantages to the query format of the classifiers as they are ready to
apply to large text datasets and are in a format that can be easily refined or tuned by a human
analyst. These simple queries are also surprisingly consistent, even for categories that are “hard” for
the algorithm to get right.
References
Apt´e, C., F. J. Damerau, and Weiss, S. M. “1994. Automated learning of decision rules for text
categorization. .” ACM Trans. on Inform. Syst. 12, 3, 1994.
Baharudin B., Lam, H. L., Khairullah K. “A review of machine learning algorithms for text-documents
classification.” Journal of advances in information technology, 2010.
Craven, Mark, Andrew McCallum, Dan PiPasquo, Tom Mitchell, and Dayne Freitag. “ Learning to extract symbolic knowledge from the World Wide We.” Proceedings of AAAI. , 1998.
Cribari-Neto, Francisco, and Achim Zeileis. “Beta Regression in R.” Journal of Statistical Software 34 , no. 2 (2010): 1–24.
Debole , F, and F Sebastiani. “An analysis of the relative hardness of Reuters‐21578 subsets.” Journal of the American Society for Information Science and technology 56.6, 2005.
Demšar, Janez. “Statistical Comparisons of Classifiers.” Journal of Machine Learning Research, 2006: 1-30.
F., & Martínez-Carranza, J. “Term-weighting learning via genetic programming for text
classification.” Knowledge-Based Systems, 83, 2015: 176-189.
Espejo P., Ventura S. and Herrera F. “A survey on the application of genetic programming to classification.” Systems, Man, and Cybernetics, Part C: Applications and Reviews, IEEE Transactions on 40.2 , 2010: 121-144.
Garcia, Salvador, Aberto Fernández, Julián Luengo, and Francisco Herrera. “Advanced nonparametric
tests for multiple comparisons in the design of experiments in computational intelligence and data mining: Experimental analysis of power.” Information Sciences 180 (2010): 2044-2064.
Goutte, Cyril, and Eric Gaussier. A probabilistic Interpretation of Precision, Recall and F-score, with Implication for Evaluation. Vol. 3408, in Advances in Information Retrieval, by David E. Losada and Juan M. Fernández-Luna, edited by David E. Losada and Juan M. Fernandez-Luna, 345-359. Berlin Heidelberg New York: Springer, 2005.
Hayes, Philip J, P Stevensen, and Weinstein. “CONSTRUE/TIS: A System for Content-Based Indexing of a Database of News Stories.” IAAI, vol. 90, 1990: 49-64.
Hirsch, Laurence. “Evolved Apache Lucene SpanFirst queries are good text classifiers.” Evolutionary Computation (CEC), IEEE Congress on. Barcelona, 2010.
Hirsch, Laurence, and Alessandro Di Nuovo. “Document Clustering with Evolved Search Queries.” Evolutionary Computation (CEC), IEEE Congress on. Donostia - San Sebastián, 2017.
Hirsch, Laurence, Robin Hirsch, and Masoud Saeedi. “Evolving Lucene search queries for text classification.” In Proceedings of the 9th annual conference on Genetic and evolutionary computation. London: ACM, 2007. 1604-1611.
Kutner , Michael H., Christopher J Nachtsheim, John Neter, and William Li. Applied Linear Statistical Models, 5 edition. McGraw-Hill Higher Education, 2004.
Lang, K. “Newsweeder: Learning to filter netnews.” Proceedings of the Twelfth International Conference on Machine Learning. 1995.
Lennon, Craig, et al. Performance Evaluation of a Semantic Perception Classifier. Adelphi: Army Research Laboratory, 2013.
Luo, x, and A Zincir-Heywood. “Evolving Recurrent Linear-GP for Document Classification and Word
Tracking.” CEC 2006. IEEE Congress on. IEEE. 2006.
Özel , S. “A Web page classification system based on a genetic algorithm using tagged-terms as
features.” Expert Systems with Applications 38.4, 2011: 3407-3415.
Phachongkitphiphat, N, and P Vateekul. “An improvement of flat approach on hierarchical text
classification using top-level pruning classifiers.” International Joint Conference on Computer Science and Software Engineering. 2014. 86-90.
Induction.” Proc. European Conf. Machine Learning and Principles and Practice of Knowledge Discovery in Databases (ECML/PKDD ’08). 2008. 188-203.
Polychronopoulos , Vassilis , Nick Pendar, and Shawn R Jeffery. “QuIET: A text classification technique using automatically generated span queries.” Semantic Computing (ICSC), IEEE International Conference on, . IEEE. 2014. 52-59.
Smith, M. P., and M. Smith. “The use of genetic programming to build Boolean queries for text retrieval through relevance feedback.” Journal of Information Science, 23(6), 1997: 423-431.
Uysal, A. K., & Gunal, S. “Text classification using genetic algorithm oriented latent semantic
features.” Expert Systems with Applications, 41(13), 2014: 5938-5947.