BOYLAN, Mark <http://orcid.org/0000-0002-8581-1886>, DEMACK, Sean,
WOLSTENHOLME, Claire, REIDY, John and REANEY, Sarah
Available from Sheffield Hallam University Research Archive (SHURA) at:
http://shura.shu.ac.uk/23758/
This document is the author deposited version. You are advised to consult the
publisher's version if you wish to cite from it.
Published version
BOYLAN, Mark, DEMACK, Sean, WOLSTENHOLME, Claire, REIDY, John and
REANEY, Sarah (2018). ScratchMaths: evaluation report and executive summary.
Project Report. Education Endownment Foundation.
Copyright and re-use policy
See
http://shura.shu.ac.uk/information.html
Evaluation report and executive summary
December 2018
Independent evaluators:
The Education Endowment Foundation (EEF) is an independent grant-making charity dedicated to breaking the link between family income and educational achievement, ensuring that children from all backgrounds can fulfil their potential and make the most of their talents.
The EEF aims to raise the attainment of children facing disadvantage by:
identifying promising educational innovations that address the needs of disadvantaged children in primary and secondary schools in England;
evaluating these innovations to extend and secure the evidence on what works and can be made to work at scale; and
encouraging schools, government, charities, and others to apply evidence and adopt innovations found to be effective.
The EEF was established in 2011 by the Sutton Trust as lead charity in partnership with Impetus Trust (now part of Impetus - Private Equity Foundation) and received a founding £125m grant from the Department for Education.
Together, the EEF and Sutton Trust are the government-designated What Works Centre for improving education outcomes for school-aged children.
For more information about the EEF or this report please contact: Danielle Mason
Head of Research
Education Endowment Foundation 9th Floor, Millbank Tower
21–24 Millbank SW1P 4QP p: 020 7802 1679
About the evaluator
The project was independently evaluated by a team from Sheffield Hallam University: Professor Mark Boylan, Sean Demack, Claire Wolstenholme, Dr John Reidy, Sarah Reaney-Wood, Professor Hilary, Povey, Ian Guest and Anna Stevens supported by Martin Culliney and CDARE administrators Chris Roffey of Bebras/Beaver UK provided information on scoring used in the Code Club evaluation.
The lead evaluator was Professor Mark Boylan. Contact details:
Professor Mark Boylan
Sheffield Institute of Education, Sheffield Hallam University City Campus, Howard Street, Sheffield S1 1WB, UK Email: [email protected]
Contents
Executive summary ... 4
Introduction ... 6
Methods ... 17
Impact evaluation ... 33
Process evaluation ... 48
Conclusions ... 63
References ... 72
Appendix A: EEF cost rating ... 75
Appendix B: Security classification of trial findings ... 76
Appendix C: ScratchMaths content and ScratchMaths team theory of change 77
Appendix D: Consent forms and MoUs ... 79
Appendix E: Detail of team roles ... 85
Appendix F: Computational thinking test - development and analysis ... 87
Appendix G: Distribution of primary outcome (overall K2 maths attainment,
2017) and follow-on secondary outcomes (attainment in the three KS2 maths
papers, 2017) ... 102
Appendix H: Distribution of interim secondary outcome (Computational thinking
test, 2016) ... 105
Appendix I: Multilevel analyses & calculation of effect sizes ... 107
Appendix J: Process evaluation samples and data consolidation ... 110
Appendix K: Fidelity to ScratchMaths & the on-treatment analysis ... 113
Executive summary
The project
ScratchMaths is a two-year computing and mathematics curriculum designed for pupils aged nine to eleven years old, supported by teacher professional development (PD). The programme uses Scratch, a free online programming environment, to integrate coding activities into mathematical learning. Year 5 and 6 teachers or computing teachers received two full days of training in the summer term before using materials the following academic year. In this project, Y5 teachers could also access two optional half-day sessions and Y6 teachers had the opportunity to attend an optional, further half-day of training and an online webinar. Pupils were expected to be taught ScratchMaths for at least one hour every fortnight and were expected to have access to at least one computer for every two pupils to access the online activities. ScratchMaths was developed and delivered by the UCL Knowledge Lab.
This school-level randomised controlled trial measured the computational thinking scores of pupils after one year of the intervention, and Key Stage 2 maths scores after two years. 110 schools were involved at the start of the trial. An implementation and process evaluation consisted of visits to professional development events, telephone interviews, teacher surveys, and review of project data and materials. The trial ran between April 2015 and June 2017.
EEF security rating
These findings have a very high security rating. This was an efficacy trial, which tested whether the intervention worked under developer-led conditions in a number of schools. The trial was a well-designed two-armed randomised controlled trial. The trial was well powered and relatively few (7%) pupils who started the trial were not included in the final analysis. The pupils in ScratchMaths schools were similar to those in the comparison schools in terms of prior attainment.
Additional findings
This evaluation found no evidence that the ScratchMaths intervention had an impact on pupil KS2 Maths attainment, measured at the end of Year 6. There was, however, a positive effect on computational thinking test scores at the end of Year 5, Exploratory analysis suggested that the size of this effect was larger for pupils who had ever been eligible for free school meals (everFSM), but did not differ between
Key conclusions
1. There is no evidence that ScratchMaths had an impact on pupils’ KS2 maths outcomes. This result has a very high security rating.
2. Children in ScratchMaths schools made additional progress in computational thinking scores at the end of Year 5, compared to children in the other schools. The additional progress was higher for children who have ever been eligible for free school meals.
3. Many schools did not fully implement ScratchMaths, particularly in Year 6. High fidelity to the intervention was found in 44% of schools in Y5 and 24% in Y6. Implementation was enhanced where schools provided teachers with time to work through materials.
4. Teachers viewed ScratchMaths as a good way of addressing aspects of the primary computing curriculum, good for improving Scratch programming skills, good professional development, and good for its high quality materials. Five teachers voiced concerns that the lower-attaining pupils needed additional support or adaptation of materials to fully access all ScratchMaths content. 5. Participation in professional development and the use of materials is potentially a very low-cost
boys and girls. This second finding is of interest as previous research has suggested that the impact of programming interventions can differ between genders.
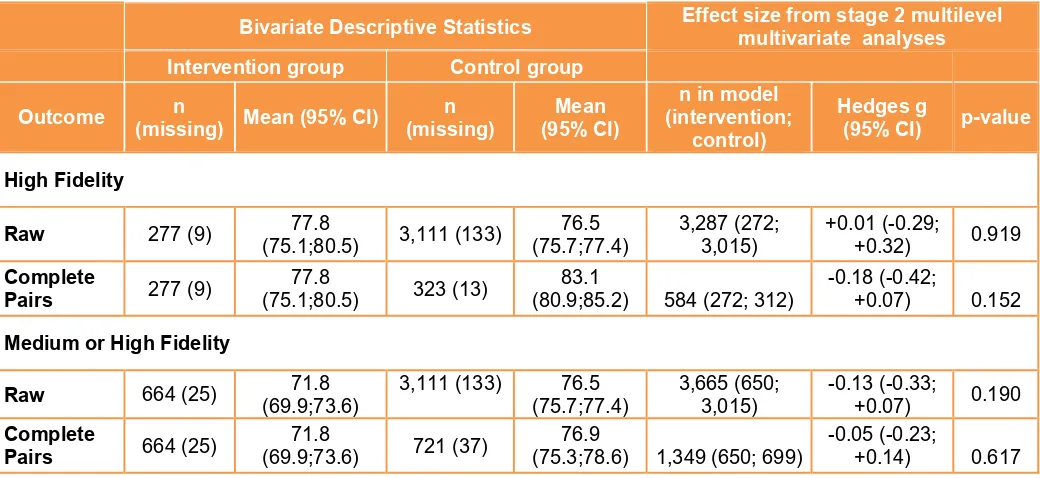
There is evidence of poor implementation in intervention schools, particularly in Year 6. High fidelity to the programme was found in 44% of Year 5 and 24% of Year 6 classes. The process evaluation found that teacher attendance of training sessions, time spent teaching ScratchMaths and use of ScratchMaths materials all decreased between Year 5 and 6. 69% of survey responses from Year 6 teachers identified pressures around SATs as a barrier to implementation. Other reported barriers included the confidence and turnover of staff and the level of challenge of materials for the children. Exploratory analysis examined the impact of ScratchMaths only in those schools which delivered it with high or medium fidelity to the intervention but even for these schools no impact was found.
Teachers who sustained participation in terms of attendance and use of Scratch materials in accordance with trial protocols, were, in general, positive about the quality of the professional development and materials provided, particularly in Y5. Implementation was enhanced where schools provided time for teachers to work through materials. This was particularly so for teachers who were less familiar or unfamiliar with Scratch. It was also enhanced if schools showed a willingness to support computing teaching in Y6 despite the pressure of maths and English KS2 test requirements.
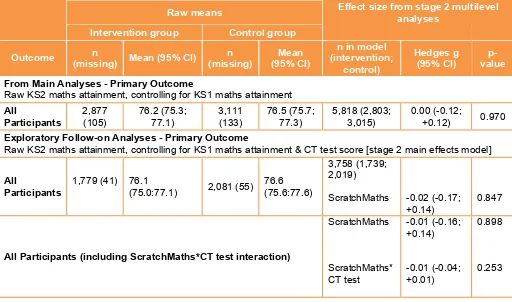
One of the issues explored as part of this evaluation was the relationship between computational thinking and mathematics attainment. The rationale of the programme is that improved computational thinking scores combined with teacher mediation (through the intervention) can lead to improvements in mathematics outcomes. However, although computational thinking scores did improve, it does not appear that the teacher mediation improved the translation of these skills into maths attainment: no evidence was found that the relationship between computational thinking and KS2 maths attainment was stronger within the schools that received ScratchMaths.
Cost
The average cost of ScratchMaths for one school was around £1,843, or £11 per pupil per year when averaged over 3 years. This does not include staff cover costs for the two days of professional development each participating teacher is required to attend each year. Future costs could be reduced by using local delivery partners for training instead of the single delivery partner in this trial (based at the UCL Institute of Education in London).
Table 1: Summary of impact on primary outcome
Outcome
Effect size (95% confidence
interval)
Estimated months’ progress
EEF security
rating
No. of
pupils P value
EEF cost rating
KS2 maths 0.00
(-0.12; +0.12) 0 5,818 0.970 £££££
KS2 maths (everFSM)
+0.01
Introduction
The intervention
Intervention description
ScratchMaths is a two-year computing and mathematics curriculum programme designed for pupils aged nine to 11 years, supported by teacher professional development. The ScratchMaths programme aims to address one difficulty many children have in learning mathematics - the need to express mathematical ideas in formal language. The development team’s rationale for the ScratchMaths programme is in part to respond to that challenge, by finding a different language – and set of ideas and approaches - that are more open, more accessible and more learnable. At the same time, they sought to achieve this aim without sacrificing the rigour that makes mathematics work. Their hypothesis is that the language of programming can fulfil this role for pupils, providing that they work on carefully designed tasks and activities, and a teacher is able to support them.
In Year 1, the programme aims to enhance Scratch programming skills and computational thinking with connections made to areas of mathematics, and the materials and activities (detailed below) are geared towards that goal. Scratch is a freely available programming language, developed for educational purposes. It uses a visual interface and drag-and-drop tools. In the second year, as well as activities to develop computational thinking and Scratch programming, the content of materials also supports mathematical thinking more directly, through engagement with specially designed ScratchMaths curriculum activities and tasks linking programming to mathematical reasoning and understanding. Materials are aligned with both the Primary Computing (DfE 2013) and Primary Mathematics national curricula (DfE, 2014).
Teachers in the schools involved were offered 2.5 days of professional development per year.
The intervention was developed in 2014/15 during a 'design year' (see below). During the trial, Y5 teachers in participating schools- designated as 'Wave 1' - attended initial professional development in summer 2015 and the taught ScratchMaths to Y5 pupils in 2015/16. Y6 pupils attended professional development in 2016 and taught materials to Y6 pupils in 2016/17.
In addition, during 2016/17, in accordance with a waitlist design, Y5 pupils in control schools experienced ScratchMaths; these were designated Wave 2 schools.
The theory of change
The three figures below depict a theory of change in relation to the proposed intervention effect.
Figure 1 represents a simplified model of the hypothesised relationship between ScratchMaths, programming, mathematical thinking and KS2 mathematics attainment at the pupil level. Computational thinking, rather than programming and computing in general, is posited as the intermediate link between ScratchMaths and changes in mathematical thinking1, thus an explicit focus on computational thinking
informed the research questions and design. In any case, computational thinking and programming are generally considered as interlinked (see Brennan and Resnick, 2012; Selby, Dorling and Woollard, 2014; Meerbaum-Salant et al., 2013).
1 See the evaluation protocol
Figure 1: ScratchMaths and student learning
A revised version of the theory of change was proposed by the ScratchMaths team during the third year of the trial see Appendix C, figure 102. This revision suggested that the intermediate outcome is
computing in general rather than computational thinking specifically.
A critical feature of the theory of change is the importance of teacher mediation. Whilst engagement in Scratch programming may lead to improvements in computational thinking, the direct effect on mathematical thinking may be relatively weak. The ScratchMaths team also believe that, in general, enhancing mathematical thinking depends on teacher mediation and that ScratchMaths is no exception. For learning to happen, the teacher helps learners to make connections between computational thinking, Scratch programming and mathematics. Underlying the intervention design, teacher mediation is essential to foster learners’ expression of mathematical thinking in the language of Scratch. The project design is focused on developing mathematical thinking, which is one aspect of the capacities and knowledge that are assessed through KS2 mathematics tests.
In addition to the posited theory of change in Figure 1, the ScratchMaths team also suggested a potential direct effect on KS2 mathematics (see evaluation protocol page 4). In discussion with the ScratchMaths team about the mathematical test used as a final measure, reference was made to the content of the 2017 KS2 maths test, the 2016 KS2 maths test and ScratchMaths content. ScratchMaths addresses or uses specific mathematics content and context, for example regarding angles. Thus, it might be expected that ScratchMaths would enhance learners’ attainment in these specific content areas by providing opportunities for learners to explore specific concepts and to practise their existing knowledge in computing contexts. These effects would supplement any change in computational thinking or related mathematical thinking.
Figure 2 is a model of how the professional development and curriculum materials create the ScratchMaths learning environment and may lead to teacher change.
2 In keeping with EEF guidance, the theory of change developed during the evaluation design is included in the
Figure 2: ScratchMaths as a professional learning system
Figure 3: Implementation theory of change
Inputs
Outputs
Outcomes - Impact
Activities &
Participation
Short
Medium
Long
ScratchMaths PD - Two days Summer PD
ScratchMaths materials
ScratchMaths additional half-day PD
Ad hoc ScratchMaths local coordinator / ScratchMaths team support
Website, discussion boards etc. School inputs as in MoU, e.g. computers, timetabling
Expected
Teachers attend Summer PD Teachers use core materials from investigations
Pupils are taught ScratchMaths at least one hour per fortnight following the order specified
Pupils have access to computers at minimum ratio of 1:2
Optional/additional
Teachers attend half-day PD Teachers participate in discussion boards Teacher professional learning Knowledge of computing and specifically Scratch Ability to teach computing, Scratch and ScratchMaths
Measured outcomes Increase in CT Increase in KS2 mathematics attainment Other outcomes Increase in Scratch skills
Positive pupil affect re computing and/or mathematics Teacher Computing and mathematics pedagogical knowledge, pedagogical content knowledge, content knowledge and skills Enhanced capacity to teach Scratch & programming Pupil
More engaged with computing and mathematics in the future
Assumptions
External Factors The programme theory of change models the relationship
between ScratchMaths, computational thinking and mathematical attainment.
Schools follow protocol/memorandum of understanding re: who teaches ScratchMaths and who engages with PD.
Schools’ capacity to participate (e.g. teacher release, suitable technology); school as PL environment; timetabling; who teaches; same/different teachers in Y5 and Y6; staffing changes; school leadership support/priorities; coherence/similarity of hubs; and hub leadership.
Recipients of the intervention
The recipients of the intervention were Y5 and Y6 pupils who experienced ScratchMaths materials in the context of the ScratchMaths learning environment. Teachers were the intermediary recipients of ScratchMaths professional development. The intended targets for recruitment were two-form entry schools, allowing for whole cohorts in each school to participate.
The target was for two teachers in each school to participate in professional development and teach ScratchMaths, and if possible these two teachers were Y5 teachers who would then be teaching the ScratchMaths curriculum the following year. Where they were unable to attend or it had not yet been confirmed who the Y5 teachers would be for the next school year, then one or more alternative teachers were asked to attend, such as the computing coordinator, who could share the training with other teachers in the school at a later date, or alternatively another class teacher (Y5 or Y6).
During the first year of the trial, in 2015-16, 2,986 Y5 pupils (9-10 years old) in 55 schools experienced ScratchMaths curriculum materials and activities. A total of 105 teachers in these schools attended at least some of the four professional development events. Although the intervention was designed for two teachers per school, in some schools only one teacher attended (if a one form entry) and in others more than two teachers attended, for example, with a specialist computing teacher and year group teachers attending, or if substitutes were sent in the case of illness.
Events offered consisted of two full days plus two half-days, with schools committing at recruitment for teachers to attend the full days, although this was not realised in all cases (see section on fidelity below). The majority of teachers attending the professional development events were Y5 teachers and then teachers who taught Y6 the following year (in most cases a different teacher). Attendees also included teachers with other roles, such as school computing coordinators.
In the second year of the trial, in 2016-17, the same classes of pupils progressing into Y6 (10-11 years old) experienced ScratchMaths. A total of 65 teachers, out of a target of 110 teachers, attended at least some of the 2.5 professional development days. A group of 24 teachers attended at least some of both the Y5 and Y6 training. In addition, in 2016-17, in accordance with a waitlist trial design, Y5 pupils in a further 55 designated control schools experienced the Y5 materials, with 64 teachers attending the professional development.
ScratchMaths materials
ScratchMaths materials are organised into three modules (per year). Modules develop knowledge and skills in relation to Scratch commands and concepts, computing concepts and mathematical content (see Appendix C for details). Each module consisted of a number of investigations, with four investigations developed for five of the modules and three for the sixth module (see Table 2 below).
An investigation consists of core activities that have certain steps designated as extensions, as well as some further, separate extension activities. In addition to programming activities to be performed on a computer, ‘un-plugged’ activities were included. Un-plugged activities are designed to develop computational thinking and programming skills through discussion, pen and paper activities and/or embodied activity away from the computer. Sets of investigations are brought together in a set of teacher materials for each module. Each investigation was designed to last in the range of 50-70 minutes (but in practice were likely to take at least two one-hour lessons, given the time needed for technical setup, and given that timing was also dependent on the number of extension steps/activities that a teacher chose to cover). One-off challenges were also available to be used either by individual pupils or with whole classes - these were additional activities and entirely separate from the core materials.
personal interests, agency and creativity are all important for meaningful engagement in the creation of computational artefacts. Within the ScratchMaths project, this is operationalised through a ‘5E approach’: envisage, explore, exchange, explain, and extend (see Benton et al, 2017).
ScratchMaths professional development
Professional development in each year focused on the use of Scratch programming and the curriculum materials. Professional development took place in seven geographical ‘hubs’.
Teachers from Wave 1 (intervention) schools attended two professional development days in the summer term prior to the teaching of materials to Y5 the following year. These days were intended to be obligatory. A gap between each professional development day was used to give participants opportunities between sessions to undertake tasks in school and to try out materials themselves. In the first year, there were two follow-up additional professional development half-days offered: one in autumn 2015 and one in spring 2016. The term ‘additional’ denotes that the half-day sessions were aimed at revisiting the professional learning covered in the full days, so attendance was not obligatory. Furthermore, in the second year, an additional half-day was offered in autumn 2016 and online webinars were offered in spring 2017.
During professional development events, participants engaged in the ScratchMaths activities as learners, were introduced to underlying concepts, and materials were introduced. The value of peer learning was modelled through paired discussion. Based on interview data, visits to events and survey data, the professional development was positively received on the whole.
Supporting materials and activities
Teachers’ module materials included notes on using the materials, vocabulary and concepts, links to the primary national curriculum, and class discussion points. In addition, supplementary materials were provided, such as vocabulary sheets and Scratch starter projects. On the ScratchMaths website (http://www.scratchmaths.org/wp-login.php) teachers were able to access PowerPoint presentations that could be used to support the use of the investigations, short videos related to some activities, and could download starter code for Scratch projects. Table 2 provides details of the quantity of supplementary materials available for each module. In addition, an introductory video is provided on the ScratchMaths website for module 1.
Table 2: Module supplementary materials
Module Scratch starter projects sheets and/or Vocabulary posters
Presentations
1. Tiling Patterns 5 5 4
2. Beetle Geometry 6 5 4
3. Interacting sprites 4 4 4
4. Building with numbers 20 2 4
5. Exploring mathematical relationships 9 2 4
6. Coordinates and geometry 14 0 3
Intervention providers/implementers
ScratchMaths local coordinators. At all professional development events led by the ScratchMaths team, at least two members of the team were present. Local coordinators had expertise in computing and/or mathematics teaching. They led one of the three optional half-day professional development sessions over the two years, with the ScratchMaths team leading on both the autumn term sessions. In addition, the ScratchMaths team led online webinars.
Location of the intervention
Schools were recruited in seven geographical clusters across England - Blackburn, Bradford, North London, South London, Merseyside, Somerset/Devon and Staffordshire. These seven areas were identified to represent a variety of different types of locality including urban areas and areas where schools were more dispersed and located in mixtures of urban and more rural locations. Identification of locations was done by the ScratchMaths team with advice from NAACE,
Adaptation
It was anticipated that the aims to recruit two-form entry schools and particular year group teachers for the professional development may need more flexible entry criteria. In relation to teacher use of materials, as described above, modules consisted of core materials, with extension activities and additional challenges. Thus, teacher selection of materials was envisaged. In addition, supporting materials such as teacher presentations were provided, but teachers were not obliged to use these and potentially could adapt them. Schools tended to run SCRATCH locally, rather than via the internet, due to technical issues.
Strategies to maximise effective implementation
During the first year of the project (2014/15), the ScratchMaths team from University College London, Institute of Education, undertook a development year in order to design and trial materials for the intervention (both Y5 and Y6 materials) and associated PD. It was planned that five 'design schools' would be involved. In the event, three were fully involved and two further schools had partial involvement. The design schools represented a range of school types and previous levels of engagement with Scratch programming. The pilot phase involved:
Review of the literature and available materials.
Collation, design and trial of materials in the design schools, culminating in a package of materials (teacher, student and PD) in preparation for the main trial focused on computational thinking (Y5) and mathematics and computational thinking (Y6).
The curriculum structure for both years of the intervention was developed prior to the commencement of the trial. Additionally, all of the Y5 content was designed prior to the Wave 1 (intervention) Y5 professional development, with a finalised version of all materials available online prior to the Wave 1 Y5 teachers commencing the delivery of the Y5 intervention in September 2015. Similarly, using the same initial structure, all of the Y6 content was designed prior to the Wave 1 Y6 professional development, again with a finalised version of all materials available online prior to the Wave 1 Y6 teachers commencing the delivery of the Y6 intervention in September 2016.
At the time of recruitment, all schools signed memoranda of understanding, agreeing to release teachers, and other requirements for participation (see Appendix D). ScratchMaths Local Coordinators (SMLCs) offered support to schools in their cluster by advising on recruitment processes and subsequently offering additional local support if requested.
Implementation variability
Recruitment: the initial design aimed for recruitment of schools with two forms of entry for consistency of implementation. With two-form entry schools, and space for two teachers per year group available at PD events, a more consistent pattern of attendance would be possible. In addition, all pupils in the year group would experience ScratchMaths from teachers who had attended the PD events and so had direct and consistent PD experiences from the ScratchMaths team. However, the two-form entry criterion was relaxed to support recruitment (see 'Participant selection' in the Methods section below, for details of the recruited sample).
Professional development varied from the initial design, to include the use of a webinar for additional support rather than a spring twilight session. In addition, in the second year, a hub lead provided on-site professional development to a school. Other variability in implementation at school level and teacher level is reported below where process evaluation findings are reported.
Background evidence
Mathematics and computer programming in schools have a longstanding and intertwined history. There is evidence that programming in schools has the potential to develop higher levels of mathematical thinking in relation to aspects of number linked to multiplicative reasoning, and mathematical abstraction including algebraic thinking as well as problem-solving abilities (Clements, 2000).
More recently, attention has been paid to defining computational thinking (Brennan and Resnick, 2012; Cuny, Snyder and Wing, 2010; McMaster, Rague and Anderson, 2010; Selby and Woollard, 2013; Wing, 2008). Selby and Woollard (2013, based on a review of literature, provide the following definition of the characteristics of computational thinking:
the ability to think in abstractions
the ability to think in terms of decomposition
the ability to think algorithmically
the ability to think in terms of evaluations
the ability to think in generalisations.
Computational thinking is posited to be a relative, or part, of the 'family' of different aspects of mathematical thinking (Wing, 2008). This relationship, if true, would help to explain why programming and programming-based mathematical learning have been found to have a positive effect both on student attitudes and attainment in mathematics in a meta-analysis of the effectiveness of computer-assisted instruction and computer programming in elementary and secondary mathematics (Lee, 1990). However, only a minority of studies in this meta-analysis focused on programming, and such studies were conducted in a period in which computers were more novel.
An agreed definition of computational thinking has not yet emerged in the literature, and the current programme of study in England for computing at KS2 makes no explicit reference to computational thinking (DfE, 2013). However, one of the aims of the computing programme of study addresses aspects of computational thinking:
[Pupils] Can understand and apply the fundamental principles and concepts of computer science, including abstraction, logic, algorithms and data representation (DfE, 2013)
The relationship between coding skills and computational thinking was explored in a recent randomised controlled trial (RCT) in England investigating Code Clubs (Straw, Bamford and Styles, 2017). Code Clubs are after-school clubs for 9 to 11 year-old children (the same age as those participating in the ScratchMaths trial). Teachers and volunteers support teaching of Scratch, HTML and Python programming languages. This RCT found positive outcomes in relation to children’s programming skills but no significant effect on computational thinking as measured by a Bebras-based test (see Appendix F for discussion of Bebras).
A recent mixed-methods qualitative case study found a positive relationship between engagement in programming and problem-solving skills of 6 to 7 year-olds (Y2 in schools in England) when gender and prior attainment were accounted for (Blakemore, 2017). In the first phase of its introduction to the school curriculum, programming in schools was often developed by enthusiasts who would, in many cases, be located in mathematics departments, or, in primary school contexts, who would identify themselves as mathematics specialists. More generally, mathematics educators played an important role in promoting and developing programming, often linked to mathematical learning (see for example Hoyles and Noss, 1992). However, the introduction of Information and Communications Technology (ICT) as a national curriculum subject led to programming in schools being deprioritised, both in relation to computing and in the mathematics curriculum. Recent policy and curriculum changes mean that there is a renewed focus on computing being (re-)introduced into primary schools (DfE, 2013; Furber, 2012).
Since much of the research in computing and mathematical learning was undertaken, new programming languages (such as Scratch) and new tools (for example, Raspberry Pi) have been developed. Scratch is a freely available programming and authoring tool developed for educational purposes at the Massachusetts Institute of Technology in the early 21st century (Monroy-Hernandez and Resnick, 2008). Scratch is based on graphical programming blocks that can be assembled to create programs. The appearance of the blocks is related to their function and meaning. Scratch is highly interactive, allowing for changes to be made to programs while they are running. The scripting area is modelled on a physical desktop to encourage 'tinkering'. Scratch is designed to interface with multimedia, allowing for applications that are meaningful to learners (Resnick et al., 2009). Computational knowledge and skills developed in Scratch have been identified (Brennan and Resnick, 2012).
While Scratch is a development of earlier programming languages designed as learning environments, it represents a significant change in how users code and develop conceptual understanding of programming. Thus, the ScratchMaths intervention represented an opportunity to design and evaluate a curriculum and professional development programme aimed at maximising the benefits of programming for students' mathematical thinking and attainment in the current context.
Evaluation objectives and research questions
Objectives
Evaluation objectives were specified prior to the trial in the evaluation protocol3. The impact evaluation
sought to:
Identify the effect of the intervention on mathematics attainment.
Through the design of a computational thinking assessment, to establish the effect of the intervention on computational thinking as a secondary, intermediate measure, as well as the relationship between computational thinking and mathematics attainment.
Provide an independent view on the process of the design of the curriculum materials and associated professional development activities and the ScratchMaths team's evaluation of
3
these, and to provide guidance to the team on ensuring that the intervention approaches, materials and training will be replicable and testable through a randomised control trial.
Evaluate the reliability and validity of any identified impact through a process evaluation designed to identify issues of fidelity and scalability, in particular the barriers and necessary conditions for successful implementation, and to address the evaluation research questions.
Research questions
RQ1: What has been the effect of the intervention on the development of pupils’ mathematical skills as measured by a randomised control trial?
RQ2: How can computational thinking be measured?
RQ3: What correlation exists between measured computational thinking and mathematics attainment?
RQ4: What has been the impact of the intervention on the development of pupils' computational thinking?
RQ5: What conclusions can be drawn about the relationship between mathematical thinking and computational thinking from the quantitative analysis?
RQ6: To what extent does the design and delivery of curriculum materials and professional development and the associated materials fit with the current knowledge base on effective professional development in relation to mathematics teaching/computing?
RQ7: What are the teachers' views on the effectiveness of the professional development?
RQ8: Were there any barriers to implementing Scratch, or were there particular conditions that needed to be in place for it to succeed?
RQ9: In what ways can the professional development delivery and materials be improved?
RQ10: What issues of fidelity occur during the trial, and how secure is the trial outcome (taking into account any use of Scratch in control schools)?
In addition to these research questions, there was also an exploration, through the process evaluation, of the scalability of the trial.
Ethical review
The trial received ethical approval through both Sheffield Hallam University’s and Institute of Education's (University College London’s) ethics processes. National Pupil Database (NPD) data were subject to NPD protocols about data sharing. At both institutions, procedures are in place to comply with the 1998 Data Protection Act and, to the best of our knowledge; both universities conform to the principles of ISO/IEC 27001 information security standards. No information about any identified individual was reported or made available to anyone beyond the project teams. All data were stored anonymously and securely. Consent forms, participant information, and digital recordings have all been stored separately from any transcripts and case reports. In disseminating findings, names of respondents appear as pseudonyms, and any other potentially identifying data are anonymised. Personal data are only stored on encrypted portable media in password-protected files (and only when absolutely necessary).
was obtained with a total of 21 pupils opting out4 (see Appendix D). For telephone interviews with
participating teachers, additional information was provided and written consent obtained. Teacher survey participants were informed that completion and submission of surveys constituted consent.
Project team
Firstly, the ScratchMaths development team and, secondly, the SHU evaluation team members are listed below. For a fuller description of roles see Appendix E.
ScratchMaths development team, University College London, Institute of Education (IoE)
Professor Richard Noss, Professor Celia Hoyles, Professor Ivan Kalas, Professor Dave Pratt, Laura Benton, Alison Clark-Wilson, Kim Parsons, Piers Saunders, Johanna Carvajal.
National Association for the Advancement of Computer Education (Naace)
Mark Chambers: CEO.
Evaluation team, Sheffield Hallam University (SHU)
Professor Mark Boylan, Sean Demack, Dr John Reidy, Anna Stevens, Claire Wolstenholme, Dr Martin Culliney, Ian Guest, Professor Hilary Povey, Phil Spencer, Sarah Reaney-Wood, Ian Chesters.
Trial registration
The Scratch Maths trial was registered on 11th October 2016 on The ISRCTN registry (ID number ISRCTN10189078)5.
4 Fifteen pupils opted out prior to randomisation and six pupils opted out during the first year of the evaluation. No
pupils opted out during the second year of the evaluation.
Methods
Trial design
The impact of ScratchMaths was evaluated using a two-armed clustered randomised controlled trial (RCT) design with randomisation at the school level. Randomisation took place at the school level in order to minimise the risk of spill-over that within-school randomisation brings. The RCT design took account of clustering of pupils within schools in classes and clustering of schools within seven geographical areas6.
In April 2015, 110 of the 111 recruited schools were randomised into the intervention (Wave 1) or control (Wave 2) groups. For the control condition, a waitlist approach was adopted, as detailed below:
Intervention (Wave 1) Schools (2,986 pupils in 97 classes in 55 schools):
• ScratchMaths professional development events for Y5 teachers in summer 2015 and Y6 teachers in summer 2016.
• Schools implementing ScratchMaths with Y5 classes in 2015/16 and with Y6 in 2016/17.
Control (Wave 2) Schools (3,246 pupils in 110 classes in 55 schools):
• ScratchMaths Professional Development events for Y5 teachers in summer 2016 and Y6 in summer 2017 (after trial end).
• Pupils/teachers in Y5 during 2015/16 and Y6 in 2016/17 represent the 'business as usual' control group.
It is important to note the distinction between class and teacher level. Prior to randomisation in April 2015, recruited schools submitted class lists for all Y4 pupils. The numbers of pupils, classes and schools at baseline (shown above for intervention and control schools) are based on this data. The ScratchMaths program was aimed at two teachers in each intervention school - two teachers in Y5 during 2016 and Y6 in 2017. The data provided prior to randomisation was insufficient to attach named teacher(s) to specific Y4 classes. So, whilst this trial had a class level, this does not mean it had a teacher level.
The ITT impact analysis sample is based on these submitted class-level lists of all Y4 pupils (who had complete baseline/outcome data and did not opt out) for each school. The number of classes per school varied between 1 and 4 (see table 3, below). The 55 intervention schools had a mean of 1.75 classes per school and a mean of 30.8 pupils per class. The 55 control schools had a mean of 2.00 classes per school and a mean of 29.5 pupils per class. This accounts for the slightly larger pupil sample in control schools (n=3,246) compared with intervention schools (n=2,986).
As detailed in the evaluation protocol7 and randomisation section below, a
propensity-score-paired-school-stratification approach to randomisation was adopted. This approach grouped schools into 'nearest statistical' pairs within the geographical hub regions. For each pair, one school was randomly selected into the intervention group and the other was placed into the control group.
KS1 National Pupil Database (NPD) data for attainment, Free School Meal (FSM) status and gender were obtained in January 2016. These KS1 data were collected in 2013, two years prior to randomisation. NPD data for the primary outcome (KS2 maths attainment) were requested in July 2017
6 As noted above - Blackburn, Bradford, North London, South London, Merseyside, Somerset/Devon and
Staffordshire.
7
and obtained in December 2017. Data for the interim secondary outcome (computational thinking) were collected in July 2016.
Note that the waitlist design in this case meant that Y5 pupils in the control schools received the intervention during the second year of the trial (2016/17). There is, then, a risk of potential spill-over from those Y5 teachers and classes to the control Y6 teachers and classes. Data investigating the possible spill-over were collected as part of the implementation and process evaluation (IPE) by a survey of teachers.
Two key documents were published on the EEF website during the trial period: the evaluation protocol and the statistical analysis plan (SAP). The evaluation protocol was first published in February 20166
and updated in March 2017 and the SAP was published in November 20178.
Participant selection
Eligibility criteria
The trial was to involve, ideally, two classes of Y5 pupils per school, and the same pupils when they progress into Y6. The target recruitment was for two-form entry schools wherever possible. Having the same number of Y5 classes would simplify Unique Pupil Number (UPN) data collection, opt-out consent and possible movement between classes as the whole year group would be involved. The aim for two-form entry schools was relaxed, due to recruitment difficulties, in order to support recruitment, and the distribution of classes in schools is set out below in Table 3.
Table 3: Sample by number of forms (classes) per school
Number of forms
Number of schools: Intervention
Number of schools:
Control
Total
1 5 2 7
1.5 1 0 1
2 43 43 86
3 6 8 14
4 0 2 2
Total 55 55 110
Data source: table compiled from number of forms indicated by information supplied by school to IoE, with missing data completed from Raise Online9 as source for 10 of the 110 schools.
There is the possibility of a small dilution effect for the six three-form entry intervention schools (though arguably a balancing concentration effect in one-form entry schools). School size and number of forms of entry are included in the intention-to-treat analysis model through the matching process.
Other criteria were that schools had adequate internet connectivity and enough laptops or desktop PCs (at least one between two pupils) available for Y5 and Y6 pupils.
8 See
https://educationendowmentfoundation.org.uk/projects-and-evaluation/projects/scratch-programming/ for these documents.
Recruitment
Recruitment began during the design phase with the aim of identifying all schools by 15 March 2015. This was to allow for signing of MoUs, collection of UPNs and NPD data retrieval prior to randomisation. IoE aimed to identify five hub locations through discussion with the National Association of Advisors for Computers in Education (UK) (Naace). In the event, seven hubs were identified that were geographically spread and had different profiles in terms of degrees of urban or rural contexts. Recruitment was undertaken by IoE with support from Naace. Once schools had been recruited, SHU collected UPNs for the focus cohort (Y5 in 2015/16) and other school and teacher-level data as needed.
The trial planned to involve the recruitment of approximately 115 schools. It was anticipated there would be drop-out at the point of agreeing to trial protocols, and the design aimed for 100 participating schools at the point of randomisation (50 intervention, 50 control). In the event, 111 were recruited and 110 allocated to the intervention and control conditions (see below). As noted above, recruitment was undertaken by the ScratchMaths team working with the Naace and local partners and so contact with schools was undertaken through multiple pathways and therefore it is not possible to identify how many schools were approached to take part.
SHU and IoE co-produced information, including initial recruitment information, consent forms and MoUs for use with the schools. IoE supplied SHU with information on the recruitment process using the participant flow diagram recommended for EEF reports10.
Schools were required to provide the following as a condition of being entered into the randomisation:
MoU signed by the head teacher. The MoU included details of the requirements for the computational thinking test (CT test) in summer 2016 and both IoE and SHU evaluation activities, as well as information the school would be expected to supply.
Information on names of teachers and roles of those who would be attending the professional development events if allocated to the intervention group.
Summary information on any previous use of Scratch programming, or engagement with Bebras/Beaver tests (this information was collected for purposes of comparing samples following randomisation but was not related to eligibility criteria).
Pupil lists for Y5, including UPNs.
Confirmation the school has sent out the parent opt-out consent form.
Figure 4 outlines the process of recruitment, with dates, up until the start of professional development.
10
Figure 4: Recruitment and allocation timeline
Memorandum of understanding and consent
In addition to being sent a project information sheet with ethics and consent issues outlined, all schools were asked to sign and return (by the head teacher) an MoU (see Appendix D) which detailed the school’s, the ScratchMaths development team’s and evaluation research team’s responsibilities to the project. The MoU acted as a contract between the school and the research team, and enabled participants to understand and give their consent to all aspects of the trial. The MoU explained that the research team would access the NPD to retrieve data on pupils involved in the trial. Data collected from the test and schools would then be matched with data retrieved from the NPD and could be shared with IoE, the EEF's data archive and the UK Data Archive for research purposes. Lastly the MoU explained that no individual school or pupil would be identified in any report arising from the research. Similar procedures were used in schools participating in the CT test development (see Appendix F).
Consent for pupils to take the CT test (in both design and trial schools) was obtained through opt-out parental consent forms distributed to all parents of pupils taking the test via the school (see Appendix D for main trial form). A total of 15 parents completed an opt-out consent form in the first instance (before the NPD request was submitted). After class lists were obtained, a further six parents returned opt-out forms. The total number of pupils for whom baseline data was considered, excluding opt-outs, is 6226 (6232-6).
All teachers in the intervention and control samples, who were asked to complete a survey, when contacted by email, were sent an information sheet which detailed ethical procedures including data storage and usage. Teachers gave their consent for use of their data through their completion of the survey and this was outlined in the information on the first page of the survey. Teachers taking part in a telephone interview were also sent the project information sheet prior to arranging an interview. Ethical procedures were discussed at the start of the interview, including their right to withdraw, and consent was taken verbally from teachers to take part in the interview and for it to be recorded.
Outcome measures
Primary outcome
The primary outcome was overall KS2 maths attainment in May 2017. Appendix G summarises the distribution of two measures of KS2 maths attainment: a raw score (obtained from summing the scores in three KS2 maths papers) and a score that is re-scaled such that a value of 100 or greater indicates
Initial recruitment/expressions of interest by March 15th 2015
School agreement to participate and return of forms by March 31st 2015
Randomisation in April 2015 IoE informed school in May 2015
when a pupil has met or exceeded the expected KS2 maths level of attainment11. The SAP specified
the primary outcome for the impact analysis to be the raw KS2 maths attainment score. However, because the distribution of the raw scores displayed a notable skew, all of the intention-to-treat (ITT) impact analyses were replicated using the scaled (and not skewed) version of KS2 maths attainment. See Appendix G for more detail on this.
Secondary outcomes
Follow-on analyses examined impact within the three KS2 maths test papers12 taken by pupils in May
2017.
In addition to KS2 maths attainment, a further secondary outcome was computational thinking based upon pupil scores for a CT test developed administered to trial participants in July 2016. Thus, this measure also provided an interim measure of the impact of ScratchMaths at the end of the first year of the trial. The CT test was piloted by SHU in 2015, and this pilot and the use of the test in the main trial addressed Research Question 2 "how can computational thinking be measured?" Further details of the CT test, its development and analysis are provided in Appendix F and are summarised below.
Members of the SHU and IoE teams met in November 2014 for SHU to develop an understanding of IoE’s operational definition of computational thinking as used in the intervention design. Following this, SHU reviewed the literature on computational thinking, and proceeded to design, develop and test the CT test independently and prior to having access to ScratchMaths materials. Further, the ScratchMaths team had access to the test only once it had been used in the main trial and after material development. The CT test used Beaver/Bebras13 questions or similar types of tasks, to support construct validity. The
selection of items was informed by the composition and level of difficulty of English versions of Beaver/Bebras designed for 10-11 year-olds. The test and test protocols were piloted with both Y5 and Y6 children across the attainment range and then administered to an outcome measure design sample of 231 Y6 pupils from nine primary schools in England from a region not involved in the trial. The CT test scores from these pupils were then correlated with KS2 maths scores and this yielded a statistically significant correlation (r=0.45, n=231, p<.001).
Key features of the CT test, as identified from both the pilot and main trial samples were:
High level of construct validity given the use of Beaver/Bebras and similar items.
Normal distribution of scores with a mean near to the mid value of the scale.
Good internal reliability (ordinal Cronbach's α of 0.72).
Unidimensional.14
All items had significant factor loadings with the single underlying dimension and all items if deleted led to a reduction in ordinal Cronbach's α.
The CT test was developed independently of the ScratchMaths team. Following its use in the main trial, the ScratchMaths team expressed concerns about the validity of the CT test in relation to it focusing on 'pre-formal' aspects of computational thinking, and it not being related to the new computing national curriculum. These concerns are included and discussed in Appendix F alongside limitations identified by the evaluation team.
ScratchMaths may have a positive impact on aspects of computational thinking that are not tested by the CT test, and it is important to recognise that it is not a test of programming knowledge or skill.
11 See https://www.gov.uk/guidance/scaled-scores-at-key-stage-2
12 Specific NPD variables - KS2_MATARITHMRK (Paper 1, arithmetic); KS2_MATPAPER2MRK (Paper 2, reasoning) &
KS2_MATPAPER3MRK (Paper 3, reasoning).
13 Established in 2004, this is an international computing contest, see http://www.bebras.org and
http://www.beaver-comp.org.uk. It is now run in 30 countries. In 2013, more than 720,000 pupils took part in the contest.
14 Factor analysis using parallel analysis indicated one dimension and Rasch analysis yielded a non-significant Andersen
However, there are sufficient reasons to conclude that it was suitable for use in the trial, given that: the overall outcome of normal distribution around the middle of the test scale (see Appendix H); the test did identify a difference in outcome; and it has a high level of construct validity as the type of items, mostly from Beaver/Bebras, are ones considered to be related to computational thinking and of the level of difficulty considered suitable for children of this age.
Measuring computational thinking at the end of Year 1 (2015/16) addressed the intended outcomes of the first year of the trial, where the focus was on computing and computational thinking. In addition, it allowed analysis of the relationship between measured differences in computational thinking and the impact on mathematics attainment.
Administration of the CT test in the main trial was staggered to accommodate schools' access to IT facilities and the potential need for support with log-in for pupils and IT support by SHU. Appendix F has more details about the timing of the CT test. As approximately 75% of school tests took place within a two-week period, it is unlikely that timing influenced outcomes, and there were no discernible differences in patterns of test-taking between intervention and control samples.
Assessment was automated through application of code to student responses and so was blind to the trial condition. Teachers were responsible for invigilating the tests, following a protocol developed during the pilot of the test; they were also required to submit a record of any relevant factors that might have influenced results. Teacher invigilation of the test had the same level of security as routine administration of KS2 tests. Analysis of records of test administration from teachers indicates no threats to test reliability from the way the test was administered, comparing the intervention and control conditions.
Knowledge of outcomes of the comparative analysis of the CT test was restricted to the trial statisticians and so was withheld from schools, IoE and other members of the SHU evaluation team, until summer 2017, when the trial was complete.
Sample size
A three-level clustered randomised controlled trial design was adopted for this evaluation (pupils clustered into classes clustered into schools). Randomisation took place at the school level and the outcome variables are all at the individual pupil level. A class-level analysis was also included to reflect the structural reality of the data and to acknowledge the widespread use of setting within primary schools for KS2 mathematics.
The power calculations were undertaken using the Optimal Design Software15. Table 4 below
summarises the estimated minimum detectable effect sizes (MDES) for the primary and secondary outcomes from the protocol, baseline and at analysis stages of the trial.
At the protocol stage, an MDES of 0.18 standard deviations was estimated. Specifically, a three-level clustered randomised controlled trial with 110 schools, two classes per school and 20 pupils per class, results in a design that would be able to detect an effect size of 0.18 standard deviations or higher as statistically significant with a statistical power of 0.80. This estimate assumed that an estimated 13% of the variation in KS2 maths attainment would be clustered at the school level and 7% would be at the maths classroom level16. Additionally, the protocol MDES estimate assumed that the correlation
between KS1 and KS2 maths attainment would be 0.77 (R2=0.59) based on EEF guidance. The
baseline numbers for schools and classes were very similar to those we had estimated in the protocol,
15Raudenbush, S. W., et al. (2011). Optimal Design Software for Multi-level and Longitudinal Research (Version 3.01) [Software].
Available from www.wtgrantfoundation.org
16 The school level ICC of 0.13 is taken from the EEF guidance from analyses of NPD 2013-2014 and the class level ICC of 0.07
while the number of pupils was larger. This resulted in the same MDES estimate at baseline as was reported in the protocol.
For the interim secondary outcome (computational thinking), the protocol MDES estimate was 0.21 standard deviations, which also remained consistent at baseline.
Table 4: Minimum detectable effect size (MDES) for planned analyses for ScratchMaths clustered RCT from protocol and at baseline
Protocol Baseline
No. of Schools / Classes / Pupils 110 / 220 / 4,400 110 / 207 / 6,232
Primary Outcome (KS2 Maths Attainment)
KS1 Maths Covariate R2 0.59 0.59
MDES estimate 0.18 0.18
Interim Secondary Outcome (CT Test Score)
KS1 Maths Covariate R2 0.25 0.25
MDES estimate 0.21 0.21
p<0.05; statistical power =0.80; ICC estimates: 0.13 (school); 0.07 (class)
Randomisation
A stratified approach was adopted for the school-level randomisation in April 2015. As detailed in the trial protocol and SAP, a logistic regression model was used to generate school-level predicted probability or ‘propensity’ scores based on the schools’ 2013/14 KS2 attainment outcome variable17 and
seven explanatory variables18. Within each of the hub areas, the propensity scores were used to group
schools into their 'nearest statistical neighbour' pairs. One school from each pair was then randomly selected into the intervention (Wave 1) group; the remaining school was allocated to the control (Wave 2) group.
Our propensity-score-paired-school-stratification approach required an even number of schools in all of the geographical hub areas. This was not the case for three areas: an odd number of schools were recruited in the two London hubs (north and south) and in the Somerset hub. The two London hubs were merged into a single hub with an even number of schools. Within the Somerset area, the propensity scores identified one school to be very distinct19 from the remaining 16 schools. This school
was then dropped and the remaining schools were paired and randomised to the intervention or control group. The Somerset school excluded from the trial was offered ScratchMaths as part of the waitlist design, but we have not used any data from this school in the impact evaluation.
In all, 55 schools were randomly selected to receive the ScratchMaths intervention and their 55 paired schools were allocated into the control group.
17 A binary outcome that identified whether the proportion of pupils within a school attaining a level 5 or higher in
KS2 mathematics was greater than the median population value of 42% (=1) or not (=0). Source: KS2 School level Census data for all of England in the 2013/14 academic year, available from https://www.compare-school-performance.service.gov.uk/download-data
18 Explanatory variables - KS1 attainment, KS1 to KS2 progress in mathematics, school size, gender balance,
%FSM, %EAL, %SEN.
19 In terms of propensity scores, this school had a score of 0.403. When the propensity scores were rank ordered
In 2014/15, prior to randomisation, recruited schools were requested to provide lists of all pupils in Y4 and the names of their classes and teachers. Following randomisation in April 2015, 2,986 pupils were located in 97 classes in the 55 intervention schools and 3,246 pupils located in 110 classes in the 55 control schools.
The propensity-score-paired-school-stratification approach to randomisation brings three key advantages:
It enabled a large number of variables to be drawn on for stratification.
Stratification variables were finely grained (i.e. scale rather than categorical).
It provided greater flexibility and robustness for follow-on analyses (such as on-treatment or sensitivity analyses).
The propensity-score-paired-school-stratification approach drew on seven scale variables to create 55 pairs of schools. Within each pair, one school was randomly selected into the intervention (Wave 1) and the other to the control (Wave 2) group. Minimisation and standard approaches to stratification tend to be confined to a smaller number of categorical variables and therefore are less finely grained.
The third advantage is most clearly illustrated with respect to on-treatment analyses. In the ScratchMaths trial, an on-treatment analysis might proceed from analyses that examined whether fidelity to ScratchMaths was statistically associated with KS2 maths attainment. If an association between fidelity and attainment was found, a subsample of the intervention group might be identified as being 'on treatment' to ScratchMaths if they are observed to reach a specified level of 'fidelity'.
An on-treatment impact analysis might then compare the KS2 maths attainment for this restricted 'on treatment' intervention group subsample with a control group. With minimisation or more standard stratification approaches to randomisation, the original complete control group would usually be used for this comparison. This brings an increased risk of imbalance between the restricted 'on-treatment' intervention subsample and the original complete control sample.
The propensity-score-paired-school-stratification approach limited this risk of imbalance. Once an 'on-treatment' intervention subsample of schools is identified, the control group can similarly be restricted to include just the matched pairs for each 'on-treatment' school. For example, if 30 of the 55 intervention schools involved in the trial are identified as 'on treatment', these 30 intervention schools could be compared with their 30 matched control schools rather than the entire 55 control school sample. This is the approach that was followed in the analysis.
Analysis
Impact analyses for primary outcome
As set out in the SAP, the impact of ScratchMaths on KS2 mathematics attainment was examined using a multilevel analysis with three levels (pupils clustered into classes20 clustered into schools). An
intention-to-treat (ITT) approach was adopted and the models were constructed in three stages.
Stage 1 - an outcome-only analysis that included the dummy variable that identified whether a pupil was in the intervention or control group.
Stage 2 - KS1 maths covariates at both pupil and school level21 were included.
20 See Trial Design in Methods section above, note that class and teacher levels are not the same. The class level
was identified using class list data provided by recruited schools prior to randomisation.
21 KS1 mathematics attainment was included as a pupil level (NPD variable name = KS1_MATPOINTS) and an
Stage 3 - all of the school-level variables used as explanatory variables22 to generate the
propensity scores and dummy variables to identify school pairs within geographical hubs were included.
The Stage 2 model was used to assess the impact of the ScratchMaths intervention on the primary outcome. The impact of ScratchMaths has been estimated by dividing the coefficient for the dummy variable that identifies ScratchMaths intervention schools by the total standard deviation for the empty multilevel model (see Appendix I for more detail on this). The Stage 3 model was undertaken as sensitivity analysis to fully take account of the propensity-score-paired-school-stratification research design.
To address a notable negative skew observed in the primary outcome23, further sensitivity analyses
were undertaken not specified in the SAP. A scaled version of KS2 maths attainment was supplemented for the specified raw KS2 maths outcome and modelled using the same three stages listed above.
As specified in the SAP, three subsample analyses were undertaken. The purpose of these analyses was to explore whether ScratchMaths had a different impact for some groups of pupils compared with others. Subsample analyses relating to FSM status, gender and KS1 maths attainment were undertaken. This was done first by introducing interaction terms into the KS2 maths attainment impact model using two stages:
Stage 1 - Main Effects model that included the ScratchMaths dummy variable, KS1 maths attainment, FSM status and gender.
Stage 2 - including interaction terms ScratchMaths*FSM; ScratchMaths*Female and ScratchMaths*KS1 maths alone and then simultaneously.
Follow-on subsample analyses for FSM and not-FSM subsamples were undertaken regardless of the findings from the interaction analyses (FSM being a sub-group of interest for the EEF), but follow-on subsample analyses relating to gender and KS1 maths attainment were only undertaken if the interaction term was statistically significant.
Impact analyses for follow-on KS2 maths secondary outcomes
As specified in the SAP, follow-on analyses examined the impact of ScratchMaths on attainment within the three separate KS2 maths tests. These analyses adopted exactly the same ITT approach used for the main primary analyses and exactly the same three-level and three-stage multilevel approach.
Impact analyses for interim computational thinking test outcome (2016)
An ITT approach for the interim secondary outcome (computational thinking) was not possible due to issues of missing data. CT test data were not obtained from 29 schools including 11 intervention schools known to have withdrawn from engagement in ScratchMaths professional development or use of materials24. Reasons for non-completion of the other 18 schools are not known. However, a similar
number of control schools did not participate in the wait-list PD events and so this may signify that they felt less investment in participating. The main impact analyses for the CT test outcome adopted the same three-level and three-stage multilevel approach taken with the primary outcome.
In response to the potential imbalance that missing CT test data from 29 schools might bring, further sensitivity analyses were conducted. These analyses drew on the
22 School-level variables - KS1 attainment, KS1 to KS2 progress in mathematics, school size, gender balance (%
Female), %FSM, %EAL, %SEN.
23 The negative skew was observed in the KS2 maths raw attainment score (KS2_MATMRK), see Appendix I. 24 The total of 11 is based on information from the ScratchMaths team or provided by schools when asked to
stratification research design to limit the CT test analyses to a sample of 'complete pair' schools. Specifically, within the 81 schools with CT test data, 62 were 'complete pairs' and CT data were available for both the intervention and paired control schools (31 intervention and 31 matched control schools). As discussed in the SAP and summarised in the trial design section above, the reason for doing this was to best ensure good baseline balance between control and intervention schools without compromising randomness in the RCT design.
As with the primary outcome, subsample analyses relating to FSM status, gender and KS1 maths attainment were undertaken for the CT test outcome. This was done using two model stages:
Stage 1 - main effects model that included the ScratchMaths dummy variable, KS1 maths attainment, FSM status and gender.
Stage 2 - including interaction terms ScratchMaths*FSM, ScratchMat