MOULTRIE, James, LIVESEY, Finbarr, MALVIDO, Cecilia, RIEDEL, Johann,
BELTAGUI, Ahmad, PAWAR, Kul, NIXON, Bill, MACBRYDE, Jillian,
MARTINEZ, Veronica, DEMIAN, Peter and EVANS, Steve
Available from Sheffield Hallam University Research Archive (SHURA) at:
http://shura.shu.ac.uk/546/
This document is the author deposited version. You are advised to consult the
publisher's version if you wish to cite from it.
Published version
MOULTRIE, James, LIVESEY, Finbarr, MALVIDO, Cecilia, RIEDEL, Johann,
BELTAGUI, Ahmad, PAWAR, Kul, NIXON, Bill, MACBRYDE, Jillian, MARTINEZ,
Veronica, DEMIAN, Peter and EVANS, Steve (2009). Developing a National Design
Scoreboard. In: Undisciplined! Design Research Society Conference 2008, Sheffield
Hallam University, Sheffield, UK, 16-19 July 2008.
Copyright and re-use policy
Sheffield, UK. July 2008
Developing a National Design Scoreboard
James Moultrie, University of Cambridge, UK
Finbarr Livesey, University of Cambridge, UK
Cecilia Malvido, University of Cambridge, UK
Johann Riedel, University of Nottingham, UK
Ahmad Beltagui, University of Nottingham, UK
Kul Pawar, University of Nottingham, UK
Bill Nixon, University of Dundee, UK
Jillian Macbryde, University of Strathclyde, UK
Veronica Martinez, Cranfield University, UK
Peter Demian, Loughborough University, UK
Steve Evans, Cranfield University, UK
Abstract
Recognising the growing importance of design, this paper reports on the development of an approach to measuring design at a national level. A series of measures is proposed, that are based around a simplified model of design as a system at a national level. This model was developed though insights from literature and a workshop with government, industry and design sector representatives. Detailed data on design in the UK is presented to highlight the difficulties in collecting reliable and robust data. Evidence is compared with four countries (Spain, Canada, Korea and Sweden). This comparison highlights the inherent difficulties in comparing performance and a revised set of
measures is proposed. Finally, an approach to capturing design spend at a firm level is proposed, based on insights from literature and case studies.
Keywords
National Design System, Design Performance
Introduction
There is growing interest in the potential contribution that design makes to a country’s economy (Hytonen et al 2003). In 2005, the UK Treasury
commissioned the Cox Review of Creativity in Business (Cox 2005), and at the same time, the Department of Trade and Industry produced a review of Creativity, Design and Business Performance (DTI 2005). Both reports
concluded that strength in design at a national level is necessary for ongoing economic sustainability. However, to date, evidence on the role and impact of design at a national level has been lacking.
Sheffield, UK. July 2008
data which is comparable between nations, sectors and firms on aspects of innovation performance (Sajeva et al 2005). The UK R&D scoreboard has specifically enabled the development of clearly articulated targets for public and private investment in R&D. It has also influenced Government policy relating to industry and R&D (DTI 2005).
However, it is increasingly apparent that strength in technology development is not sufficient as an indicator of national economic strength (Strategic Direction 2005). Thus, this research aims to address the question, “how might the strength of design in the UK be measured and compared against other nations?”
The overall research was broken into three key stages. The project started with a comprehensive literature review addressed existing national measurement systems and to establish the conceptual foundations of a potential design scoreboard. In the early stages of the project, a workshop with expert
stakeholders from industry, academia, the design sector and government was held to explore the potential use and also content of a National Design
Scoreboard. This workshop helped inform subsequent work, including detailed company case studies and further exploration of national indicators of design.
The underpinning conceptual foundation will first be described, followed by a brief summary of the outputs from the workshop. Findings from company cases and the collection of national indicators will be summarised in following sections.
Conceptual foundations: A National Design System
In the early 1980s, standard approaches to economics failed to consider the dynamic nature of innovation with respect to innovation (Lundvall 2007). Over the last 30 years however, the notion that there is a National Innovation
System has become widely accepted (Nelson 1993, p17). This concept is based on the notion that innovative activity results in a ‘stock’ of knowledge and capabilities that have potential for future exploitation and thus economic return. This human and intellectual capital is generated across a complex and inter-related network of actors, including firms, government, education, public sector, private sector and academia. Lundval (2007, p102) argues that firms play the most important role, in their interaction with this system and that this is dependent upon education systems and labour markets.
The concept of a National Innovation System is well established, but can this concept be of use when considering design? To answer this question, it is useful to consider the similarities and differences between design and innovation:
Sheffield, UK. July 2008
interface might better satisfy customers. Thus, like innovation, the results of design activity have substantial potential to influence future economic growth. The result is a different ‘stock’ of design outputs and this draws upon a
different base of human capital.
Design is arguably more pervasive. Emphasis on innovation tends to ignore economically beneficial activity that may happen outside of the
development of new technology. Thus, a wider range of firms are active in design than are active in technically oriented innovation. Thus, design may make a more important part in the economy that it is currently assumed.
When considering design nationally, it is similarly part of a complex system in which there are many interrelated actors. As with innovation, the primary exploiters of design are firms. However, as with innovation, these firms form part of a system including education, design agencies, government bodies and academia.
This concept of a National Innovation System has been adopted as a basis for compiling national comparisons of innovation. In exploring the UK’s
“Innovation Gap”, Livesey et al (2006), investigated measures of national innovation performance, for comparison against other industrialised nations. This analysis recognised that innovation is a dynamic process depending on many factors, from the skills and education of scientists through to the public investment and policy decisions. As a result, there is likely to be no single
innovation indicator gives a comprehensive picture of performance (DTI 2003). Thus, a range of measures were collected as part of the national innovation system. This system was decomposed into Inputs, Outputs, Outcomes and Enabling Conditions as illustrated in figure 1.
Enabling conditions: the legal structures, institutions and policies that provide the necessary framework for innovative activity.
Inputs: factors relating to long term strength, such as investment in R&D, and the skills of those involved in technology development.
Outputs: the direct results of the input investments in either financial or human capital, ranging from technical papers to patents.
[image:4.595.121.538.612.739.2]Outcomes: the results of those outputs, including exports and the growth of the technology sector. It is recognised that due to the complexity of this system, it is difficult to establish any causal links between individual elements in this system.
Figure 1: Simplified National Innovation System (Livesey et al 2006). ENABLING CONDITIONS
OUTCOMES OUTPUTS
Sheffield, UK. July 2008
This study adopts a similar approach, recognising that design, like innovation, can be treated as a complex system. Furthermore, it is recognised that there is also no single measure that will describe the strength of design in a nation.
Workshop
At the outset of the project, a workshop with key stakeholders was held. This workshop set out to capture the needs of potential users of a design
scoreboard and to explore the potential structure and indicators in a scoreboard to meet these needs. The workshop was attended by ten experienced professionals, from industry, the design sector, academia and government. This mix was chosen to ensure that all perspectives were considered. However attendance was biased towards government and industry. Participants were invited as ‘experts’ in their sector and also potential stakeholders for the design scoreboard.
Following introductory presentations and discussions, participants were asked to identify measures which might be of interest to them. These initial measures were then mapped against a model of a National Design System and were further refined to select indicators which might enable international
comparison.
The primary output from the workshop was a revised model of the ‘National Design System’, as represented in figure 2. This included a set of measures that participants believed were important indicators of national design strength.
Figure 2: National Design System – output from stakeholder workshop
A further critical observation was made on the relationship between the inputs, outputs and outcomes. Many participants were interested in outcome
measures. However, they recognised that these outcome measures are not meaningful unless the inputs are well understood. A lack of any historic measurement of inputs results in it being very difficult to comment on any potential relationships. One senior governmental participant, with expertise of the R&D scoreboard noted that after 20 years of collecting data on firm investment, they are only just beginning to make meaningful correlations between that investment and performance several years later.
ENABLING CONDITIONS
• National design policies• Public support for & promotion of design
OUTCOMES
• Design exports • Turnover of the
design sector
OUTPUTS
• Design registrations • Trademarks • Design awards
INPUTS /
CAPABILITIES
• Design graduates • Design leadership infirms
• Designers in the workforce
• Public Investment in design
Sheffield, UK. July 2008
As a result, it was believed to be difficult in the short term to generate meaningful output measures, without first gaining a better understanding of the inputs.
Thus, the input measures and especially those relating to finance and human capital were viewed as essential. This informed subsequent work, to focus on two primary streams of activity:
To capture available data relating to the proposed indicators for a range of nations, to test both the viability of these measures and the availability of existing data.
To develop a means of capturing design investment in firms, as a primary input measure in the National Design System. This involves the development of a robust categorisation of design within the firm to enable expenditure to be reliably captured.
The National Design System
The long term ambition of the project is to compare the UK against a large number of nations. In the first instance, to test the viability of proposed measures and explore the potential for wider data collection, data from 24 nations was collated (including New Zealand, Canada, USA, Japan, Korea, Denmark, Norway, Spain, France, Italy, Singapore, Germany, Holland and Sweden). Data was found through published reports, literature reviews and approaches to key stakeholders in each nation. Wherever possible, data was collected to indicate trends in design performance over the last ten years.
However, for many countries, data is either unavailable, or incomparable, due to differing terminology. Thus, data from five of these countries, reflecting northern Europe (Sweden), Mainland Europe (Spain), East Asia (South Korea), the Americas (Canada) and the UK is presented here. This selection was chosen to reflect the difficulty in comparing data from different sources and is also based on pragmatism, reflecting the availability of data relating to
design.
Enabling conditions
Little qualitative data is available relating to the enabling conditions in each nation. Perhaps the best proxy for this is the investment spent by national governments in the promotion and support of design. However, this is difficult to establish due to the variety of national approaches:
UK: There is no explicit national policy for design in the UK. However, there is strong governmental support for design, through the UK Design Council, which received a core grant of £6.0m for 2006-7 (Design Council 2006). There are also national bodies for Wales and Scotland, with similar ambitions. Furthermore, design support is provided through the Regional Development Agencies. Thus, it is difficult to establish a single reliable value for public investment in design support and promotion.
Sheffield, UK. July 2008
Vancouver and Montreal. Similarly, in each state, there are a regional policy initiatives.
Sweden: There are a number of public bodies supporting different aspects of design, including Swedish Industrial Design, the Swedish Society of Crafts and Design, and Svensk Form.In 2005, the Nordic countries (Denmark, Sweden, Finland, and Norway) established a regional design policy (Power 2005, Koch 2004)
Spain: The Spanish Federation of Design Promotion was created in 1996 as a non for profit organisation. It provides a central body to represent eight federal institutions. The State Society for Design Development and Innovation also acts as a coordinating institution to promote design in Spain (DDI 2006).
Korea: Unlike the UK, design is an emerging phenomenon in many far-east countries. The Korean Institute of Design Promotion was established in the early 1990s, and in 2006, KIDP opened new facilities, funded by federal and municipal governments at a cost of US$ 54.5m. A further US$12.3m was invested to create sixteen design innovation centres in different regions of the country (KIDP 2003).
Inputs: design education
In principle, capturing evidence on design education should be relatively straightforward. Most nations collect national statistics relating to graduates and postgraduates in all subject areas. However, this data is not always available at a detailed subject level. Furthermore, in some nations, data is only available regionally, not nationally:
UK: The nature of the classification schemes makes it difficult to compile any single values for the number of design graduates, as ‘design’
appears in both the arts and sciences. Data from the Higher Education Statistics Agency (HESA 2008) indicates that around 77,675 people graduated with a first degree in a design related subject in 2006. This includes a wide range of ‘creative arts’ subjects that could be
considered outside the remit of design. A more conservative number of around 20,225 for 2002 is provided by the Design Council (14), for a narrower set of degree subjects. Depending on the subjects included, a more conservative estimate of around 8,104 students for 2006 is possible. Thus, depending upon the design subjects chosen, the UK (in 2002) could be said to have between 8,000 and 60,000 design students.
Canada: Statistics on education are collected in each of the 13 provinces and as a result, there is no readily available data at a national level. Design is included under a number of high level subject headings, including architecture, engineering, visual and performing arts, and communications. Thus, to establish a reliable estimate on design graduates, data at a detailed level from many subject areas is required. In architecture and engineering for example, graduates have increased from around 13,000 in 2001 to around 17500 in 2005 (Statistics Canada 2005).
Sweden: There has been 300% growth in all degree level education between 1993 and 2003. The number of full-time students in
Sheffield, UK. July 2008
330% in the same time period (Power 2005). It was estimated that in 2003, there were around 7,000 full time undergraduate students in design subjects (architecture, design, information design and interior design) (Power & Jansson 2006).
Spain: Responsibility for higher education is at a federal level, within the 17 regions of Spain. Design as a discipline was first introduced at
degree level in 1981. Design topics fall under a range of subject
disciplines, from engineering to the arts and thus precise data is difficult to establish. The number of graduates in architecture and engineering in 2005 was around 23,500 having increased from around 17,000 in 1996 (INE 2008).
Korea: Little data is publicly available for Korea. Anecdotally however, it would appear that there is a large emphasis being placed on design subjects. The number of students graduating from ‘architecture and building’ degree courses was estimated at around 13,500 in 2005 (OHIM 2008).
Thus, different national classification schemes, and particularly the multi disciplinary nature of design makes it difficult to compare national data on education.
Outputs: intellectual property
Trademarks represent outputs of design activity that are often ‘on the market’, whilst design registrations represent design activity that is close to market. Both provide some indication however of future economic activity. Evidence on intellectual property is both available and comparable. However, there are complexities in establishing values, as firms may register either nationally, regionally (e.g. EU) or internationally through WIPO. For simplicity, data from WIPO is presented here.
Trademark registrations: The UK has shown a steady increase in the number of WIPO trademarks in force during any one year. However, it is the weakest nation compared with the other countries. Data is not available for Sweden. In Korea, there has been a substantial increase over the last five years. Interestingly, Spain has had strong trademark activity for many years, but this is falling slightly in recent years (see table 1).
Design registrations: the UK is third behind Korea and Sweden. While the UK has remained relatively static, design registrations in Korea have risen substantially since 1999. Activity in Spain is relatively static, and there is an evident decline in Canada (see table 1).
Trademarks in
Sheffield, UK. July 2008 Design
registrations 1997 1998 1999 2000 2001 2002
UK 164 146 165 166 132 155
Korea 536 539 421 401 394 572
Canada 116 93 104 92 95 73
Spain 94 78 90 86 81 98
[image:9.595.116.545.66.189.2]Sweden 212 140 123 181 212 183
Table 1: WIPO Trademarks in force and Design Registrations per million population (WIPO 2008)
Outcomes: Design sector strength
The strength of the design sector has been chosen as a proxy for ‘outcomes’ from a National Design System. It is recognised that this is imperfect. There are similar issues in generating quantitative measures as for education, as choices must be made around the types of design agency to be included in any analysis. In the longer run, better outcome measures would be based around comparison of other national statistics (e.g. National exports, GDP etc) in relation to the input measures. However, until reliable input indicators are available, this is not possible.
UK: There is a weak classification of design firms at a national level in the UK. Industrial Design Consultants fall under Standard Industry Classification code 74.20/5, which also encompasses
machinery/industrial plant and commercial artists. Thus, readily available national statistics are not helpful. Instead, data must be sourced from published national surveys. Estimates of turnover of the design services sector range from around £4 bn (BDI 2001) to around £12.0 bn (Design Council 2006a). Design exports are estimated at around £0.7 - £0.75 bn (BDI 2001, DCMS 2007} However, exports in advertising, have doubled over the last ten years, whilst exports in design services have fallen since 2000.
Canada: Data on the design sector in Canada is only available at a regional level. Canada’s Specialised Design Industry is surveyed annually to capture statistics on performance, finance and activities (Statistics Canada 2005). Revenue in the design services sector was around $2.5 USBn in 2004 and of this, approximately 10% was export revenue (Statistics Canada 2005)
Sweden: there has been a rapid growth in the number of design firms since 1993, which mirrors the growth in education. In 2003, revenue from the design services sector was around €7.5M (Power & Jansson 2006).
Spain: design is represented mainly in four subsectors Product design, Graphic design, Interior design and Fashion design. In 2001, there were around 4,240 firms, with approximately 20,000 designers (DDI 2006). The turnover of the sector is about 136,000 million of pesetas (€817m), with exports at around 1,000 million pesetas (€6M) (Buesa et al 2001).
Sheffield, UK. July 2008
employed around 8,400 in 2003 and that in 2006, this had grown to 112,000, excluding architecture (KIDP 2003). The design services sector represents between 3% GDP (KIDP 2003) to 4.7% GDP (Dong Sung 2004). By comparison, revenue from the design sector in the UK represents around 2% GDP.
Implications
It is evident that data from the UK is difficult to collect and these difficulties are replicated in other nations. However, there are further difficulties, in that the definitions used between countries and the ‘place’ of design in national statistics varies significantly. In many nations, data on design is only available through one-off surveys, conducted by researchers or by the national design support organisations.
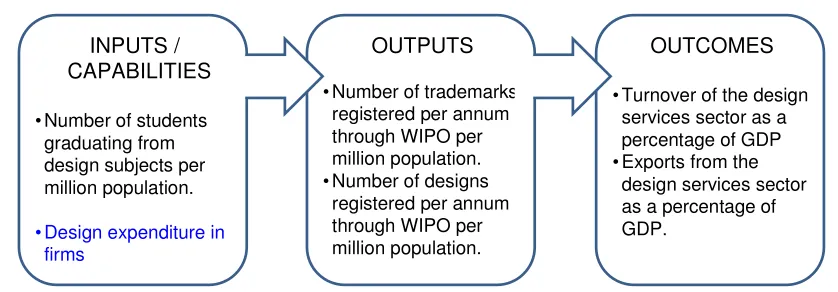
[image:10.595.123.542.393.539.2]As a result of this exploratory phase of the research, a revised framework of measures of national design performance for each category is presented in figure 3. The aim of this framework is not to provide an exhaustive set of measures, but to provide a small set of measures that are both relevant and are also potentially collectable across a large number of nations.
Fig 3: Measures in a revised National Design System
The key aspect of this framework for which no data is currently available is design expenditure in firms. An approach to collecting this data is being explored in the third stage of the project and is described in more detail below.
Design spend in firms
Design spend in firms was recognised early on as a potentially important measure in the overall National Design System. This phase of the project aimed to establish a means by which design spend in firms might be
ENABLING CONDITIONS
Total national investment in design promotion and support, as funded through a national support agency, as a percentage of national GDP.
OUTCOMES
• Turnover of the design services sector as a percentage of GDP • Exports from the
design services sector as a percentage of GDP.
OUTPUTS
• Number of trademarks registered per annum through WIPO per million population. • Number of designs
registered per annum through WIPO per million population.
INPUTS / CAPABILITIES
• Number of students graduating from design subjects per million population.
• Design expenditure in firms
Sheffield, UK. July 2008
estimated reliably. However, it is also recognised that collecting data at a national level is a long term ambition and not within the scope of this study.
Since the 1980s, there have been a number of landmark studies that have attempted to determine the benefits of investing in design. Black & Baker (1997) examined ‘design orientation’ in around 60 small engineering firms, using ‘company growth rate’ as a measure of success. However, they avoided any explicit measure of design expenditure. Walsh et al (1992)
identified a generally positive relationship between design consciousness and success in firms, again, avoiding expenditure as a measure of design
consciousness. Julhiet (1995) studied SMEs that invested in industrial design to determine the benefits. However, expenditure on industrial design was not measured, instead, firms were classified by the frequency with which they used design. Hertenstein et al (2001) also set out to establish the “value of design” in study of 51 companies across 4 sectors. In this case, design orientation was judged by an expert and this was compared against measures of financial performance. Finally, Gemser (2001) explored the
competitiveness of firms investing in industrial design, in comparison with those that do not invest in design. All of these studies aimed to measure the value of design investment. However, none of these studies captured this investment in financial terms. Hertenstein et al (2001) recognised this problem in achieving a valid financial input measure for design. In 1997, Sentance and Clark (1997) conducted a unique survey of around 800 firms. Their survey aimed to enable an estimation of expenditure of design at a national level. Limitations in this study include both the categorisation of ‘types’ of design and the choice of banded estimates as a basis for further scaling. Furthermore, the aim of this survey was not to establish a means by which companies might consistently estimate their holistic design spend.
Definitions of design can range from ‘science’ to ‘art’. However, broad definitions of design whilst in essence correct, are not helpful in pragmatic terms, and are difficult to apply to understand design in practice (Margolin 1989). This difficulty in attributing a concise definition is problematic when considering design expenditure in firms. To capture expenditure, a degree of definitional clarity is required to enable financial managers, who typically have little understanding of the subtler definitions of design, may collect data in a consistent way.
Methods
Sheffield, UK. July 2008
A model of design in firms
When considered from a firm’s perspective, many definitions treat design as a component of R&D, innovation or new product development. However, as Tarasewich (1996) noted product design does not depend on R&D and R&D does not always lead to new products. Bruce & Beassant (1992) suggested that design is the “purposive application of creativity to all the activities necessary to bring ideas into use either as product (service) or process innovations.” This view of design is reflected within the UK Community
Innovation Survey, where firms reported expenditure on ‘all design functions’ (including industrial design, product design, process design, service design and specifications for production or delivery). Thus, design is most often viewed as a subset of R&D. Drawing on the Frascati definitions, Tether (2006) makes the following distinctions between R&D and Design and Development:
Research: Experimental or theoretical work undertaken primarily to acquire new knowledge of the underlying foundations of phenomena and observable facts. It may or may not be directed towards a
specific practical application or objective.
Design and Development: Systematic creative or experimental work, carried out on an occasional or regular basis, that draws on knowledge from research and/or experience, that is directed to producing
products (including materials and services), to installing new processes and systems, or to improving substantially those already produced or installed.
It is also possible to distinguish between design that is technically focused and design which has its basis in the arts or in considerations of user experience (Cooper and Press, 1995). Dym (from Herbert Simon 1994 p15) suggests that this difference can be characterised by an artefacts ‘inner and outer’ characteristics, where the inner reflects engineering design and the outer reflects industrial design. However, it is also claimed that the industrial designer fulfils a wider role than the aesthetic and ergonomic aspects of products and can be viewed as the champions of user experiences, and especially those experiences related to physical products (Farr 1966). This distinction was found relevant in all of the case companies, with the exception of Case where the technical and experiential aspects of design were viewed as intimately intertwined. However, they recognised that in order to estimate expenditure, the distinction was useful. Thus, as a result of insights from literature and
exploratory cases, design activities within the function of product and service development can be further subdivided:
Technical design: Resolution of technical issues in the creation of products and services. This might include engineering skills such as mechanical engineering, electrical engineering and software design. It might also include the design of production processes and
technologies necessary to deliver services.
Sheffield, UK. July 2008
Design also plays a role in other aspects of the business, specifically in
communications and branding activities. These aspects of design are relevant in all firms, including those which do not frequently engage in the
development of new products and services. Kotler and Rath (1984) noted the role of design in optimising customer satisfaction, through their connection with products, environments, information and corporate identity. In the British Standard guide to managing design (BS7000 p2, p9), distinction is made between the design of corporate identity & culture, and promotions & customer support. Gorb (1990) similarly makes a distinction between
information design (graphic and multimedia) and corporate identity design. Again, this distinction proved useful and also relevant in the case companies. In Case 2 for example, the design of the corporate identity was viewed as a ‘one-off’ expenditure, whilst they continued to invest in the design of their website and business related promotions, such as attendance at exhibitions. This expenditure was considered distinct from their spend on product related advertising, and PR. Thus, in addition to design within product/service
development, there are two aspects of design related to promotions, communication and identity:
Corporate identity and culture: physical, operational and human features and values that give the organisation its unique personality
Promotion & customer support: advertising, promotional literature, packaging, instructions, manuals, presentations, showroom
environments, displays in stores, appearance courtesy and knowledge of staff, professionalism of delivery, help-lines, web-help, service
workshops etc
Finally, several of the case companies commented on design ‘within’ the business, that is not transparent to their customers. This might include the design of office layouts or the design of business and production processes. In case 6 for example, they noted that the the design of their premises aimed to create an effective work environment. Thus, a final category of design
expenditure, within the business can be described:
Design of the organisation, operating environments, workplaces
Design of business processes and systems
Thus, evidence from exploratory cases and literature demonstrated that design can be shown to contribute to the business in three distinct areas, as illustrated in figure 4.
Design within the business Design in the creation of products and services
Design in the communication, promotion and delivery of products and services and in the creation and communication of the identity of the business
Design of the organisation, operating environments, workplaces Design of business processes and systems Design relating to the technical/ engineering aspects of creating products and services Design of the user experience in the creation of products and services
Design as part of promotion, communication, branding, and distribution of products and services
Sheffield, UK. July 2008
Figure 4: conceptual model of design spend in firms
Capturing data on design spend is far from straight forward, as it is not typically identified within management accounts and, unlike R&D, is
distributed throughout the organisation. As a result, there is typically no single person who has an overview of design spend. Thus, data must be collected from various budget holders.
The product based firms initially viewed the technical aspects of design as the most prominent and they were not sure how to separate R&D and design. By distinguishing between design in the creation of products and design in the commercialisation of them, firms were better able to consider the breadth of design activities.
Some firms initially responded that they had no (or at least very little) spend on design. After further prompting, they realised that there were many places where design decisions were being taken, often by ‘non-designers’. Capturing this spend is potentially problematic. For example, any member of staff
producing a ‘creative’ output makes design decisions. This might be in the choice of colour of company work-wear or in the selection of fonts on a company report. There is a clear difference between ad-hoc decisions made on a daily basis and those made by skilled professionals. However, these ad-hoc decisions can have significant affect on customers and staff, and to ignore them would potentially downplay the potential impact of design in the firm.
Pragmatically, it is recognised that it is impossible to capture all design spend, as design is not a homogonous commodity. The skill and competence of the designer is also important. In capturing design spend, it is also not possible to distinguish between ‘good spend’ and ‘bad spend’.
Conclusions
This study has set out to answer the question “how might the strength of design in the UK be measured and compared against other nations?” A three phase methodology has been adopted, building on insights from an expert panel, international data and company case studies. As a result, this study makes the following contributions:
The concept of a National Design System has been proposed, drawing analogies with the well established concept of a National Innovation System. This forms the underpinning basis of a suite of measures to describe performance in design at a national level.
Through an iterative process, a number of key measures are proposed that go some way towards enabling international comparison.
However, it is evident that there is a lack of readily comparable data, as design related data is not captured consistently at a national level. Indeed, in most nations, design falls between the creative arts and technology.
Sheffield, UK. July 2008
Further work will include a wider survey of design spend in UK firms, based on the model proposed. In addition, evidence from around 35 nations is being pursued, based on the more precisely defined metrics proposed. Finally, the concept of a National Design System will be further explored, to test its validity and potential use. It is hoped that this will encourage greater consideration of the importance of design in the economy.
Acknowledgements
The work reported in this paper forms one part of the continuing effort to produce a National Design Scoreboard. This project is supported through the AHRC and EPSRC under the Design for the 21st Century Initiative. We are also grateful to project supporters at the Design Council and other National bodies, who have provided assistance to the project team.
References
BDI, (2001-2007), The British design industry valuation survey, British Design Innovation Black, CD & Baker, MJ (1987) Success through design. Design Studies, Vol.8, No.4 pp.207-216.
Bruce, M & Bessant, J (2002) Design in Business: Strategic Innovation Through Design, New York: Financial Times/Prentice Hall.
BS 7000-10:1995, design management systems — part 2, London: British Standards Institute
Buesa M, Hidalgo A, Llorens C, Zahera M, (2001), El diseño en España, estudio estrategico, Federación Española de Entidades de Promoción del Diseño Cooper R, Press M, (1995), The design agenda: a guide to successful design management, Wiley, Chichester
Cox G, (2005), The Cox Review: Enhancing the Role of Creativity in Driving the Productivity Performance of SMEs in the UK
DCMS, (2007), Creative Industries Economic Estimates: Statistical Bulletin 2007, Department for Culture Media and Sport, UK
DDI, (2006), Estudio del impacto económico del diseño en España 2005, Sociedad estatal para el desarrollo del diseño y la inovacion
Design Council, (2006), Design Council business plan 2006-2007: National Design policy in practice, The UK Design Council
Dong-Sung Cho, (2004), Design economic development and national policy: lessons from Korea, Design Management Review, Fall 04
DTI, (2003), Competing in the global economy: the innovation challenge, Department of Trade and Industry, UK
DTI, (2005), DTI economics paper number 15: Creativity Design and Business Performance, Department of Trade and Industry, UK
Dym C, (1994), Engineering Design: a synthesis of views, Cambridge University Press, UK Farr M, (1966), Design management, Hutchison Press, London
Gemser, G & Leenders, MAA (2001) How integrating industrial design in the product development process impacts on company performance. Journal of Product Innovation Management, Vol.18, No.1 pp.28-38.
Sheffield, UK. July 2008
Hertenstein J H, Platt M B, Brown D R, (2001), Valuing design: enhancing corporate performance through design effectiveness, Design Management Journal, Vol. 12 No. 3 pp.10-19.
HESA, (2008), Higher Education Statistics Agency, http://www.hesa.ac.uk/, accessed in January 2008
Hytonen J, Heikkinen H, (2003), Design policy and promotion programmes in selected countries and regions, Survey by Designium The New Centre for Innovation in Design, University of Art and Design, Helsinki
Instituto Nacional de Estadistica, (2008), http://www.ine.es/welcoing.htm Juilhet G B, (1995), French SMEs and design, research by order of Ministere de l’industrie, Paris, October
Kerssens-van Drongelen I, Nixon B and Pearson A, (2000), “Performance Measurement in Industrial R&D” International Journal of Management Reviews Vol.2 No.2 June pp.111-143.
KIDP (Korean Institute of Design Promotion), (2003), “Third Five Year Plan For Industrial Design Promotion”
(http://www.designdb.com/english/kidp/policy/down/The3rdFiveYearPlan.pdf ) Koch M P, (2004), A Nordic Innovation Strategy: Innovation policy structures of the Nordic countries, Norden: Nordic Innovation Centre, NIFU STEP Centre of Innovation Research, Norwaya
Kotler P, Rath A, (1984), Design: a powerful but neglected strategic tool, Journal of Business Strategy, Vol. 5 No. 2, p16
Livesey F, Minshall T, Moultrie J, (2006), Investigating the technology-based innovation gap for the United Kingdom, Report for the UK Design Council, University of
Cambridge, Institute for Manufacturing
Lundvall B, (2007), National innovation systems: analytical concept and development tool, Industry and Innovation, Vol. 14 No. 1, pp95-119
Margolin V, (1989), Design discourse: history theory criticism, University of Chicago Press
Nelson R R, (1993), National innovation systems: a comparative analysis, Oxford University Press Inc, USA
OHIM, (2008), Community trademark and community design statistics at
http://oami.europa.eu/en/mark/, Office of Harmonisation in the Internal Market Power D, (2005), International competitiveness and experience industries, Nordic Innovation Centre, collaboration between ISA, Visanu-National programme for development of innovation systems and clusters
Power D, Jansson J, (2006), Nordic design for a global market: Policies for developing the design industry in the Nordic Region, Nordic Council of Ministers Department of Cultural Policy, Nordic Innovation Centre
Sajeva M, Gatelli D, Tarantola S, Hollanders H, (2005), Methodology Report on European Innovation Scoreboard 2005, European Trend Chart on Innovation, EU Commission, 20 May 2005
Sentance, A & Clark, J (1997) The contribution of design to the UK economy. Design Council Research Workshop 1997. London, UK: The Design Council,
Statistics Canada, 2005, Specialized design services survey,
Sheffield, UK. July 2008
Strategic Direction, (2005) “Continuing Concerns Over European R&D: Ongoing Decline in R&D Could Seriously Affect Europe’s Manufacturing Future” Strategic Direction Vol 21 No 4 pp33 – 35
Tarasewich P, (1996), Design for success, IM, March/April, p28-32
Tether B S, (2006), Design in Innovation: Coming out from the Shadow of R&D, An analysis of the UK Innovation Survey of 2005, A Commissioned Study for the Department of Trade and Industry (DTI), London
Walsh V, Roy R, Bruce M, Potter S, (1992), Winning by design: technology, product design and international competitiveness, Blackwell Business, Oxford
WIPO, (2008), Trademark statistics at www.wipo.int/ipstats/en/statistics/marks/, Design registration statistics at www.wipo.int/ipstats/en/statistics/designs/
James Moultrie
James Moultrie is a University Lecturer in Innovation and Design Management. His research seeks to improve the utilisation of design skills and increase