Modeling the thickness dependence of the magnetic phase transition temperature in thin FeRh films
Thomas Andrew Ostler,1,2,*Craig Barton,3Thomas Thomson,3and Gino Hrkac2,4 1Universit´e de Li`ege, Physique des Mat´eriaux et Nanostructures, Li`ege, B-4000 Sart Tilman, Belgium
2College of Engineering, Mathematics and Physical Sciences, The University of Exeter, Exeter EX4 4SB, United Kingdom 3School of Computer Science, The University of Manchester, Oxford Road, Manchester M13 9PL, United Kingdom
4Institute for Analysis and Scientific Computing, TU Wien, Vienna, Austria
(Received 8 October 2016; revised manuscript received 9 December 2016; published 16 February 2017) FeRh and its first-order phase transition can open new routes for magnetic hybrid materials and devices under the assumption that it can be exploited in ultra-thin-film structures. Motivated by experimental measurements showing an unexpected increase in the phase transition temperature with decreasing thickness of FeRh on top of MgO, we develop a computational model to investigate strain effects of FeRh in such magnetic structures. Our theoretical results show that the presence of the MgO interface results in a strain that changes the magnetic configuration which drives the anomalous behavior.
DOI:10.1103/PhysRevB.95.064415
I. INTRODUCTION
Iron rhodium is an example of a magnetic material that undergoes a change in its magnetic order from antiferromag-netic to ferromagantiferromag-netic. Discovered almost 80 years ago [1], the origin of this unusual first-order metamagnetic phase transition is still debated [2–5]. In bulk alloys with atomically equal amounts of iron and rhodium the crystal structure is a B2 (CsCl-type) structure and changes from an antiferromagnet at low temperatures to a ferromagnet as the temperature is increased to around 50–60 K above room temperature. At that same point the lattice also undergoes a volume expansion [4]. There has been much debate as to whether this phase transition is driven by structural effects, such as lattice expansion, or purely magnetic interactions [6], such as magnetovolume effects or a superposition of the two [7]. In Ref. [5] it was shown that ultrashort laser pulses were able to drive the magnetic phase transition and concluded that the phase transition was accompanied, but not driven, by a lattice expansion. In contradiction to this, Mariager and co-workers [4] showed that the two occurred simultaneously, which has been supported by other theoretical works [7].
Previous studies have shown that it is possible to tune the temperature at which this transition occurs by, for example, varying the composition of iron or rhodium [8], doping with other elements [2,8,9], such as Pd, Pt, or Ir, or straining the sample [10]. Excitation of the phase transition occurs when energy is added to the system allowing one to use a wide range of stimuli to induce the metamagnetic phase transition, such as, electric field [11], temperature [1], applied magnetic fields [12,13], pressure [14], and spin-polarized currents [15] making it a tempting candidate for future magnetic-based technological devices.
Due to the flexibility in controlling this phase transition, FeRh is undergoing renewed interest [9,16–18] for the devel-opment of new devices, such as for low-energy electric-field controlled magnetic recording as an alternative to heat assisted magnetic recording [19], or as a magnetic switch using an exchange-coupled composite [8,20]. For such applications,
*thomas.ostler@ulg.ac.be
interfacing FeRh with other materials, such as ferromagnets [8] or ferroelectrics [19], is required to functionalize the phase transition. Potential applications are reinforced by very recent work demonstrating control of the phase transition of thick FeRh films in an artificial multiferroic [21]. However, realizing devices based on FeRh, for example, in magnetic storage will inevitably require thicknesses of the layers below 10 nm. This can pave the way to high magnetic densities and enable enhanced functionality in even smaller devices. In such applications the ability to simultaneously preserve and move the phase transition presents another significant challenge.
In 2013, Hanet al.[22] demonstrated the thickness depen-dence of the phase transition temperature in FeRh deposited on Si/SiO wafers with a MgO buffer layer. They showed that as the thickness of FeRh in those samples decreased the phase transition temperature also decreased. In the present paper we show an opposite trend occurs in FeRh deposited on single-crystal MgO [23]. Motivated by the need to understand the origin of these seemingly contradictory findings we have developed a model to try to understand this shift based on an assumed strain effect arising from the interface that modifies the underlying magnetic exchange interactions.
II. EXPERIMENTAL SETUP AND RESULTS We begin by describing the experimental results where a series of Fe50Rh50 thin films ranging from 2.5 to 10 nm were dc magnetron sputtered onto (001) MgO substrates [24]. The substrate preparation involved cleaning the MgO in isopropyl alcohol using an ultrasonic bath. The depositions were performed using a target power of 100 W from a 50:50 FeRh target and a working pressure of 3 mTorr. The substrate temperature during the deposition was 650°C which was increased to 750°C following deposition of the film to postanneal the FeRh.
FIG. 1. Experimentally determined magnetization as a function of temperature during heating (red triangular points) and cooling (blue circular points). The black curves are fits to the data in the region of the transition, and the data has been offset for clarity. The left inset shows the extracted transition temperature as a function of thickness using the procedure described in the text. The schematic inset on the right shows diagrammaticality the FeRh/MgO structure.
cut using a Southbay disk cutter to create an 8-mm disk for the VSM measurement. The diamagnetic contribution of the 8-mm MgO substrate disk (plus quartz holder) was measured using the same measurement conditions described previously and directly subtracted from the raw VSM data. This was then smoothed using a 10-point Savitzky-Golay digital filter to aid data analysis (points in Fig.1). To determine the phase transition temperature, we use a curve fitting procedure in the region of the phase transition (lines in Fig. 1). The fitting function we have used is as follows:
m(T)=a tanh
T −Ttr
T
+b, (1)
where Ttr is the transition temperature,T is a measure of
the slope of the transition,a is a measure of the saturation magnetization change, and b is an arbitrary offset which is close to zero. The phase transition temperature is then taken as the midpoint betweenTtr in the heating and the cooling case.
A schematic of the structure of the FeRh/MgO bilayer is shown in Fig. 1. The magnetization values were taken at 1 kOe as a function of temperature and are shown for different thicknesses of FeRh. From the data it can be seen that as the film thickness is reduced, an increase in the transition temperature is seen. This is shown explicitly in the left hand inset of Fig. 1. The curve shows an almost linear decrease initially with little change between the 7.5- and the 10-nm samples as the film thickness is increased. In comparison to that of the work by Hanet al.[22] the trend is reversed. Our aim is to attempt to understand if this increase in the phase transition temperature can be explained by the difference between the two substrates (Si/SiO/MgO buffer and MgO, respectively) rather than arising from the reduction in the thickness of FeRh itself, for example, due to loss of coordination at the surface.
We therefore developed a numerical model of the interface system which is outlined below.
A. Numerical model
There are a number of theoretical/computational models that can describe the ferromagnetic (FM) or antiferromagnetic (AFM) phase [25–28] and first-principles models can be used to understand the effects of interfaces and atomic termination [29]. The present approach allows for the simultaneous description of both the FM and the AFM phases using a single set of parameters, based on the atomistic spin dynamics formalism [30]. This second-principles model is based on a Heisenberg Hamiltonian as presented by Barker and Chantrell [6]. They showed that it is possible to reproduce the phase transition through the contribution of exchange terms, which implies a magnetic origin of the phase transition [3]. Such nonlinear terms were assumed to be important in explaining the nonlinear variation of the induced magnetic moment on rhodium arising from the Weiss field of Fe [31]. The Hamiltonian contains contributions from bilinear and four-spin exchange interactions,
H= −
i,j
Jij(Si·Sj)+
i,j,k,l
Dij kl(Si·Sj)(Sk·Sl). (2)
Here Jij and Dij kl are the bilinear and four-spin terms,
respectively, that take the values given in Ref. [6]. As was shown in Ref. [6], the four-spin term has a different temperature scaling from the bilinear term which gives rise to a competition between ferromagnetic (bilinear) and antiferromagnetic (four-spin) order. The dynamics of each spin in the systemSi are calculated by integrating the stochastic
Landau-Lifshitz-Gilbert (LLG) [32–34] equation,
˙S= − γi
1+λ2
i
μi
Si×[Hi+λiSi×Hi], (3)
where the fields are given by
Hi = −
∂H ∂Si
+ξi, (4)
andγi is the gyromagnetic ratio, λi is the coupling to the
thermal bath,μi is the atomic magnetic moment, and ξi, a
fluctuating stochastic term, which has zero mean and a variance given byξiα(t)ξjβ(t) =2λikBT μiδijδαβδ(t−t)/γi. The use
of the white-noise correlator in the present paper is justified on the grounds that we are considering equilibrium quantities and the effect of electronic correlations are negligible. In the Hamiltonian (1) an adiabatic approximation is made such that the rhodium moment is assumed to appear due to the Weiss field from iron on a much faster time scale than the precession of the magnetic moments. To that end, the Hamiltonian is written in terms of the Fe degrees of freedom only [6]. The four-spin term in the Hamiltonian that arises due to electron hopping among four sites must be calculated taking into account all of the 32 (nearest-neighbor quartets) [35]. The anisotropy constantKi we take from Ref. [36], although we
larger anisotropy value although not for FeRh on MgO. In our modeling we have neglected this large anisotropy value for the thinnest samples so that we could understand the effects of exchange only on the transition temperature. The constants used in Eq. (1) and the LLG equation [Eq. (3)] are given in TableI. The Zeeman field Btakes a small value of 0.05 T in thexdirection so that there is a predefined orientation for the spins.
We solve the LLG equation of motion using the Heun numerical scheme with a time step of 0.1 fs to ensure numerical stability. The in-plane system size is 48×48 unit cells, just under 15×15 nm2 with periodic boundary conditions in the x andy (in-plane) directions. Although the calculation of the bilinear exchange can be calculated straightforwardly using Fourier-based methods, the more computationally expensive four-spin term cannot. Thus to allow us to numerically calculate the thermal hysteresis curves within a reasonable time we choose this in-plane system size.
As shown in the right hand schematic inset of Fig.1, FeRh was deposited on MgO and whereas there is a reasonable match between FeRh orientated along the (110) directions and MgO along the (100) directions, there will inevitably be some strain at the interface due to lattice mismatch which will lead to a change in the electronic structure of the two materials. The effects of strain have been shown to be significant in FeRh [37]. In the following we have assumed that the strain induced in FeRh gives rise to a change in the exchange interactions due to the modification of the atomic positions and the electronic structure. The aim therefore was to vary systematically the exchange in the first few (here we assume five) planes immediately adjacent to the interface with MgO to see if: (i) the phase transition in FeRh is preserved, and (ii) how the exchange effects the transition temperature and how this compares with the present (and previous) experimental results. A schematic of the configurations used in the numerical model are shown in panel (a) of Fig.2.
Here we report a systematic study of the effects of FeRh film thickness with and without the presence of a strained FeRh layer. We show that by changing the magnetic order of the strained layers (Jm) and between the strained and unstrained
FeRh (Jint) the transition temperature can be tuned over a range of values. Panels (b) and (c) of Fig. 2 show the different possible configurations due to varying the exchange in the strained layer. We restrict ourselves to theB2 structure and a
G-type antiferromagnetic structure in both FeRh systems to restrict the possible phase space.
B. Thickness dependence—two-dimensional film In the first instance we have calculated thermal hysteresis loops for a range of isolated FeRh films with vacuum on both sides without the presence of strain (arising from the MgO interface). In practical terms this is achieved in the simulation by having periodic boundary conditions in the plane and having a vacuum region out of the plane (above and below). Figure3 shows the thermal hysteresis loops for a range of sample thicknesses where each data set is again offset for clarity. The thermal hysteresis loops are calculated by performing a heating and cooling simulation. First, starting at very high temperatures the temperature is lowered at a continuous rate of 500 K/ns until a temperature of at least 50 K above the transition temperature and then the rate is dropped to 50 K/ns until the phase transition is complete and then the lower temperatures are calculated at the 500 K/ns rate. Such rates are much faster than those normally used in magnetometry measurements. To qualitatively compensate for this discrepancy in our simulations we use a value of the coupling to the thermal bathλi =1.0, which is much larger
than measured experimentally [36] but somewhat accounts for the difference in time scales. For the heating case the opposite procedure is used, starting with the system in aG-type antiferromagnetic structure.
[image:3.608.53.558.569.750.2]Clearly for thin films of FeRh there is a consistent decrease in the temperature at which the phase transition occurs as a function of thickness (shown explicitly in the inset of Fig.3). This can be understood as follows: In an infinite bulk three-dimensional FeRh sample, the exchange interactions for each spin, both bilinear and four-spin, would be completely satisfied in all directions (there would be no free dangling exchange bonds, see the left-hand insets of Fig.4). In our case, there are 18 (6 nearest- and 12 next-nearest) neighbors.
TABLE I. Parameters entering into the Heisenberg Hamiltonian and Landau-Lifshitz-Gilbert equations.
Quantity Symbol Value Units
FeRh nearest-neighbor bilinear exchange energy Jij 0.4×10⁻²¹ (J)
FeRh next-nearest-neighbor bilinear exchange energy Jij 2.75×10⁻²¹ (J)
FeRh four-spin exchange energy Dij 0.23×10⁻²¹ (J)
FeRh—interface material exchange Jint Varied
Interface material nearest-neighbor exchange (bulk region) Jm Varied
FeRh anisotropy energy KFeRh −1.404×10⁻²³ (J)
FeRh gyromagnetic ratio γFeRh 1.024 (γe)
FeRh magnetic moment μFeRh 3.15 (μB)
FeRh thermal bath coupling constant λFeRh 1.0
Strained FeRh anisotropy energy Km −1.404×10⁻²³ (J)
Strained FeRh gyromagnetic ratio γm 1.024 (γe)
Strained FeRh magnetic moment μm 3.15 (μB)
FIG. 2. (a) Schematic of the system configuration used in the numerical simulations. The top (dark red) layer is FeRh of varying thickness (x) and the bottom (dark blue) is the region of strained FeRh of thickness 1.5 nm and can be either antiferromagnetic (Jm<0) as depicted here or ferromagnetic (Jm>0), not shown. Depending on the exchange within the strained layer (Jm) and the exchange at the interface (Jint) with the unstrained FeRh there are four possible configurations of the spins as depicted in (b) AFM and (c) FM. Depending on the combination ofJmandJint, either above or below the phase transition, there is always some frustration (green rectangles) where the exchange cannot be satisfied exactly. Note that the four-spin exchange is not included in the interface layer.
In the case of a two-dimensional film, at the surface the atoms cannot satisfy all bilinear or four-spin interactions. The bilinear term will still have full coordination within the plane, although it will only have half coordination perpendicular to the surface plane, therefore it will have five unsatisfied exchange interactions (one nearest neighbor and four next-nearest neighbors), shown schematically in the upper right panel of Fig.4.
In the case of the four-spin term the lack of coordination has a much larger impact. For the four-spin term the central atomiin the bulk has 32 quartets, whereas at the interface it has half that number due to the ways of permuting over the four basic quartets [35].
[image:4.608.114.499.68.203.2]As the in-plane dimensions of the calculated systems are fixed, one may expect a linear scaling of the phase transition temperature with thickness as the number of missing exchange
FIG. 3. Calculated thermal hysteresis curves for a range of FeRh thicknesses from 2 nm (lower) to 8 mn (upper) with the red lines representing the heating curve and the blue lines representing the cooling curve. The inset shows the transition temperature as a function of film thickness (taken as the midpoint between the cooling and the heating curves and found by fitting the data as discussed in the text).
interactions remains constant, therefore the surface-area-to-volume ratio decreases linearly. However, the scaling of the phase transition temperature with thickness as shown in the inset of Fig.3 is nonlinear. This arises due to the fact that the bilinear and four-spin terms have a different temperature dependence [5].
[image:4.608.312.558.427.614.2]Using the model that we have outlined we now extend the study to include a strained layer of FeRh. The thickness of the total amount of FeRh (including the strained layer) is varied as in Fig. 3, however, the amount of strained
[image:4.608.51.296.505.678.2]250 300 350 400
2 4 6 8 10 12
Ttr
[K]
FeRh Thickness [nm] Jint=-12.5, Jm=-12.5 meV
Jint=+12.5, Jm=-12.5 meV
Jint=+12.5, Jm=+12.5 meV
Jint=-12.5, Jm=+12.5 meV
[image:5.608.51.294.68.245.2]No Strained Layer
FIG. 5. Numerically determined transition temperatures as a function of FeRh thickness for a 1.5-nm strained FeRh layer. The red curves show the case for an antiferromagnetic interface material (Jm<0), which both show an increase in the transition temperature, although the effect is reduced for a ferromagnetic interface coupling (Jint). For a ferromagnetic interface material (Jm>0), the transition temperature is reduced, although the change is small for a ferromagnetic interface coupling (Jint>0).
FeRh is fixed as shown in the schematic Fig. 2(a). We vary the exchange between the FeRh and the strained layersJint and within the strained layer itself Jm, giving rise to four possible configurations for the magnetic structure. This is depicted for an antiferromagnetic strained layer Fig.2(b)and a ferromagnetic one Fig.2(c). Interestingly, depending on the combination ofJintandJm, there is always an uncompensated (frustrated) interface as shown schematically by the green rectangles in Figs.2(b)and2(c). This frustration can be above or below the phase transition temperature as depicted. It has been shown previously that depending on the thickness of FeRh and whether the termination at the interface is an Fe or Rh atom the interface magnetism can change fromG-type AFM (for the Fe termination) to FM (for the Rh termination) [29].
C. Ultrathin interface—effect of sign of interface and bulk exchange
Due to the spin pairing at the interface, the effect of the interface exchange plays a significant role in modifying the phase transition temperature. This is shown in Fig.5whereby a relatively small magnitude of the exchange (|Jint|and|Jm|) is used in the strained layer (12.5 meV) and the signs of each ofJintandJmare varied.
From Fig.5we see that by including a strained layer, de-pending on the balance between the interface (Jint) and the bulk exchange of the strained layer (Jm), a change in the transition temperature is observed. For an antiferromagnetic interface layer (Jm<0), there is a consistent increase in the phase transition temperature, particularly below 6 nm of FeRh. As mentioned above, this is the consequence of uncompensated (frustrated) spins. The antiferromagnetic interface for both an antiferromagnetic and a ferromagnetic material gives the
largest change in the phase transition temperature (with respect to the system with no interface, black curve).
A negative value ofJm produces a strained layer with an antiferromagnetic structure which favors the antiferromagnetic (low-temperature) ground state and gives a higher transition temperature (Ttr) than the case of positiveJm, which favors a ferromagnetic ground state, i.e., the high-temperature phase pushes the transition temperature to lower values. For 8- and 10-nm FeRh thicknesses the transition temperatures are close to those for the case without an interface as the system becomes dominated by the FeRh layer. As the thickness is decreased the interface coupling becomes more important and starts to dominate, which makes growing thin-film structures with a perfect interface very challenging.
D. Ultrathin interface—effect of the strength of the bulk exchange value
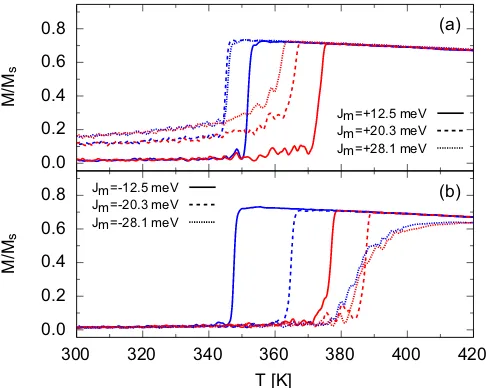
So far we have shown the dependence of the phase transition temperature for different configurations of the strained layer. The value of the exchange used was a relatively low value, around 20% that of bulk bcc iron. For the antiferromagnetic strained layer configuration, increasing the exchangeJmmight be expected to increase frustration, resulting in a reduced transition temperature. However, as we show in Fig. 6 for a 6-nm film, the phase transition temperature shows a clear increase. This is due to the fact that the antiferromagnetic order in the interface layer supports the four-spin terms as discussed above. For the ferromagnetic strained layer (Jm>0), the trend is the opposite as the exchange supports ferromagnetic order in the FeRh layer. There is also an increasing magnetization below the phase transition temperature as the interface material imposes interface ferromagnetism with a larger correlation length with increasing exchange.
Thus far, decreasing the FeRh thickness has led to a reduction in the transition temperature. We initially assumed a low value of the exchange in the strained layer, and the question now arises, how does the transition temperature vary with thickness for different values of the exchange? Therefore, we performed simulations increasing the size of the exchange value in the strained region from −12.5 meV to a value of
0.0 0.2 0.4 0.6 0.8
300 320 340 360 380 400 420 (b) 0.0
0.2 0.4 0.6
0.8 (a)
M/M
s
T [K]
Jm=-12.5 meV Jm=-20.3 meV Jm=-28.1 meV
M/M
s
[image:6.608.51.294.69.263.2]Jm=+12.5 meV Jm=+20.3 meV Jm=+28.1 meV
FIG. 6. Simulated thermal hysteresis curves (blue curve for cooling and red curve for heating) for a 6-nm FeRh layer and both (a) ferromagnetic and (b) antiferromagnetic strained layers for a range of exchange values of|Jm|and|Jint|. The ferromagnetic interface
shows a decreasing transition temperature with increasing exchange, whereas the antiferromagnetic is increasing.
III. DISCUSSION
By constructing a numerical model of ultrathin FeRh layers subject to possible strain at an interface with MgO we have shown that, depending on how the presence of the interface modifies the exchange interaction, the phase transition temperature as a function of film thickness can vary significantly. The exchange interaction in the strained layer plays an important role in determining the phase transition temperature, depending on whether it supports antiferromag-netic or ferromagantiferromag-netic interactions. The results suggest that, depending on the choice of substrate, it is possible to tune the phase transition temperature. Furthermore, the general trends can be used to interpret experimental measurements. The numerical results are in good agreement with the results
300 320 340 360 380 400
0 2 4 6 8 10 12
Ttr
[K]
FeRh Thickness [nm] Jm,int=-12.5 meV
Jm,int=-20.3 meV
Jm,int=-25.0 meV
Jm,int=-28.1 meV
No Interface
FIG. 7. Calculated transition temperature for a range of FeRh thicknesses for an antiferromagnetic strained FeRh layer (Jm<0 and Jint<0) for a range of exchangeJm and Jint(Jm=Jint). For low exchange in the strained layer (e.g., the red curve) there is an increasing transition temperature with thickness. The trend is reversed as the exchange is increased in the interface layer (the blue curve).
of a series of experimental samples showing a similar trend of increasing transition temperature with decreasing thickness. Importantly we have shown that the effect of interface effects become increasingly important for FeRh as one tries to engineer ultrathin films, particularly for functional devices based on FeRh [17,21,38].
ACKNOWLEDGMENTS
The authors acknowledge support from the Vienna Science and Technology Fund (WWTF) under Grant No. MA14-44 (G.H.), through the EPSRC Grant No. EP/K008412/1 (G.H. and T.T.), and from the Royal Society under Grant No. UF080837 (G.H.). T.A.O. gratefully acknowledges the Marie Curie incoming BeIPD-COFUND fellowship program at the University of Li`ege.
[1] M. Fallot and R. Hocart, Sur l’apparition du ferromagn´etisme par ´el´evation de temperature dans alliages de fer et de rhodium, Rev. Sci.77, 498 (1939).
[2] J. S. Kouvel, Unusual nature of the abrupt magnetic transition in FeRh and its pseudobinary variants,J. Appl. Phys.37,1257 (1966).
[3] R. Y. Gu and V. P. Antropov, Dominance of the spin-wave contribution to the magnetic phase transition in FeRh,Phys. Rev. B72,012403(2005).
[4] S. O. Mariageret al., Structural and Magnetic Dynamics of a Laser Induced Phase Transition in FeRh,Phys. Rev. Lett.108, 087201(2012).
[5] G. Juet al., Ultrafast Generation of Ferromagnetic Order via a Laser-Induced Phase Transformation in FeRh Thin Films,Phys. Rev. Lett.93,197403(2004).
[6] J. Barker and R. W. Chantrell, Higher-order exchange inter-actions leading to metamagnetism in FeRh,Phys. Rev. B92, 094402(2015).
[7] P. M. Derlet, Landau-Heisenberg Hamiltonian model for FeRh, Phys. Rev. B85,174431(2012).
[8] J. U. Thiele, S. Maat, and E. E. Fullerton, FeRh/FePt exchange spring films for thermally assisted magnetic recording media, Appl. Phys. Lett.82,2859(2003).
[9] S. P. Bennett et al., Direct evidence of anomalous interfacial magnetization in metamagnetic Pd doped FeRh thin films,Sci. Rep.5,9142(2015).
[10] V. D. Buchel’nikov et al., Magnetic shape-memory alloys: phase transitions and functional properties,Phys.-Usp.49,871 (2006).
[11] L. C. Phillipset al., Local electrical control of magnetic order and orientation by ferroelastic domain arrangements just above room temperature,Sci. Rep.5,10026(2015).
[image:6.608.320.558.70.245.2][13] M. Lovinget al., Tailoring the FeRh magnetostructural response with Au diffusion,J. Appl. Phys.112,043512(2012). [14] L. I. Vinokurova, A. V. Vlasov, and M. Pardavi-Horv´ath,
Pressure effects on magnetic phase transitions in FeRh and FeRhIr alloys,Phys. Status Solidi B78,353(1976).
[15] T. Naito, I. Suzuki, M. Itoh, and T. Taniyama, Effect of spin polarized current on magnetic phase transition of ordered FeRh wires,J. Appl. Phys.109,07C911(2011).
[16] R. Baruaet al., Tuning the magnetostructural phase transition in FeRh nanocomposites,J. Appl. Phys.113, (2013).
[17] X. Martiet al., Room-temperature antiferromagnetic memory resistor,Nature Mater.13,367(2014).
[18] F. Pressacco et al., Stable room-temperature ferromagnetic phase at the FeRh(100) surface,Sci. Rep.6,22383(2016). [19] R. O. Cherifiet al., Electric-field control of magnetic order above
room temperature,Nature Mater.13,345(2014).
[20] T. Gotoet al., Growth of FeRh thin films and magnetic properties of FePt/FeRh bilayers,J. Magn. Magn. Mater.272-276,E791 (2004).
[21] S. P. Bennettet al., Giant controllable magnetization changes induced by structural phase transitions in a metamagnetic artificial multiferroic,Sci. Rep.6,22708(2016).
[22] G. C. Hanet al., Magnetic stability of ultrathin FeRh films,J. Appl. Phys.113,17C107(2013).
[23] J. Caoet al., Magnetization behaviors for FeRh single crystal thin films,J. Appl. Phys.103,21(2008).
[24] C. W. Barton, T. A. Ostler, D. Huskisson, C. J. Kinane, S. J. Haigh, G. Hrkac, and T. Thomson, Substrate induced strain field in FeRh epilayers grown on single crystal MgO (001) substrates, Sci. Rep. (to be published).
[25] J. Kudrnovsk´y, V. Drchal, and I. Turek, Physical properties of FeRh alloys: The antiferromagnetic to ferromagnetic transition, Phys. Rev. B91,014435(2015).
[26] V. L. Moruzzi and P. M. Marcus, Antiferromagnetic-ferromagnetic transition in FeRh,Phys. Rev. B46,2864(1992).
[27] J. A. Ricodeau and D. Melville, Model of the antiferromagnetic-ferromagnetic transition in FeRh alloys,J. Phys. F: Met. Phys. 2,337(1972).
[28] L. M. Sandratskii and P Mavropoulos, Magnetic excitations and femtomagnetism of FeRh: A first-principles study,Phys. Rev. B 83,174408(2011).
[29] S. Jekal, S. H. Rhim, S. C. Hong, W.-j. Son, and A. B. Shick, Surface-termination-dependent magnetism and strong perpendicular magnetocrystalline anisotropy of an FeRh(001) thin film,Phys. Rev. B92,064410(2015).
[30] T. A. Ostleret al., Crystallographically amorphous ferrimagnetic alloys: Comparing a localized atomistic spin model with experiments,Phys. Rev. B84,024407(2011).
[31] O. N. Mryasov, Magnetic interactions and phase transformations in FeM, M=(Pt,Rh) ordered alloys,Phase Transitions78,197 (2005).
[32] B. Skubic, J. Hellsvik, L. Nordstr¨om, and O. Eriksson, A method for atomistic spin dynamics simulations: implementation and examples,J. Phys.: Condens. Matter20,315203(2008). [33] T. L. Gilbert, A phenomenological theory of damping
in ferromagnetic materials, IEEE Trans. Magn. 40, 3443 (2004).
[34] W. F. Brown, Thermal fluctuations of a single-domain particle, Phys. Rev.130,1677(1963).
[35] O. G. Mouritsen, B. Frank, and D. Mukamel, Cubic Ising lattices with four-spin interactions,Phys. Rev. B27,3018(1983). [36] E. Manciniet al., Magnetic phase transition in iron–rhodium
thin films probed by ferromagnetic resonance,J. Phys. D: Appl. Phys.46,245302(2013).
[37] Z. Q. Liuet al., Full Electroresistance Modulation in a Mixed-Phase Metallic Alloy,Phys. Rev. Lett.116,097203(2016). [38] S. B. Roy, P. Chaddah, V. K. Pecharsky, and K. A. Gschneidner,